

Abstract
Background
The role of the renin‐angiotensin‐aldosterone system in cats with chronic kidney disease (CKD) is incompletely understood.
Objective
To characterize components of the intrarenal renin‐angiotensin system (RAS) in cats with CKD.
Animals
Eleven cats with naturally occurring CKD (CKD group) and 8 healthy control cats.
Methods
Renal tissue samples were evaluated by reverse‐transcription polymerase chain reaction for renin, angiotensinogen, angiotensin‐converting enzyme (ACE), and angiotensin II type 1 receptor transcript levels, and by liquid chromatography‐mass spectrometry for quantification of angiotensin I, II, III, and IV concentrations. Linear mixed models were used to compare gene transcript levels and concentrations of angiotensin peptides between groups.
Results
Cats of the CKD group were significantly older (P < .001) and more likely to be neutered (P = .007) than healthy control cats. Kidneys from cats with CKD had significantly higher transcript levels of angiotensinogen (P < .001) and lower transcript levels of ACE (P < .001) than those from control cats. Renal angiotensin I concentrations were increased in CKD compared with control kidneys (P = .001). No other significant differences in renal transcript levels or angiotensin peptide concentrations were noted between groups.
Conclusion and Clinical Importance
The intrarenal RAS might be activated in cats with CKD. Small sample size and differences in age, neuter status, and dietary sodium intake between groups might have limited the ability to identify a significant difference in concentration of renal angiotensin II.
Keywords: angiotensin‐converting enzyme, angiotensinogen, equilibrium analysis, tissular RAAS
Abbreviations
- ACE
angiotensin‐converting enzyme
- ACE
gene for angiotensin‐converting enzyme
- AGT
angiotensinogen
- AGT
gene for angiotensinogen
- Ang
angiotensin
- AGTR1
gene for angiotensin II type 1 receptor
- BP
blood pressure
- CKD
chronic kidney disease
- GAPDH
gene for glyceraldehyde 3‐phosphate dehydrogenase
- LC‐MS/MS
liquid chromatography‐mass spectrometry/mass spectrometry
- PRA
plasma renin activity
- RAS
renin‐angiotensin system
- REN
gene for renin
- RPS7
ribosomal protein S7
- SBP
systolic blood pressure
1. INTRODUCTION
The renin‐angiotensin‐aldosterone system (RAAS) is a major regulator of systemic arterial blood pressure (BP) and fluid and electrolyte balance. 1 Its main effector peptide, angiotensin (Ang) II, promotes renal and gastrointestinal sodium reabsorption, aldosterone secretion, vascular smooth muscle contraction, and dipsogenic, pressor and tachycardic responses, while inhibiting renin release—actions that are achieved predominantly through interaction with the Ang II type 1 receptor. 2 In health, these responses conserve sodium and maintain normal circulating blood volume and BP. Interaction of Ang II with the Ang II type 1 receptor also induces the expression, transcription or both of growth factors and proliferative cytokines, including transforming growth factor‐β1, and perpetuates the production of nephrotoxic reactive oxygen species, leading to inflammation, fibroblast formation, and collagen deposition. 3 , 4 , 5 , 6 As a result, in human beings, chronic activation of the RAAS is recognized as a critical factor in the progression of chronic kidney disease (CKD), 7 , 8 and its inhibition is an integral part of renal disease treatment. 9
Studies characterizing the circulating RAAS in cats with CKD have yielded variable results. As a population, cats with naturally occurring kidney disease and systemic arterial hypertension have lower mean plasma renin activity (PRA) and higher mean plasma aldosterone concentration than healthy controls, 10 , 11 , 12 suggesting that RAAS activation may not play a major role in the pathogenesis of CKD‐associated hypertension in this species. However, in a subset of these patients, evidence of RAAS activation was suggested by PRA and aldosterone concentrations that fell inappropriately within or above associated reference ranges. Similarly, in experimentally induced CKD in cats, both PRA and circulating aldosterone concentrations were increased in some, but not all, described models. 13 , 14
Recently, focus on the role of the RAAS in the pathophysiology of organ injury has been extended to that of the local, tissue renin‐angiotensin system (RAS). 15 Rodent models suggest that the kidney is capable of producing all RAS components, allowing local formation of Ang II by pathways that are subject to feedback mechanisms that operate independently of the traditional, systemic RAAS. 4 , 16 , 17 , 18 For example, data from rodent models of systemic hypertension suggest the intrarenal RAS can be active in the absence of evidence of systemic RAS activation, with hypertensive individuals experiencing appropriately suppressed PRA and juxtaglomerular renin immunoreactivity along with increased distal nephron renin expression and local angiotensinogen (AGT) production, the latter combination contributing to increased intratubular Ang I and Ang II concentrations. 19 , 20
Little work has been done to characterize the intrarenal RAS in companion animal species. Although a study of cats with CKD reported tubular and interstitial Ang II immunoreactivity that correlated with glomerulosclerosis and cellular infiltration, but not tubulointerstitial fibrosis, 21 most investigations to date have evaluated components of the systemic RAAS, leaving the importance of the local tissue system largely undescribed.
Our objective was to characterize the renal expression of RAS components in healthy cats and in cats with naturally occurring CKD. We hypothesized that compared to kidneys from healthy control cats, those from cats with CKD would demonstrate increased transcript levels of genes encoding RAS proteins and increased concentrations of angiotensin peptides.
2. MATERIALS AND METHODS
2.1. Study design
Our study was cross‐sectional and performed on banked renal tissue samples collected from client‐owned cats with naturally occurring CKD (CKD group), and healthy control cats (control group) as part of a separate study designed to investigate pathways of renal fibrosis. 22 All activities related to the original study were approved by the University of Georgia Institutional Animal Care and Use Committee (Animal Use Protocol A2017 05‐008‐Y3‐A1).
2.2. Animals and enrollment criteria
Enrollment criteria used in the study from which renal tissues originated, including methods used to establish a diagnosis of CKD, have been published previously. 22 Briefly, renal tissues from the CKD group were obtained from client‐owned cats presented to primary care and referral veterinary centers for euthanasia. Available clinicopathologic data reflecting renal function and systemic arterial BP were recorded upon review of each cat's medical record. Cats were excluded if they were known to have received a RAAS antagonist (ie, an angiotensin‐converting enzyme [ACE] inhibitor, angiotensin receptor blocker, or mineralocorticoid receptor antagonist) or a short‐acting corticosteroid in the 14 days preceding euthanasia, or if they received a depot corticosteroid injection in the 6 months before euthanasia. For the present study, samples also were excluded if cats had received other medications with known impact on the RAAS (eg, beta‐adrenergic blockers, calcium‐channel blockers, furosemide) in the 14 days preceding euthanasia.
Renal tissues for the healthy control group were obtained from adult, purpose‐bred, mixed breed, male neutered cats participating in unrelated terminal studies having no impact on renal structure and function, and from adult cats that were euthanized as part of population control measures at a local animal control facility. Blood and urine samples were collected immediately before or after euthanasia with pentobarbital. Complete blood count, serum biochemistry profiles, urinalysis and urine protein‐to‐creatinine ratios (Clinical Pathology Laboratory of the University of Georgia), and symmetric dimethylarginine concentration measurement (IDEXX Laboratories) were performed for all control cats. Control cats were deemed healthy based on normal findings of physical examination and necropsy and were deemed to have normal renal function and structure on the basis of renal histology, serum biochemistry, and urinalyses. Cats obtained from the animal control facility population were screened for retroviral infections using feline immunodeficiency virus antibody and feline leukemia virus antigen testing (SNAP FIV/FeLV Combo Test, IDEXX Laboratories, Westbrook, Maine), and excluded if positive for 1 or both.
2.3. Renal tissue sample collection
For all cats, renal tissues were collected within 1 hour of euthanasia. Kidneys were removed through a midline laparotomy and sectioned longitudinally. One‐half of each kidney was minced and placed in RNA stabilization solution (RNAlater, QIAGEN, Valencia, California). Thus, renal cortex and medulla, in proportions equal to those present in vivo, were present in each specimen. After overnight incubation at 4°C, tissues were removed from RNA stabilization solution, homogenized using a mortar and pestle, divided into 30 mg aliquots, and stored at −80°C until further analysis.
2.4. Renal RAS gene transcription
Reverse‐transcription and quantitative PCR were performed to quantify transcript levels of AGT, renin (REN), ACE, and Ang II type 1 receptor (AGTR1) in banked renal tissue homogenates from each kidney from all cats in the CKD and control groups. Feline gene specific primers were selected from previously reported studies 23 , 24 when available, or designed using oligonucleotide prediction software (Table 1). 25
TABLE 1.
Primer sequences for quantitative PCR
| Gene | Ensemble ID/ NCBI Access. No. | Primer sequence (5′ → 3′) | Fragment size (bp) | Source |
|---|---|---|---|---|
| GAPDH | ENSFCAG 00000006874 |
for: GCTGCCCAGAACATCATCC rev: GTCAGATCCACGACGGACAC |
134 | Riedel et al. 23 |
| RPS7 | NM_001009832 |
for: GTCCCAGAAGCCGCACTT T rev: CACAATCTCGCTCGGGAA AA |
74 | Kessler et al. 24 |
| AGT | XM_011287235.1 |
for: TCT TGA CGT GGC TGA AGA ATC rev: AGC AGG TCC TGA AGG TCA TA |
94 | IDT PrimerQuest 25 |
| REN | ENSFCAG 00000002902 |
for: CGA CCC CCA GTA TTA CCA AG rev: CCT CCT CAC AGA CCA AGG TG |
116 | Riedel et al. 23 |
| ACE | XM_003997083.1 |
for: GCT GAA ACC CCT GTA CCA GA rev: GAG GTG TTC CAG ATC CTC CA |
133 | Riedel et al. 23 |
| AGTR1 | ENSFCAT00000000716 |
for: AAG ATC GCT TCA GCC AGT GT rev: TTG GCC ATA AGC ATT GTA CG |
134 | Riedel et al. 23 |
Abbreviations: ACE, gene for angiotensin‐converting enzyme; AGT, gene for angiotensinogen; AGTR1, gene for angiotensin II type 1 receptor; GAPDH, gene for glyceraldehyde 3‐phosphate dehydrogenase; IDT, integrated DNA technologies; REN, gene for renin; RPS7, gene for ribosomal protein S7.
For each sample, total RNA was extracted from 30 mg of tissue homogenate using a commercially available RNA extraction kit (RNeasy Plus Mini Kit, QIAGEN, Valencia, California). Integrity of the isolated RNA was confirmed by quantification using a spectrophotometer (NanoDrop Spectrophotometer, Thermo Fisher Scientific, Waltham, Massachusetts), followed by visualization of 18S and 28S ribosomal bands on 1.2% agarose gels. A total of 1 μg of RNA extracted from each sample was treated with deoxyribonuclease (ezDNase, Invitrogen, Carlsbad, California), and reverse‐transcribed using a cDNA reaction master mix (SuperScript IV VILO Master Mix, Invitrogen, Carlsbad, California). Quantification was performed in an automated cycler (CFX96, Bio‐Rad Laboratories, Hercules, California) using 20 μL reactions containing 10 μL of SYBR Green Supermix (SsoAdvanced SYBR Green Supermix, Bio‐Rad Laboratories, Hercules, California), 5 PMol of each primer (Table 1), and 9 μL of complementary DNA sample at a 1:40 dilution. Thermal cycling conditions consisted of an activation step at 95°C for 30 seconds, followed by 36 amplification cycles (95°C for 15 seconds for denaturation and 60°C for 30 seconds for annealing and extension), and a melt curve step (60‐95°C, increasing at increments of 0.5°C every 5 seconds). All reactions were performed in triplicate and average values were used for further analyses. A no reverse transcriptase control was included for each sample and 3 no template controls were used in each plate. In accordance with the sample maximization method, 26 for each gene, all samples were analyzed in two 96‐well plates. A standard sample was analyzed in triplicate with glyceraldehyde 3‐phosphate dehydrogenase (GAPDH) primers in each plate and used as an inter‐run control for the entire gene study.
Transcript levels of AGT, REN, ACE, and AGTR1 were normalized to those of 2 reference genes, GAPDH and ribosomal protein S7 (RPS7), using the GENorm method. 27 Reference genes were selected based on the efficiency of their primers, and their stability value (M value <0.5) and coefficient of variation (<.25) when tested in a complete set of the experiment's samples. After normalization, transcript levels were scaled to those of the lowest sample for each target gene.
Primer efficiencies were calculated using the Pfaffl method based on standard curves performed with serial dilutions of cDNA (factor of 2 or 4; 3 replicates) starting at a 1:20 dilution. Quantitative PCR products were confirmed on 1.2% agarose gels. Amplicons were cloned into a vector system (PGEM‐T easy vector, Promega, Madison, WI) and sequenced bi‐directionally by chain termination (Molecular Cloning Laboratories, San Francisco, California). Resulting sequences were confirmed using the National Center for Biotechnology Information Basic Local Alignment Search Tool against the feline genome. 28
2.5. Renal angiotensin peptide equilibrium analysis
Equilibrium concentrations of Ang I (ie, Ang 1‐10), Ang II (ie, Ang 1‐8), Ang III (ie, Ang 2‐8), and Ang IV (ie, Ang 3‐8) were quantified in RNA‐stabilization‐solution‐preserved renal tissue homogenates by a commercial laboratory (Attoquant Diagnostics, Vienna, Austria) using previously described methods. 29 Each angiotensin peptide was measured in samples from both kidneys in CKD group cats, and from the right kidney only in control group cats. Briefly, frozen renal tissue samples (80‐100 mg) were homogenized using a mortar and pestle under liquid nitrogen. The frozen tissue powder was dissolved at 100 mg/mL in 6M aqueous guanidinium chloride (Guanidinium chloride, Sigma‐Aldrich, Steinheim, Germany) supplemented with 1% (v/v) trifluoroacetic acid (Trifluoroacetic acid, Sigma‐Aldrich, Steinheim, Germany) by cooled sonication using a 2‐mm microtip (2‐mm microtip, Sonics and Materials, Newton, New Jersey). Stable isotope‐labeled internal standards for individual angiotensin metabolites were added to tissue homogenates at 200 pg/mL and stored at −80°C until analysis. Liquid chromatography‐mass spectrometry/mass spectrometry (LC‐MS/MS) analysis for tissue angiotensin quantification was performed using a reversed‐phase analytical column operating in line with a mass spectrometer (Xevo TQ‐S triple quadruple mass spectrometer, Waters Corporation, Milford, Massachusetts).
The LC‐MS/MS analytical assay for biological samples was validated according to the European Medicine Agency's Guideline on bioanalytical method validation adopted on 21 July 2011 (https://www.ema.europa.eu/en/documents/scientific-guideline/guideline-bioanalytical-method-validation_en.pdf). Between‐ and within‐run precision and accuracy of the assay were <15% at the lower limit of quantification and <5% in the mid‐range of quantification for all analytes of interest.
2.6. Statistical analyses
Distributions of values for clinical variables by study group were examined for normality by visual assessment of histograms and normal quantile plot, and the Shapiro‐Wilk test. Normally distributed clinical data are presented as mean ± SD and compared between groups using the 2‐sample, unequal variance t‐test. Non‐normally distributed data are presented as median (range) and compared between groups using the Mann‐Whitney U test. For the purposes of statistical analyses, urine specific gravity values reported as >1.060 and serum urea nitrogen concentrations reported as >100 mg/dL or >180 mg/dL were assigned values of 1.061, 101, and 181, respectively. Categorical data were compared using the Fisher's exact test.
Differences between groups with respect to gene transcript levels and angiotensin peptide concentrations were assessed using linear mixed models with cat included as a random effect to account for repeated measurements (ie, analyses of each kidney from the same individual), and group as a fixed nominal effect. Models used restricted maximum likelihood estimation, and degrees of freedom were computed using the Kenward‐Roger procedure. Models with different residual covariance structures were compared using Akaike's information criterion to determine which model provided the best fit to the data. Normality of residuals was assessed using normal quantile plots and the Shapiro‐Wilk test. Positively skewed variables were log‐transformed before analysis to improve the approximation to a normal distribution. Geometric means and 95% confidence intervals (CI) were calculated by back transforming the means and confidence limits that were estimated on the log‐transformed scale. Fisher's exact test was used to compare groups with respect the proportion of cats that had angiotensin IV concentrations below the assay's lower limit of quantification (ie, < 4 fmol/g). All tests assumed a 2‐sided alternative hypothesis and P‐values <.05 were considered significant. Analyses were performed using commercially available software (Stata version 16.0, StataCorp LLC, College Station, Texas; GraphPad Prism for Mac, version 8, GraphPad Software Inc, La Jolla, California).
3. RESULTS
3.1. Animals and samples
Tissue samples from 11 cats with CKD and 8 healthy cats were included. Samples from 1 cat with CKD, which was enrolled in the original study, 22 were excluded from the present study because the cat had been receiving atenolol chronically. A summary of the demographic and clinical data for cats from which tissues for the present study originated is presented in Table 2. Cats in the CKD group were significantly older (P < .001) than control cats. Two CKD cats, aged 3.1 and 4.4 years, were considered young adults according to the American Association of Feline Practitioners/American Animal Hospital Association life stage guidelines, 30 with all others being >9.1 years old. Relative to control cats, cats in the CKD group were also more likely to be neutered (P = .007). Samples from cats with both azotemic and non‐azotemic CKD were evaluated. Complete staging of CKD according to the recommendations of the International Renal Interest Society (IRIS) 31 was not possible in all cats. Urine protein‐to‐creatinine ratios were known for 3 CKD cats, 2 of which were proteinuric. Systolic blood pressure (SBP) measurements were noted in the medical records of 2 cats with CKD, both of which were normotensive. The most recent SBP measurements for each of these cats were 104 and 118 mm Hg, determined using Doppler sphygmomanometry 0 and 4 days before euthanasia, respectively. Both SBP and urine protein‐to‐creatinine ratio were known for only 1 cat with CKD, with disease that was IRIS stage 4 with proteinuric and normotensive sub‐staging.
TABLE 2.
Clinical and laboratory data from cats with chronic kidney disease (n = 11) and from healthy control cats (n = 8)
| Chronic kidney disease group | Healthy control group | P‐value | |
|---|---|---|---|
| Number | 11 | 8 | |
| Age (years) | 17.3 (3.1‐19.4) | 1.7 (1–7) | <.001 |
| Sex | .007 | ||
| Female spayed | 6 | 0 | |
| Female intact | 0 | 3 | |
| Male neutered | 5 | 4 | |
| Male intact | 0 | 1 | |
| Breed | .23 | ||
| Domestic short haired | 7 | 8 | |
| Domestic medium haired | 3 | 0 | |
| Abyssinian | 1 | 0 | |
| Body weight (kg) | 3.65 ± 1.45 | 4.22 ± 0.95 | .35 |
| n | 9 | 8 | |
| Serum creatinine concentration (mg/dL) | 5.4 ± 3.2 | 0.9 ± 0.5 | <.001 |
| Serum urea nitrogen concentration (mg/dL) | 89.0 ± 42.6 | 24.9 ± 5.1 | <.001 |
| Serum symmetric dimethylarginine concentration (μg/dL) | 14.5 (9‐20) | 10.5 (6‐14) | .60 |
| n | 2 | 8 | |
| Urine specific gravity | 1.016 ± 0.003 | 1.051 ± 0.007 | <.001 |
| n | 7 | 8 | |
| Urine protein‐to‐creatinine ratio | 0.70 (0.39‐23.41) | 0.19 (0.07‐0.41) | .02 |
| n | 3 | 8 | |
| Time between collection of samples for laboratory data and renal tissues (d) | 17 (0‐525) | 0 (0‐0) | .001 |
Note: Numerical data are presented as mean ± SD or median (range), where appropriate. Number of cats for which data are available is provided if different from the number of individuals in each group.
For cats with CKD, histologic diagnoses made by 1 of 2 board‐certified veterinary pathologists included typical ischemic CKD (ie, chronic tubular atrophy and tubulorrhexis with interstitial inflammation, lipid, and fibrosis; n = 6), ischemic CKD with oxalosis (n = 2), amyloidosis (n = 1), membranoproliferative glomerulonephritis (n = 1), and possible renal maldevelopment with secondary ischemic changes (n = 1).
3.2. Dietary sodium intake
Information regarding dietary sodium intake was available for 6 of 11 cats in the CKD group and 4 of 8 cats in the healthy control group. All cats in the control group for which diet information was known had been fed a maintenance dry cat food (Purina Cat Chow) containing 165 mg sodium/100 kcal. Of the 6 cats in the CKD group for which diet information was known, 5 cats were being fed a prescription renal diet (Hill's k/d [56 mg sodium/100 kcal] in n = 4 and Royal Canin Feline Renal Support D [90 mg sodium/100 kcal] in n = 1). One CKD cat was being fed a combination of dry and canned forms of a maintenance diet (Purina Pro Plan Focus urinary tract formula [60 and 90 mg sodium/100 kcal for dry and canned forms, respectively]).
3.3. Intrarenal RAS gene transcription
The geometric mean transcript level of AGT was 15.4 (95% CI, 6.3, 37.8) times greater in renal tissue samples from the CKD group compared to those from the control group, whereas the geometric mean transcript level of ACE was 5.3 (95% CI, 2.6, 11.0) times greater in renal tissue samples from the control group compared to those from the CKD group (P < .001; Figure 1). No significant differences were found in renal transcript levels of REN (P = .72) or AGTR1 (P = .51) between groups.
FIGURE 1.
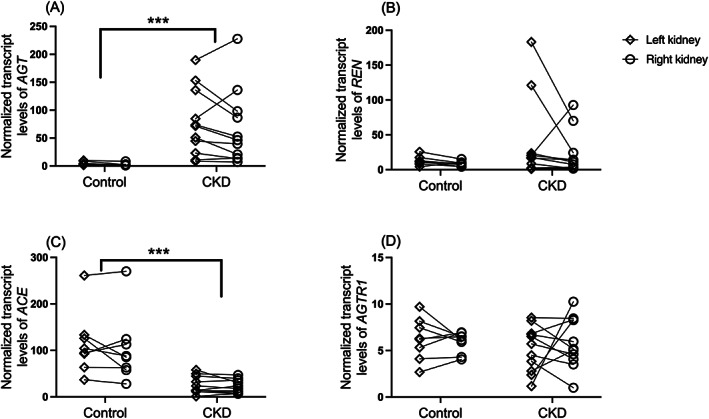
Dot plots of normalized transcript levels of (A) angiotensinogen (AGT), (B) renin (REN), (C) angiotensin‐converting enzyme (ACE), and (D) angiotensin II type 1 receptor (AGTR1) in renal tissue homogenates from cats with naturally occurring chronic kidney disease (CKD; n = 11) and healthy control cats (n = 8). Values from the left kidney (open diamond) and right kidney (open circle) of the same individual are connected by solid lines. Levels of each target gene were normalized to those of the reference genes GAPDH and RPS7. For each gene, transcript levels are scaled to those of the lowest sample; note, therefore, that scales differ among genes. ***P < .001
3.4. Renal angiotensin peptides
The geometric mean concentration of Ang I (Ang 1‐10) was significantly higher in kidneys from the CKD group (1052 fmol/g; 95% CI, 621, 1783) compared to those from the control group (167 fmol/g; 95% CI, 69, 406; P = .001; Figure 2). Although the geometric mean concentration of Ang II (Ang 1‐8) was numerically higher in CKD kidneys (618 fmol/g; 95% CI, 341, 1122) than in control kidneys (319 fmol/g; 95% CI, 155, 656), this difference was not statistically significant (P = .12). No significant difference was found in geometric mean concentration of Ang III (Ang 2‐8) between tissues of the CKD group (69 fmol/g; 95% CI, 39, 121) and those of the control group (112 fmol/g; 95% CI, 56, 226; P = .23). Renal concentrations of Ang IV (Ang 3‐8) were <4 fmol/g for 10 (91%) of the 11 cats with CKD and 5 (63%) of the 8 healthy control cats; these data are not presented graphically. The proportion of cats with Ang IV concentrations below the lower limit of quantification did not differ significantly between groups (P = .26). The range of Ang IV concentrations for kidneys with a value within the reportable interval for the assay were 4.6‐5.0 fmol/g for the kidneys of 1 CKD cat and 5‐8.6 fmol/g for 3 healthy control kidneys.
FIGURE 2.
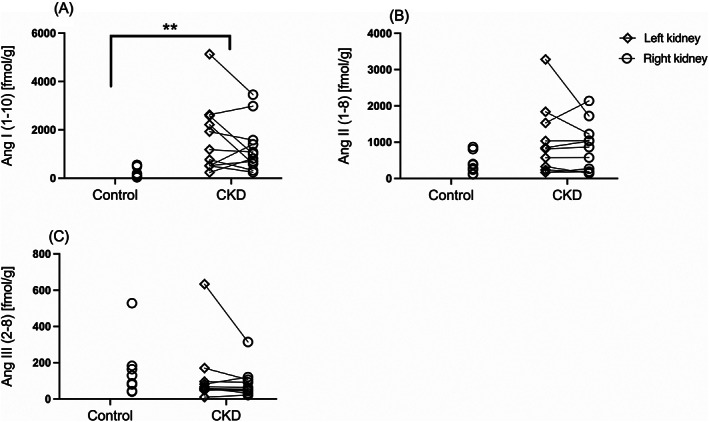
Dot plots of renal concentrations of (A) angiotensin (Ang) I (Ang 1–10), (B) angiotensin II (Ang 1–8), and (C) angiotensin III (Ang 2‐8) in renal tissue homogenates from cats with chronic kidney disease (CKD; n = 11) and control cats (n = 8). For the CKD group cats, values from the left (open diamond) and right kidney (open circle) of the same individual are connected by solid lines. **P < .01
4. DISCUSSION
In our study, kidneys from aged cats with naturally occurring CKD had higher AGT and lower ACE transcript levels, and higher mean Ang I concentrations, than those from healthy, adult cats. Although mean concentration of Ang II was numerically higher in the kidneys of CKD cats compared to those of healthy controls, this difference was not statistically significant. These findings suggest, as in other species, that there may be activation of the intrarenal RAS in cats with naturally occurring CKD.
Inappropriate and deleterious RAAS activation is well documented in CKD in mammals and is a known factor for disease progression. 3 In cats, the systemic RAAS has been shown to be inappropriately activated in some, but not all, CKD models 13 , 14 and in a subset of individuals with naturally occurring disease. 12 , 32 Recently, local, tissue RASs have gained attention as crucial mediators of end‐organ damage. 15 Importantly, these local systems appear to be subject to regulatory mechanisms that are independent of the classical, systemic RAAS. 4 , 16 , 17 , 18 Renal concentrations of Ang II may exceed those explainable by simple equilibration with circulating concentrations, and large regional differences in Ang II concentrations imply local, intrarenal regulation of this peptide. 16 In our study, evaluation of the RAS included quantification of renal transcripts of AGT, REN, ACE, and AGTR1, and measurement of equilibrium concentrations of renal angiotensin peptides. By documenting the presence of mRNA encoding for those RAS components, we confirmed that these molecules can be locally derived.
Angiotensinogen is the only known precursor of the angiotensin peptides and its regulation may be of key importance to the activity of the intrarenal RAS. 33 Circulating AGT is produced constitutively by the liver and is relatively abundant, with renin activity representing the rate‐limiting, major regulatory step of the systemic RAAS. 1 , 34 Conversely, within the kidney, generation of Ang II is controlled by numerous independent mechanisms, of which intrarenal generation of AGT appears to be a critical factor. 18 One important distinction between the systemic and the intrarenal RAS is that stimulation of renal Ang II type 1 receptor by Ang II exerts a positive feedforward loop, in part by increasing transcription of AGT. 16 , 35 Our data suggest, based on the relative abundance of AGT mRNA in diseased as compared to healthy kidneys, that the intrarenal RAS might be activated in cats with CKD.
Our study identified lower ACE mRNA levels in tissues from affected cats as compared to those from healthy individuals. Additionally, although Ang I levels were significantly higher in cats with CKD, Ang II levels were not significantly different between groups. Although this finding could be a reflection of lower relative expression of ACE, work in other species suggests that ACE‐independent pathways of Ang II production predominate in renal tissues. 16 One such pathway relies on the activity of the enzyme chymase, 36 which was not evaluated in our study.
Although the profibrotic and proinflammatory effects of Ang II are primarily mediated by the Ang II type 1 receptor, 5 binding of the Ang II type 2 receptor leads to numerous counterbalancing effects (eg, systemic and renal vasodilatation, decreased renal sodium reabsorption, nitric oxide release, and inhibition of proliferation, growth and fibrosis). 6 , 37 Angiotensin II also is degraded by various enzymes to several smaller, biologically active, angiotensin peptides, including Ang III (Ang 2‐8) and Ang IV (Ang 3‐8), both studied here, as well as others (eg, Ang 1‐9, Ang 1‐7, Ang 1‐5) not evaluated in our study. 38 Like Ang II, Ang III can stimulate both Ang II type 1 and type 2 receptors, 37 but has higher selectivity for the Ang II type 2 receptor than does Ang II. 39 Angiotensin IV may be generated from Ang II or III and interacts with the Ang II type 4 receptor, which has functions associated with cognition (eg, memory acquisition and recall), regulation of blood flow, inhibition of renal tubular sodium reabsorption, and cardiac hypertrophy. 2 We were unable to identify differences in transcript abundance of Ang II type I receptor or concentrations of Ang III and Ang IV between tissues from cats with CKD and those from healthy cats.
Cats in the CKD group were significantly older and more likely to be sexually altered than those in the control group. In human beings, there exist both sex and age differences in the expression levels of RAS components, 40 , 41 , 42 , 43 with young children having higher supine PRA and plasma aldosterone concentrations than adolescents. 43 , 44 Similarly, a veterinary study documented an association between aging and a decrease in PRA in healthy cats. 45 In human beings, differences in circulating, urinary or both renin and aldosterone concentrations among men, pre‐ and post‐menopausal women, and women receiving estrogen replacement, have been documented in multiple studies, 46 , 47 , 48 although evidence occasionally is conflicting with regard to the directionality of the observed disparities. 41 In cats, neutering has been associated with lower PRA, but no change in plasma aldosterone concentration. 45 Significant differences in age and neuter status between the groups in our study represent potential competing factors that may have influenced our results.
Because the RAAS plays a key role in the regulation of fluid and electrolyte balance, its activity is necessarily influenced by dietary sodium intake. In health, an inverse relationship exists between sodium intake and circulating RAAS activity, but this relationship can be disrupted in certain individuals and specific disease states. 49 , 50 In healthy dogs, progressive increases in sodium intake have been associated with decreases in PRA, and plasma Ang II and aldosterone concentrations. 51 In another study, supplementation of dietary sodium chloride led to decreased aldosterone concentrations in cats with induced renal insufficiency, but not in healthy control cats. 52 Interestingly, although feeding diets rich in sodium tends to suppress circulating markers of RAAS, high sodium intake appears to induce intrarenal RAS activation in some rodent models. 53 , 54 Diet information was available for approximately half of the cats in our study. Of these, all CKD cats were fed a relatively sodium‐restricted diet, whereas control cats were fed a high‐sodium diet. How dietary sodium intake differentially impacts the systemic and intrarenal RAS in cats is presently unknown. However, it is plausible that differences in sodium intake between groups might have impacted our results.
Our study had some limitations. First, a relatively small number of banked samples was available for analysis. This, along with a high degree of inter‐individual variability, likely limited our power to detect differences between groups. In addition, expressions of renin, AGT, ACE, and the Ang II type 1 receptor were evaluated at the transcriptional level only—concentrations of the corresponding proteins may differ from those of the mRNA transcripts. For financial reasons, equilibrium analyses of angiotensin peptides from only 1 kidney in the control group was possible, which might have further increased the likelihood of type II error. Furthermore, concurrent evaluation of the systemic RAAS was not performed, leaving an important gap in the assessment of this system. Other limitations include lack of complete information regarding systemic arterial BP and dietary sodium intake, which may have impacted our observations if systematic differences existed between groups. Future studies may include the evaluation of a larger number of individuals for which SBP and dietary data are known. For financial reasons, we did not assess components of the so‐called alternative angiotensin peptide pathways (eg, ACE 2, Ang 1‐9, Ang 1‐7, Ang 1‐5), or ACE‐independent pathways of Ang II production, which could have benefited the interpretation of our data. Finally, because homogenized tissues were used, assessment of regional differences in the expression of the evaluated intrarenal RAS components was not possible.
Presently, assessment of the intrarenal RAS in cats is expensive and requires renal tissue sampling, limiting its usefulness in clinical cases. Studies in humans suggest that urinary AGT is a suitable biomarker of intrarenal Ang II and is associated with increased risk of progressive renal dysfunction in patients with CKD. 55 , 56 Evaluation of urinary AGT as an antemortem, non‐invasive marker of intrarenal RAS activation in cats warrants further investigation.
In conclusion, our data suggest that the intrarenal RAS might be stimulated in cats with naturally occurring CKD. Future efforts to identify biomarkers reflecting the status of the intrarenal RAS are crucial for in vivo research in cats.
CONFLICT OF INTEREST DECLARATION
Dr. Bianca Lourenço was the recipient of a Boehringer Ingelheim Postdoctoral Scholarship. No other authors have a conflict of interest.
OFF‐LABEL ANTIMICROBIAL DECLARATION
Authors declare no off‐label use of antimicrobials.
INSTITUTIONAL ANIMAL CARE AND USE COMMITTEE (IACUC) OR OTHER APPROVAL DECLARATION
This study was performed using banked samples. All activities related to the original study for which samples were obtained were approved by the University of Georgia IACUC (Animal Use Protocol A2017 05‐008‐Y3‐A1).
HUMAN ETHICS APPROVAL DECLARATION
Authors declare human ethics approval was not needed for this study.
ACKNOWLEDGMENT
This study was partially funded by a grant from the Department of Small Animal Medicine and Surgery, University of Georgia College of Veterinary Medicine. The authors gratefully acknowledge families that donated tissue samples, as well as colleagues who helped with case recruitment. The authors also thank Daven Khana for assistance with molecular experiments.
Lourenço BN, Coleman AE, Berghaus RD, Tarigo JL, Schmiedt CW, Brown SA. Characterization of the intrarenal renin‐angiotensin system in cats with naturally occurring chronic kidney disease. J Vet Intern Med. 2022;36(2):647‐655. doi: 10.1111/jvim.16361
Funding informationThis study was partially funded by a grant from the Department of Small Animal Medicine and Surgery, University of Georgia College of Veterinary Medicine.
Funding information Department of Small Animal Medicine and Surgery, University of Georgia College of Veterinary Medicine
REFERENCES
- 1. Peach MJ. Renin‐angiotensin system: biochemistry and mechanisms of action. Physiol Rev. 1977;57:313‐370. [DOI] [PubMed] [Google Scholar]
- 2. De Gasparo M, Catt K, Inagami T, et al. International union of pharmacology. XXIII. The angiotensin II receptors. Pharmacol Rev. 2000;52:415‐472. [PubMed] [Google Scholar]
- 3. Brewster UC, Perazella MA. The renin‐angiotensin‐aldosterone system and the kidney: effects on kidney disease. Am J Med. 2004;116:263‐272. [DOI] [PubMed] [Google Scholar]
- 4. Zhuo JL, Li XC. New insights and perspectives on intrarenal renin‐angiotensin system: focus on intracrine/intracellular angiotensin II. Peptides. 2011;32:1551‐1565. [DOI] [PMC free article] [PubMed] [Google Scholar]
- 5. Ruster C, Wolf G. Angiotensin II as a morphogenic cytokine stimulating renal fibrogenesis. J Am Soc Nephrol. 2011;22:1189‐1199. [DOI] [PubMed] [Google Scholar]
- 6. Brewster UC, Setaro JF, Perazella MA. The renin‐angiotensin‐aldosterone system: cardiorenal effects and implications for renal and cardiovascular disease states. Am J Med Sci. 2003;326:15‐24. [DOI] [PubMed] [Google Scholar]
- 7. Rüster C, Wolf G. Renin‐angiotensin‐aldosterone system and progression of renal disease. J Am Soc Nephrol. 2006;17:2985‐2991. [DOI] [PubMed] [Google Scholar]
- 8. Wolf G, Butzmann U, Wenzel UO. The renin‐angiotensin system and progression of renal disease: from hemodynamics to cell biology. Nephron Physiol. 2003;93:p3‐p13. [DOI] [PubMed] [Google Scholar]
- 9. Xie X, Liu Y, Perkovic V, et al. Renin‐angiotensin system inhibitors and kidney and cardiovascular outcomes in patients with CKD: a Bayesian network meta‐analysis of randomized clinical trials. Am J Kidney Dis. 2016;67:728‐741. [DOI] [PubMed] [Google Scholar]
- 10. Jensen J, Henik R, Brownfield M, Armstrong J. Plasma renin activity and angiotensin I and aldosterone concentrations in cats with hypertension associated with chronic renal disease. Am J Vet Res. 1997;58:535‐540. [PubMed] [Google Scholar]
- 11. Steele JL, Henik RA, Stepien RL. Effects of angiotensin‐converting enzyme inhibition on plasma aldosterone concentration, plasma renin activity, and blood pressure in spontaneously hypertensive cats with chronic renal disease. Vet Ther. 2002;3(2):157‐166. [PubMed] [Google Scholar]
- 12. Jepson R, Syme H, Elliott J. Plasma renin activity and aldosterone concentrations in hypertensive cats with and without azotemia and in response to treatment with amlodipine besylate. J Vet Intern Med. 2014;28:144‐153. [DOI] [PMC free article] [PubMed] [Google Scholar]
- 13. Mathur S, Brown CA, Dietrich UM, et al. Evaluation of a technique of inducing hypertensive renal insufficiency in cats. Am J Vet Res. 2004;65:1006‐1013. [DOI] [PubMed] [Google Scholar]
- 14. Watanabe T, Mishina M. Effects of benazepril hydrochloride in cats with experimentally induced or spontaneously occurring chronic renal failure. J Vet Med Sci. 2007;69:1015‐1023. [DOI] [PubMed] [Google Scholar]
- 15. Paul M, Poyan Mehr A, Kreutz R. Physiology of local renin‐angiotensin systems. Physiol Rev. 2006;86:747‐803. [DOI] [PubMed] [Google Scholar]
- 16. Kobori H, Nangaku M, Navar LG, Nishiyama A. The intrarenal renin‐angiotensin system: from physiology to the pathobiology of hypertension and kidney disease. Pharmacol Rev. 2007;59:251‐287. [DOI] [PubMed] [Google Scholar]
- 17. Rohrwasser A, Morgan T, Dillon HF, et al. Elements of a paracrine tubular renin‐angiotensin system along the entire nephron. Hypertension. 1999;34:1265‐1274. [DOI] [PubMed] [Google Scholar]
- 18. Nishiyama A, Kobori H. Independent regulation of renin‐angiotensin‐aldosterone system in the kidney. Clin Exp Nephrol. 2018;22:1231‐1239. [DOI] [PMC free article] [PubMed] [Google Scholar]
- 19. Kobori H, Prieto‐Carrasquero MC, Ozawa Y, Navar LG. AT1 receptor mediated augmentation of intrarenal angiotensinogen in angiotensin II‐dependent hypertension. Hypertension. 2004;43:1126‐1132. [DOI] [PMC free article] [PubMed] [Google Scholar]
- 20. Prieto‐Carrasquero MC, Harrison‐Bernard LM, Kobori H, et al. Enhancement of collecting duct renin in angiotensin II–dependent hypertensive rats. Hypertension. 2004;44:223‐229. [DOI] [PMC free article] [PubMed] [Google Scholar]
- 21. Mitani S, Yabuki A, Taniguchi K, et al. Association between the intrarenal renin‐angiotensin system and renal injury in chronic kidney disease of dogs and cats. J Vet Med Sci. 2013;75:127‐133. [DOI] [PubMed] [Google Scholar]
- 22. Lourenço BN, Coleman AE, Schmiedt CW, et al. Profibrotic gene transcription in renal tissues from cats with ischemia‐induced chronic kidney disease. Am J Vet Res. 2020;81:180‐189. [DOI] [PubMed] [Google Scholar]
- 23. Riedel J, Badewien‐Rentzsch B, Kohn B, Hoeke L, Einspanier R. Characterization of key genes of the renin‐angiotensin system in mature feline adipocytes and during in vitro adipogenesis. J Anim Physiol Anim Nutr. 2016;100:1139‐1148. [DOI] [PubMed] [Google Scholar]
- 24. Kessler Y, Helfer‐Hungerbuehler AK, Cattori V, et al. Quantitative TaqMan® real‐time PCR assays for gene expression normalisation in feline tissues. BMC Mol Biol. 2009;10:106. [DOI] [PMC free article] [PubMed] [Google Scholar]
- 25. Owczarzy R, Tataurov AV, Wu Y, et al. IDT SciTools: a suite for analysis and design of nucleic acid oligomers. Nucleic Acids Res. 2008;36:W163‐W169. [DOI] [PMC free article] [PubMed] [Google Scholar]
- 26. Bustin SA, Benes V, Garson JA, et al. The MIQE guidelines: minimum information for publication of quantitative real‐time PCR experiments. Clin Chem. 2009;55:611‐622. [DOI] [PubMed] [Google Scholar]
- 27. Vandesompele J, De Preter K, Pattyn F, et al. Accurate normalization of real‐time quantitative RT‐PCR data by geometric averaging of multiple internal control genes. Genome Biol. 2002;3:Research0034. [DOI] [PMC free article] [PubMed] [Google Scholar]
- 28. Ye J, Coulouris G, Zaretskaya I, Cutcutache I, Rozen S, Madden TL. Primer‐BLAST: a tool to design target‐specific primers for polymerase chain reaction. BMC Bioinf. 2012;13:134. [DOI] [PMC free article] [PubMed] [Google Scholar]
- 29. van Rooyen JM, Poglitsch M, Huisman HW, et al. Quantification of systemic renin‐angiotensin system peptides of hypertensive black and white African men established from the RAS‐fingerprint(R). J Renin Angiotensin Aldosterone Syst. 2016;17:147032031666988. [DOI] [PMC free article] [PubMed] [Google Scholar]
- 30. Quimby J, Gowland S, Carney HC, DePorter T, Plummer P, Westropp J. 2021 AAHA/AAFP feline life stage guidelines. J Am Anim Hosp Assoc. 2021;57:51‐72. [Google Scholar]
- 31. IRIS . IRIS Staging of CKD (modified 2019), 2019.
- 32. Mishina M, Watanabe T, Fujii K, et al. Non‐invasive blood pressure measurements in cats: clinical significance of hypertension associated with chronic renal failure. J Vet Med Sci. 1998;60:805‐808. [DOI] [PubMed] [Google Scholar]
- 33. Carey RM. The intrarenal renin‐angiotensin system in hypertension. Adv Chronic Kidney Dis. 2015;22:204‐210. [DOI] [PubMed] [Google Scholar]
- 34. Montani J‐P, Van Vliet B. General physiology and pathophysiology of the renin‐angiotensin system. Angiotensin. Vol I. Berlin, Germany: Springer; 2004:3‐29. [Google Scholar]
- 35. Sadjadi J, Kramer GL, Yu C‐h, et al. Angiotensin II exerts positive feedback on the intrarenal renin‐angiotensin system by an angiotensin converting enzyme‐dependent mechanism. J Surg Res. 2005;129:272‐277. [DOI] [PubMed] [Google Scholar]
- 36. Park S, Bivona BJ, Kobori H, et al. Major role for ACE‐independent intrarenal ANG II formation in type II diabetes. Am J Physiol Renal Physiol. 2010;298:F37‐F48. [DOI] [PMC free article] [PubMed] [Google Scholar]
- 37. Fyhrquist F, Saijonmaa O. Renin‐angiotensin system revisited. J Intern Med. 2008;264:224‐236. [DOI] [PMC free article] [PubMed] [Google Scholar]
- 38. Carey RM, Siragy HM. Newly recognized components of the renin‐angiotensin system: potential roles in cardiovascular and renal regulation. Endocr Rev. 2003;24:261‐271. [DOI] [PubMed] [Google Scholar]
- 39. Bosnyak S, Jones Emma S, Christopoulos A, et al. Relative affinity of angiotensin peptides and novel ligands at AT1 and AT2 receptors. Clin Sci. 2011;121:297‐303. [DOI] [PubMed] [Google Scholar]
- 40. Fischer M, Baessler A, Schunkert H. Renin angiotensin system and gender differences in the cardiovascular system. Cardiovasc Res. 2002;53:672‐677. [DOI] [PubMed] [Google Scholar]
- 41. Komukai K, Mochizuki S, Yoshimura M. Gender and the renin–angiotensin–aldosterone system. Fundam Clin Pharmacol. 2010;24:687‐698. [DOI] [PubMed] [Google Scholar]
- 42. Hilliard LM, Sampson AK, Brown RD, Denton KM. The “his and hers” of the renin‐angiotensin system. Curr Hypertens Rep. 2013;15:71‐79. [DOI] [PubMed] [Google Scholar]
- 43. Dillon M, Ryness JM. Plasma renin activity and aldosterone concentration in children. Br Med J. 1975;4:316‐319. [DOI] [PMC free article] [PubMed] [Google Scholar]
- 44. Van Acker KJ, Scharpe SL, Deprettere AJ, et al. Renin‐angiotensin‐aldosterone system in the healthy infant and child. Kidney Int. 1979;16:196‐203. [DOI] [PubMed] [Google Scholar]
- 45. Javadi S, Slingerland LI, van de Beek MG, et al. Plasma renin activity and plasma concentrations of aldosterone, cortisol, adrenocorticotropic hormone, and α‐melanocyte‐ stimulating hormone in healthy cats. J Vet Intern Med. 2004;18:625‐631. [DOI] [PubMed] [Google Scholar]
- 46. Pringle KG, Sykes SD, Lumbers ER. Circulating and intrarenal renin‐angiotensin systems in healthy men and nonpregnant women. Physiol Rep. 2015;3:e12586. [DOI] [PMC free article] [PubMed] [Google Scholar]
- 47. Schunkert H, Danser AJ, Hense H‐W, et al. Effects of estrogen replacement therapy on the renin‐angiotensin system in postmenopausal women. Circulation. 1997;95:39‐45. [DOI] [PubMed] [Google Scholar]
- 48. Danser AH, Derkx FH, Schalekamp MA, et al. Determinants of interindividual variation of renin and prorenin concentrations: evidence for a sexual dimorphism of (pro)renin levels in humans. J Hypertens. 1998;16:853‐862. [DOI] [PubMed] [Google Scholar]
- 49. Drenjančević‐Perić I, Jelaković B, Lombard JH, Kunert MP, Kibel A, Gros M. High‐salt diet and hypertension: focus on the renin‐angiotensin system. Kidney Blood Press Res. 2011;34:1‐11. [DOI] [PMC free article] [PubMed] [Google Scholar]
- 50. Kopkan L, Cervenka L. Renal interactions of renin‐angiotensin system, nitric oxide and superoxide anion: implications in the pathophysiology of salt‐sensitivity and hypertension. Physiol Res. 2009;58(Suppl 2):S55‐S67. [DOI] [PubMed] [Google Scholar]
- 51. Kjolby MJ, Kompanowska‐Jezierska E, Wamberg S, Bie P. Effects of sodium intake on plasma potassium and renin angiotensin aldosterone system in conscious dogs. Acta Physiol Scand. 2005;184:225‐234. [DOI] [PubMed] [Google Scholar]
- 52. Buranakarl C, Mathur S, Brown SA. Effects of dietary sodium chloride intake on renal function and blood pressure in cats with normal and reduced renal function. Am J Vet Res. 2004;65:620‐627. [DOI] [PubMed] [Google Scholar]
- 53. Kobori H, Nishiyama A, Abe Y, Navar LG. Enhancement of intrarenal angiotensinogen in dahl salt‐sensitive rats on high salt diet. Hypertension. 2003;41:592‐597. [DOI] [PMC free article] [PubMed] [Google Scholar]
- 54. Cao W, Li A, Wang L, et al. A salt‐induced reno‐cerebral reflex activates renin‐angiotensin systems and promotes CKD progression. J Am Soc Nephrol. 2015;26:1619‐1633. [DOI] [PMC free article] [PubMed] [Google Scholar]
- 55. Yamamoto T, Nakagawa T, Suzuki H, et al. Urinary angiotensinogen as a marker of intrarenal angiotensin II activity associated with deterioration of renal function in patients with chronic kidney disease. J Am Soc Nephrol. 2007;18:1558‐1565. [DOI] [PubMed] [Google Scholar]
- 56. Nishiyama A, Konishi Y, Ohashi N, et al. Urinary angiotensinogen reflects the activity of intrarenal renin–angiotensin system in patients with IgA nephropathy. Nephrol Dial Transpl. 2010;26:170‐177. [DOI] [PMC free article] [PubMed] [Google Scholar]