Abstract
Background
Comparison of clinical findings, chest radiographs (CXR), lung ultrasound (LUS) findings, and C‐reactive protein (CRP) concentrations at admission and serial follow‐up in dogs with aspiration pneumonia (AP) is lacking.
Hypothesis
Lung ultrasound lesions in dogs with AP are similar to those described in humans with community‐acquired pneumonia (comAP); the severity of CXR and LUS lesions are similar; normalization of CRP concentration precedes resolution of imaging abnormalities and more closely reflects the clinical improvement of dogs.
Animals
Seventeen dogs with AP.
Methods
Prospective observational study. Clinical examination, CXR, LUS, and CRP measurements performed at admission (n = 17), 2 weeks (n = 13), and 1 month after diagnosis (n = 6). All dogs received antimicrobial therapy. Lung ultrasound and CXR canine aspiration scoring systems used to compare abnormalities.
Results
B‐lines and shred signs with or without bronchograms were identified on LUS in 14 of 17 and 16 of 17, at admission. Chest radiographs and LUS scores differed significantly using both canine AP scoring systems at each time point (18 regions per dog, P < .001). Clinical and CRP normalization occurred in all dogs during follow up. Shred signs disappeared on LUS in all but 1 of 6 dogs at 1 month follow‐up, while B‐lines and CXR abnormalities persisted in 4 of 6 and all dogs, respectively.
Conclusion and Clinical Importance
Lung ultrasound findings resemble those of humans with comAP and differ from CXR findings. Shred signs and high CRP concentrations better reflect clinical findings during serial evaluation of dogs.
Keywords: acute phase proteins, canine aspiration pneumonia score, community‐acquired pneumonia, point of care ultrasound, simplified canine aspiration pneumonia score
ABBREVIATIONS
- AP
aspiration pneumonia
- APP
acute phase protein
- CAPS
canine aspiration pneumonia score
- ComAP
community‐acquired pneumonia
- CRP
C‐reactive protein
- CXR
chest radiographs
- LUS
lung ultrasound
- sCAPS
simplified canine aspiration pneumonia score
1. INTRODUCTION
Aspiration pneumonia (AP) is defined as a bacterial pulmonary infection secondary to the aspiration of foreign contents. 1 , 2 Diagnosis is based on history of vomiting or regurgitation, clinical signs of fever and tachypnea, and chest radiographs (CXR). 1 , 2 , 3 , 4 , 5 Differentiating AP from sterile pneumonitis requires collection of lower airway samples for cytology and culture, which in practice is rarely performed because of cost and complications associated with these procedures. 1 , 6 In humans, community‐acquired pneumonia (comAP) encompasses all pneumonias acquired outside the hospital setting, in contrast to ventilator and hospital‐acquired pneumonias. Similar to ComAP, AP in dogs is often associated with bacteria susceptible to first‐line antimicrobials. 1 , 7
Community‐acquired pneumonia is typically treated with a 7 to 10‐day course of antimicrobials, with discontinuation based on clinical improvement 8 , 9 and acute phase protein (APP) kinetics, which is considered safe and shortens treatment duration. 10 , 11 , 12 , 13 As clinical improvement precedes resolution of lesions on CXR, radiographs are no longer recommended in humans with pneumonia. 14 , 15 In contrast, research is lacking with regards to the optimal duration of antimicrobial therapy and the role for CXR in dogs with AP. Current opinion‐based recommendations advise treating bacterial pneumonia with 3 to 6 weeks of antimicrobials. 1 , 7 Chest radiographs are recommended 10 to 14 days after diagnosis, 7 although studies describing the evolution of CXR during recovery are limited. 16 Studies in veterinary medicine demonstrate that C‐reactive protein (CRP) is a reliable APP to monitor treatment response in bacterial pneumonia in dogs. 17 , 18
The use of lung ultrasound (LUS) as a diagnostic and monitoring tool in humans has increased over the past decade. 19 , 20 , 21 , 22 , 23 , 24 , 25 , 26 , 27 , 28 It has comparable sensitivity and specificity to CXR for the diagnosis of pneumonia in humans. 19 Lung ultrasound identification of lung consolidations, characterized by a tissue sign (entire width of the lung lobe affected) or a shred sign (partial width of the lung lobe affected), increased numbers of B‐Lines, and pleural effusion is described. Humans with comAP have air and fluid bonchograms identified in 50% to 97% and 0% to 31% of cases, respectively. 13 , 20 , 21 , 29 , 30
Point‐of‐care LUS has been described in veterinary medicine for identification of congestive heart failure, pulmonary hemorrhage, and other causes of alveolar‐interstitial syndrome. 31 , 32 , 33 , 34 , 35 , 36 , 37 , 38 , 39 , 40 , 41 Lung ultrasound findings in dogs presenting with AP have been described in a small cohort of dogs. 36 It is currently unknown if serial LUS evaluation is beneficial in the management of dogs with AP.
The purpose of this study was to describe LUS lesions in dogs with AP and to compare serial LUS evaluation to other current diagnostics (CXR and CRP).
Our hypotheses were that LUS lesions in dogs with AP are similar to those described in humans with comAP; the severity of CXR and LUS lesions are similar and normalization of CRP concentration precedes resolution of imaging abnormalities on serial evaluation and better reflects the recovery process.
2. MATERIALS AND METHODS
2.1. Study cohort
Owner consent and ethics approval from the University of Liège were obtained for this prospective longitudinal observational study (January to December 2019). Dogs with a presumptive diagnosis of AP based on history (eg, vomiting, regurgitation, laryngeal dysfunction, recent anesthesia, or neurological signs), clinical findings (eg, cough, fever, anorexia, or increased respiratory rate), CXR findings (interstitial or alveolar lung lesions), and increased serum CRP concentrations were enrolled. Dogs diagnosed with AP within the previous 30 days, having received antibiotics for more than 5 days before admission, or having suspected concomitant lung disease, were excluded.
Clinical examination, 3‐view CXR, LUS, and CRP measurements were performed after stabilization and within 60 minutes of each other at 3 time points: admission (T0), 2 weeks after diagnosis (T1), and 1 month after diagnosis (T2). CXR were reviewed and scored by a board‐certified radiologist blinded to LUS findings and time point. A LUS‐trained internal medicine resident, blinded to CXR findings, performed LUS using a portable ultrasound machine using a modification of a previously described protocol, where 3‐second video cineloops were recorded at 3 intercostal spaces (4th, 6th, and 8th) in the dorsal, middle, and ventral thirds of the thorax (9 regions in total per hemithorax). 37 A modification of this technique was used in the ventral thoracic regions. 38 This involves keeping the probe parallel to the ribs and sliding it ventrally and dorsally between the sternal muscles and ventral lung regions within each intercostal space. Abnormalities recorded at each region are described in Table 1. Lung ultrasound lesions were compared to CXR findings after dividing lateral radiographs into 9 regions (Figure 1), grossly corresponding to the recorded LUS regions. Lung ultrasound and CXR findings were compared using a canine aspiration pneumonia score for LUS (LUS‐CAPS) and CXR (CXR‐CAPS), and a simplified canine aspiration pneumonia score for LUS (LUS‐sCAPS) and CXR (CXR‐sCAPS; Table 2 and Table 3). The CXR scoring systems were based on a CXR AP classification previously described 4 while the LUS scoring systems were arbitrarily created by the authors.
TABLE 1.
Lung ultrasound abnormalities as defined in humans with comAP
| Lesion severity | LUS abnormalities | Definition | |
|---|---|---|---|
| Mild | 1 to 3 B‐lines | 1 to 3 hyperechoic laser like lines arising from the pleural line and moving with lung sliding 24 | |
| >3 B‐lines | More than 3 B‐lined, as described above 24 | ||
| Coalescent B‐lines | B‐lines forming a “white curtain” 42 | ||
| Severe | Pleural effusion | Homogenous, anechoic fluid between the visceral and parietal pleura 42 | |
| Lung consolidation | Shred sign | Non translobar lung consolidation with an irregular shape and blurred margins between aerated and consolidated lung 24 | |
| Tissue sign | Translobar lung consolidation 29 | ||
| Air bronchogram | Dynamic echoic branches or spots that fluctuate with the respiratory cycle 42 | ||
| Fluid bronchogram | Tubular anechoic structure filled with fluid 42 | ||
Abbreviations: comAP, community‐acquired pneumonia; LUS, lung ultrasound.
FIGURE 1.
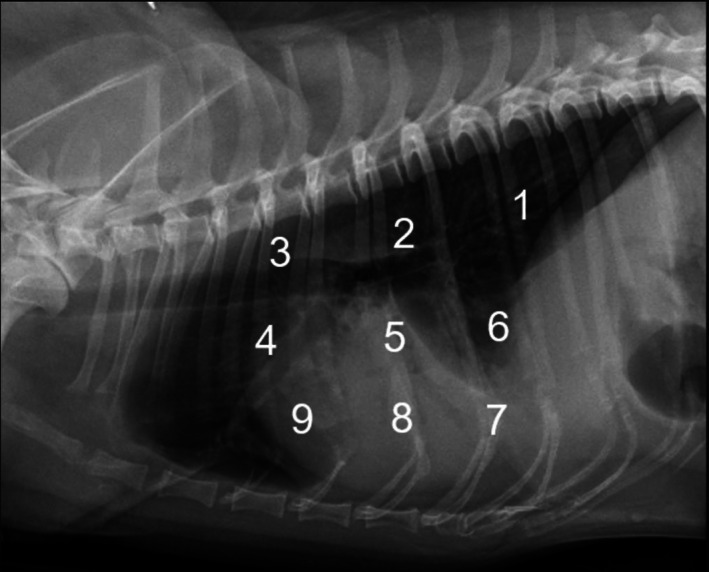
Division of a lateral CXR into 9 regions grossly corresponding to the recorded LUS regions
TABLE 2.
Classification of CXR lesions according to the CXR‐sCAPS and CXR‐CAPS applied to each CXR regions (9 regions per hemithorax; 18 regions per dog)
| sCAPS |
0 No lesions |
1 | 2 | ||||
| Interstitial pattern | Alveolar pattern | ||||||
| CAPS | 1 | 2 | 3 | 4 | 5 | 6 | |
| Mild | Moderate | Severe | Mild | Moderate | Severe | ||
Abbreviations: CAPS, canine aspiration pneumonia score; CXR, chest radiographs; sCAPS, simplified canine aspiration pneumonia score.
TABLE 3.
Classification of LUS lesions according to the LUS‐sCAPS and LUS‐CAPS applied to each LUS regions (9 regions per hemithorax; 18 regions per dog)
| sCAPS |
0 No lesions |
1 | 2 | ||||
| Mild | Severe | ||||||
| CAPS | 1 | 2 | 3 | 4 | 5 | 6 | |
| 1–3 B‐lines | >3 B‐lines | Coalescent B‐lines | Shred sign | Shred sign with air bronchogram, fluid bronchogram, or both | Tissue sign | ||
Abbreviations: CAPS, canine aspiration pneumonia score; LUS, lung ultrasound; sCAPS, simplified canine aspiration pneumonia score.
Serum CRP concentrations were measured via a particle‐enhanced turbidimetric immunoassay, previously validated in dogs, 43 with an upper reference range of 9 mg/L. Samples were analyzed within 24 hours or preserved at −80°C until analysis.
Dogs were hospitalized and medically managed at the discretion of the attending clinician. Amoxicillin clavulanic acid (approximately 22 mg/kg q12h) was administered to all dogs for 4 to 6 weeks according to current recommended guidelines. 6 Clinical findings compatible with AP included client observations and physical examination findings. Resolution of AP was defined as the absence of owner observed clinical signs for at least 2 days before the visit (eg, cough, increased respiratory rate or respiratory distress, anorexia, lethargy) and an unremarkable physical examination (eg, normal temperature, no crackles or increased lung sounds on auscultation).
2.2. Statistical analysis
For each time point (T0, T1, T2), overall median CAPS and sCAPS were calculated across all regions (n = 18 per dog) for all dogs with data available at that time point. Data for each imaging modality and each scoring system (LUS‐CAPS, LUS‐sCAPS, CXR‐CAPS, and CXR‐sCAPS) at each time point were reported as overall median and interquartile range (IQR). For dogs with data available at T1, scores for each imaging modality and CRP were compared between T0 and T1 using Wilcoxon signed‐rank tests. For dogs with data available at T1 and T2, scores for each imaging modality and CRP were compared between T0, T1, and T2 using Friedman tests with post‐hoc Nemenyi's for multiple comparisons. Finally, within each time point (T0, T1, T2), results were compared between LUS‐CAPS and CXR‐CAPS and between LUS‐sCAPS and CXR‐sCAPS using Wilcoxon signed‐rank tests. For all statistical tests, a value of P < .05 was considered significant.
3. RESULTS
3.1. Study cohort
Seventeen dogs of various breeds were included. Mean age at T0 was 5.4 years (range, 4 months‐12 years). Nine dogs were female (4 neutered) and 8 were male (6 neutered). Median body weight was 10 kg (range, 3.7‐70.4). Ten of the 17 dogs had a recent history of acute vomiting, 4 had a history of regurgitation, 2 presented with seizures, and 1 underwent general anesthesia before the diagnosis of AP. Lethargy was observed by the owners in all cases, anorexia occurred in 14 dogs, an increased respiratory rate was observed in 10 dogs and 2 dogs started coughing shortly after vomiting. Follow‐up information was available for 13 dogs at T1 and 6 dogs at T2.
3.2. Physical examination findings
Physical examination findings at T0 are listed in Table 4. All dogs had at least 1 abnormal physical examination finding at T0. A productive cough was also observed in 4 dogs. At T1 and T2, all dogs had complete resolution of clinical findings associated with AP, which included both clinical signs and physical examination findings.
TABLE 4.
Physical examination findings at admission
| Physical examination findings | Number of dogs (n = 17) | |
|---|---|---|
| Respiratory pattern | Restrictive | 12 |
| Tachypnea | 2 | |
| Increased inspiratory effort | 3 | |
| Breathing sounds | Stertor | 2 |
| Normal | 11 | |
| Auscultation sounds | Crackles | 7 |
| Increased sounds | 8 | |
| Normal | 2 | |
| Temperature | Increased | 12 (Mean 40°C) |
| Normal | 5 | |
3.3. Radiographic findings
At T0, all dogs had a localized alveolar pattern on CXR (unilateral in 10, bilateral in 7). Figure 2 shows the CXR‐CAPS results over all lung regions as a percentage of abnormalities identified at T0 (17 dogs included with 18 regions evaluated per dog, making up a total of 306 regions), T1 (n = 13, 234 regions) and T2 (n = 6, 108 regions) in all dogs. Similar information for CXR‐sCAPS is presented in Figure 3, showing that alveolar patterns became less frequent, while an interstitial pattern was increasingly observed during follow‐up.
FIGURE 2.
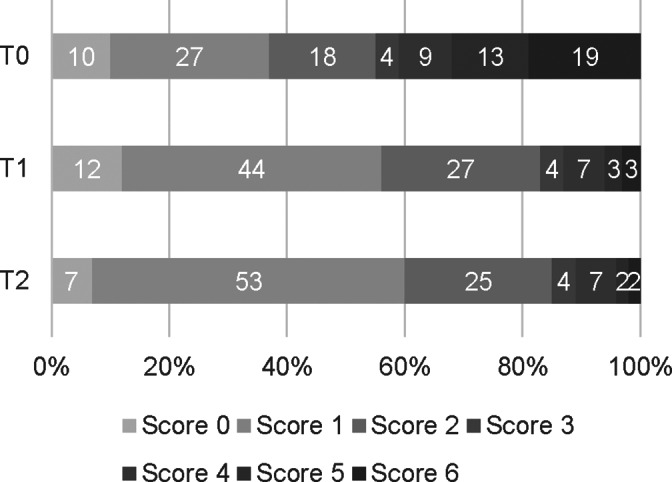
Chest radiographs scores according to the CXR‐CAPS, as described in Table 2, at each time point. Percentage of regions with different CXR scores according to the CXR‐CAPS at admission (T0, n = 17, 306 regions), 2 weeks (T1, n = 13, 234 regions), and 1 month (T2, n = 6, 108 regions) after diagnosis
FIGURE 3.
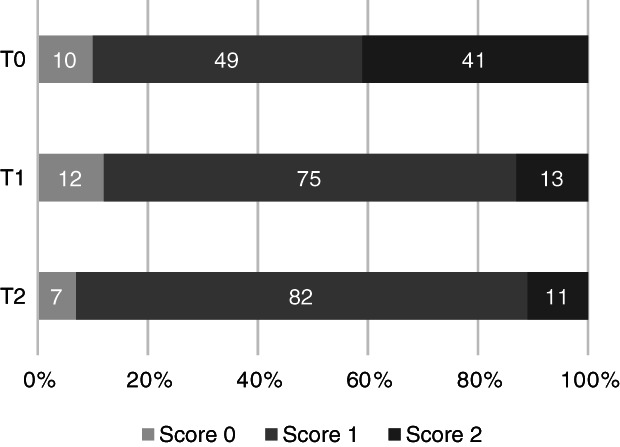
Percentage of regions classified as showing no lesions (score 0), an interstitial pattern (score 1), or an alveolar pattern (score 2) according to the CXR‐sCAPS at admission (T0) (n = 17, 306 regions), 2 weeks after diagnosis (T1) (n = 13, 234 regions), and 1 month after diagnosis (T2) (n = 6, 108 regions)
In the 13 dogs with follow‐up available at T1, CXR‐CAPS were significantly different between time points T0 and T1 (T0: 2 [1‐5]; T1: 1 [1, 2]; P < .001). CXR‐sCAPS in these 13 dogs were also significantly different between T0 and T1 (n = 13, T0: 1 [1, 2]; T1: 0 [0‐1]; P < .0001). Regarding the 6 dogs with follow‐up available at T2, CXR‐CAPS scores were significantly different at T0 (2 [1‐5]) compared to T1(2 [1‐3]; P = .002) and T2 (1 [1, 2]; P < .0001), but not between T1 and T2 (P = .26). Chest radiographs‐sCAPS scores in these 6 dogs were significantly different at T0 (1 [1, 2]) compared to T2 (1 [1]; P = .02), but not between any other time point (P = .26 between T0 and T1, P = .48 between T1 and T2).
3.4. Lung ultrasound findings
Figure 4 shows the percentage of regions with different LUS patterns according to the LUS‐CAPS at T0 (n = 17, 306 regions), T1 (n = 13, 234 regions), and T2 (n = 6, 108 regions) in all dogs. Figure 5 shows the LUS‐sCAPS results over all lung regions as a percentage of abnormalities identified at all time points.
FIGURE 4.
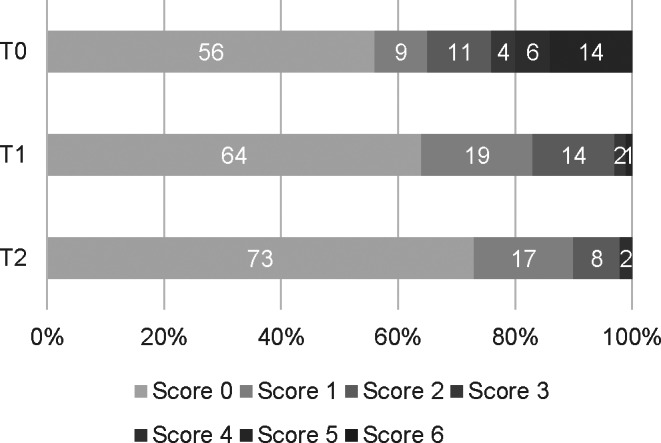
Lung ultrasound scores according to the LUS‐CAPS, as described in Table 3, at each time point. Percentage of regions with different LUS scores according to the LUS‐CAPS at admission (T0, n = 17, 306 regions), 2 weeks (T1, n = 13, 234 regions), and 1 month (T2, n = 6, 108 regions) after diagnosis
FIGURE 5.
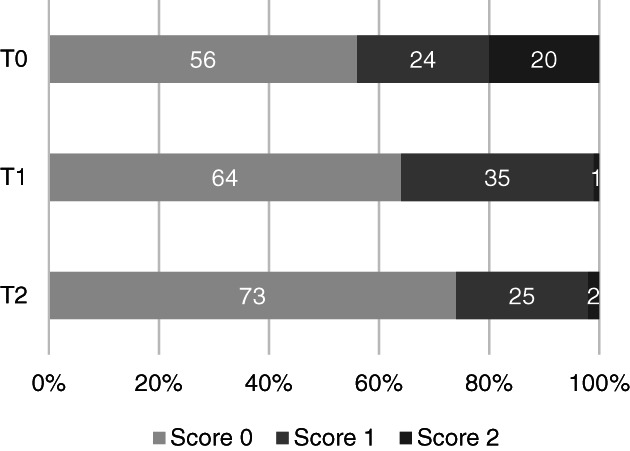
Percentage of regions classified as showing no lesions (score 0), B‐lines (score 1), or lung consolidation (shred sign or air/fluid bronchogram, score 2) according to the LUS‐sCAPS at admission (T0) (n = 17, 306 regions), 2 weeks after diagnosis (T1) (n = 13, 234 regions), and 1 month after diagnosis (T2) (n = 6, 108 regions)
At T0, 16 dogs had shred signs visible on LUS. In these 16 dogs, air bronchograms were identified in 12, fluid bronchograms in 4, and both bronchograms were visualized in 2 dogs within the shred signs (Figure 6). Pleural effusion and tissue signs were not identified in any dog at any time point. A shred sign persisted in 1 dog with serial follow‐up to T2, despite not having clinical findings compatible with AP at T1 or T2.
FIGURE 6.

Still image and schematic of a LUS in a dog with aspiration pneumonia. 1: Pleural line; 2: Coalescent numbers of B‐lines; 3: Lung tissue visible because of severe decrease in aerated lung; 4: Shred sign; 5: Fluid bronchogram (longitudinal image); 6: Air bronchogram (longitudinal image) and Air bronchograms (transverse image)
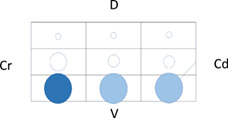
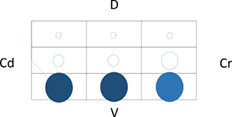
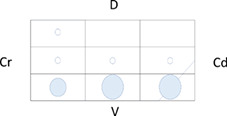
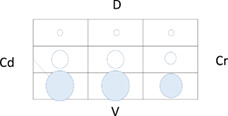
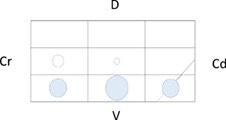
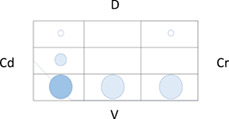
Table 5 shows the distribution of LUS lesions at each time point according to LUS‐CAPS, as well as the percentage of dogs having abnormalities in each region. The most severe lesions were found in the right ventral hemithorax at T0 showing median grades of 4 and 5 based on LUS‐CAPS. As shown in Table 5, median severity of lesions and the percentage of affected dogs were higher bilaterally in the ventral lung regions at all time points, although the overall percentage of animals with identifiable LUS lesions decreased with each serial evaluation.
TABLE 5.
Distribution of LUS findings on the right and left hemithorax, according to the LUS‐CAPS at the different time points
| Left | Right | |
|---|---|---|
|
T0 n = 17 |
|
|
|
T1 n = 13 |
|
|
|
T2 n = 6 |
|
|
Note: Median lesion severity score according to the LUS‐CAPS in each region corresponds to the color grading of the circles ranging from 0 to 6  . The 5 different circle sizes correspond to a percentage range of dogs showing lesions in that region (1%‐20%; 21%‐40%; 41%‐60%; 61%‐80%; 81%‐100%). The absence of any circle indicates that no dogs had any lesion on that region at that time point.
Abbreviations: CAPS, canine aspiration pneumonia score; Cd, caudal; Cr, cranial; D, dorsal; LUS, lung ultrasound; T0, admission; T1, 2 weeks after diagnosis; T2, 1 month after diagnosis; V, ventral.
In the 13 dogs with follow‐up available at T1, LUS‐CAPS were significantly different at T0 (0 [0‐2]) compared to T1 (0 [0‐1]; P < .0001). These dogs also had statistically significant differences in LUS‐sCAPS scores at T0 (0 [0‐1]) compared to T1 (0 [0‐1]; P < .0001). In the 6 dogs available at T2, median LUS‐CAPS scores were significantly different at T0 (0 [0‐3]) compared to T1 (0[0‐1]; P = .003) and T2 (0 [0‐1]; P = 0), but not between T1 and T2 (P = .71). These dogs also had LUS‐sCAPS scores that were significantly different at T0 (0 [0‐1]) compared to T1 (0 [0‐1]; P = .004) and T2 (0 [0‐1]; P < .006), but not between T1 and T2 (P = .78).
3.5. Serum C‐reactive protein concentration
C‐reactive protein concentrations at different time points are presented in Figure 7. Median CRP concentration was 137 mg/L (range, 24‐267 mg/L) at T0, 5 mg/L at T1 (range, 3‐32 mg/L) and 5 mg/L at T2 (range, 3‐8 mg/L). Values were increased (> 9 mg/L) in 2 dogs at T1, despite resolution of clinical findings in both. C‐reactive protein was normal in all dogs at T2.
FIGURE 7.
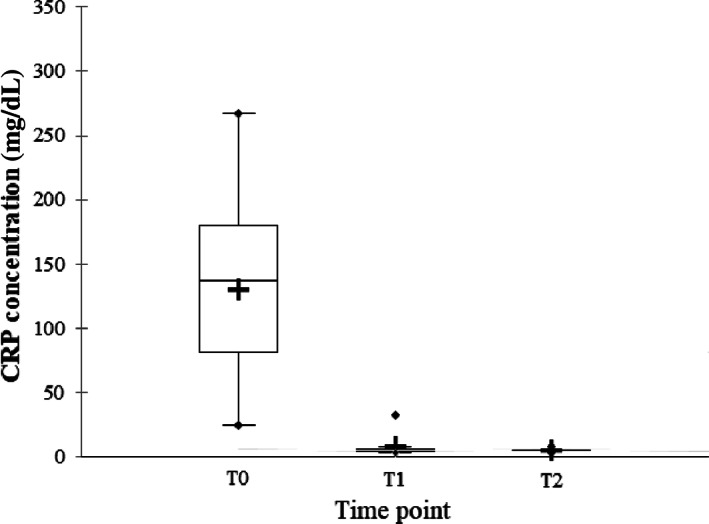
Serum C‐reactive protein (CRP) concentrations at each time point. Box plot showing CRP concentrations in dogs presented with aspiration pneumonia at admission (T0) (n = 17, mean (+): 129 mg/L, median (−): 137 mg/L, range, 24‐267 mg/L), 2 weeks after diagnosis (T1) (n = 13, mean (+): 7 mg/L, median (−): 5 mg/dL, range, 3‐32 mg/L), and 1 month after diagnosis (T2) (n = 6 dogs, mean (+): 5 mg/L, median (−): 5 mg/dL, range, 3‐8 mg/L)
There was a significant difference between CRP concentrations at T0 and T1 (n = 13, P = 0). In the 6 dogs that were available at T2, there was a statistically significant difference between T0 and T1 (P = .03) and between T0 and T2 (P = .03), but there was no significant difference between T1 and T2 concentrations (n = 6, P = 1).
3.6. Comparison of clinical, CXR findings, LUS findings
Chest radiographs‐CAPS scores (n = 18 per dog) were higher than LUS‐CAPS scores at T0 (2 [1–5] vs 0 [0‐2]; P < .001), T1 (1 [1, 2] vs 0 [0‐1], P < .001), and T2 (1 [1, 2] vs 0 [0‐1], P < .001). Chest radiogrpahs‐sCAPS scores were higher than LUS‐sCAPS at T0 (1 [1, 2] vs 0 [0‐1], P < .001), T1 (1 [1] vs 0 [0‐1], P < .001), and T2 (1 [1] vs 0 [0‐1], P < .001).
More dogs had an alveolar pattern identified on CXR than lung consolidation on ultrasound (Figures 2 and 3). An interstitial pattern on CXR (Figure 2) and the absence of LUS lesions (Figure 4) were the most common findings at all time points when all regions were considered. For each imaging modality, abnormalities scored as mild on sCAPS persisted across time points; for LUS, the frequency of detecting B‐lines was similar at T0 and T2, while for CXR, the finding of an interstitial pattern at any region increased from 49% to 82%.
4. DISCUSSION
This study describes LUS lesions in dogs with AP at both admission and follow‐up and compares imaging severity scores for AP between LUS and CXR.
As hypothesized, LUS findings in dogs with AP were similar to those described in humans with comAP. 13 , 20 , 21 , 29 , 30 The most frequent abnormalities noted at T0 were an increased number of B‐lines, shred signs, air bronchograms, fluid bronchograms, or both bronchograms. CXR findings of AP in dogs are most often observed in the right ventral hemithorax because of the gravity dependent nature of the lesions. 2 A similar finding for LUS abnormalities was observed in our study, as shown in Table 5, with a shred sign being most frequently located in the ventral regions (right > left) at T0. With the exception of 1 dog, these consolidations resolved over time. In cases of suspected dogs with AP, identifying ventral LUS consolidations provides supporting evidence for a diagnosis of AP, although further studies comparing AP to other disease conditions, particularly those causing lung consolidation, are required to determine the true sensitivity and specificity of LUS to identify AP in dogs.
Unlike comAP in humans, pleural effusion and tissue signs were not observed in the current study. The number of dogs in the current study was small and a larger study with more severely affected dogs might detect pleural effusion and tissue signs. The absence of pleural effusion in dogs with AP might also be due to species differences. Although pleural effusion is described in dogs with pneumonia, it appears to be uncommon. 44 In contrast, pleural effusion is a common finding in humans with comAP occurring in up to 34.4% to 61% of patients. 30 In humans, pleural effusion occurs because of an inflammatory reaction of the pleura with neutrophil accumulation and subsequently increased vascular endothelial permeability. 45 Tissue signs, also referred to as translobar lung consolidations, are considered a more severe form of lung consolidations than shred signs. 29 The incidence of tissue signs in humans with pneumonia is considered rare. 29 Based on our clinical experience, we believe that the absence of a tissue sign could also be explained by a less severe form of the disease in dogs compared to humans, or other inherent pathophysiological differences between human comAP and AP in dogs.
This report describes air and fluid bronchograms in dogs with AP, with air bronchograms being more commonly observed, which is similar to human pneumonia. 20 , 30 LUS lesions were described in a small cohort of 7 dogs diagnosed with bacterial pneumonia as part of a larger study, but no follow‐up was performed and the presence of air and fluid bronchograms was not assessed. 36 Air bronchograms represent air filled bronchi (punctate or linear hyperechoic structures) surrounded by consolidated lung. Air bronchograms can be dynamic or static in nature. Dynamic air bronchograms result from the centrifugal movement of air during the respiratory cycle because air is sonographically visible moving within the airways during respiration. In contrast, there is no visible respiratory‐driven movement of air with static air bronchograms, which represent trapped air within a collapsed lung region, often observed with absorptive atelectasis. 28 Fluid bronchograms are present when fluid filled bronchi (anechoic tubular structures with hyperechoic walls) are surrounded by collapsed or consolidated lung. 46 Fluid bronchograms have been described in cases of pneumonia secondary to the presence of aspirated contents or an inflammatory reaction within the bronchi. 28 From our limited clinical experience, there does not appear to be a clinically relevant difference between the presence of air vs fluid bronchograms in dogs with AP. Therefore, we chose to classify them with the same score (score 5 LUS‐CAPS).
There is limited research regarding the serial progression and evolution of radiographic lesions in dogs with AP. Evidence for the recommendation to perform follow‐up CXR 10‐14 days after starting as well as 1 week after discontinuing antimicrobial therapy in dogs is lacking. 1 , 6 One study showed a complete resolution of CXR abnormalities in 55% and 54.5% of dogs at 2‐ and 4‐week post‐diagnosis of AP, respectively. 16 In our study, there was a clear tendency toward improvement of CXR lesions over time (Figure 2), with alveolar patterns observed in 41%, 13%, and 11% of regions at T0, T1, and T2 respectively. However, mild CXR abnormalities (interstitial pattern) persisted across time points, and complete resolution of CXR abnormalities was not observed in any dog. Although the board‐certified radiologist was blinded to the time point that CXRs were performed, the lack of a control group for comparison might have biased the radiologist toward an over‐appreciation of lesions.
A previous study comparing lesion distribution between CXR and LUS for alveolar‐interstitial syndrome showed only fair agreement between the 2 modalities. 40 Similarly, our study identified significant differences at all time points between CXR and LUS. Positional atelectasis from recumbency could have impacted the lung parenchyma, but neither CXR nor LUS required prolonged recumbency. 1 The discrepant findings might also be explained by the lack of precise landmarks used to divide the LUS and CXR into regions. The LUS technique described begins at the upper caudal dorsal portion of each hemithorax where lung sliding is identified and follows an S‐shaped pattern where the caudal, mid, and ventral lungs are evaluated, 37 but more precise landmarks beyond dorsal, middle, and ventral are lacking.
Although the majority of AP lesions are visible at the lung surface, abnormalities within the lung parenchyma might be missed with LUS, but visible on CXR. In humans with comAP, 8% of lesions observed on CXR are missed using LUS 13 and their location deep within the lung parenchyma has been suggested as a possible explanation for this discrepancy. Conversely, although CXR images also detect lesions within the lung parenchyma, they are hampered by superposition. Interobserver repeatability for LUS abnormalities was not evaluated, as all LUS scores were performed by a single observer. Lung ultrasound and CXR scores are clinician dependent, which might explain the identified differences. The arbitrary scoring systems used for both imaging modalities might largely explain the significant differences between CXR and LUS scores using both CAPS and sCAPS.
We attempted to create a LUS scoring system for dogs with AP to allow comparison of abnormalities with CXR findings based on a previously published CXR scoring system. 4 In addition, we also created a simplified version of both scores (CXR and LUS‐sCAPS), to determine if a less complex scoring system (based on the presence of alveolar lesions on CXR or lung consolidation on LUS) would provide similar information. Based on the results of the current study, CXR and LUS CAPS and sCAPS scores should not be compared in cases of AP. However, given that both scoring systems showed similar changes over time, the simplified scoring system could be considered an equivalent alternative for either modality.
C‐reactive protein is a reliable APP to monitor treatment response in bacterial pneumonia in dogs. 17 , 18 All dogs had complete resolution of clinical findings during follow‐up and, according to our results, CRP concentration and the resolution of lung consolidations on LUS corresponded best with clinical findings. The low number of dogs included during follow‐up prevented comparison between LUS and CRP over time; however, both might be useful and provide complementary information when monitoring dogs with AP. This is supported by the fact that CRP concentration remained slightly elevated in only 2 dogs at T1 and was normal in all dogs at T2, while lung consolidation (LUS‐sCAPS score 2) only persisted in 1 dog during follow‐up. Sonographic resolution of lung consolidations has been described in humans with comAP at short‐term follow‐up, but has not been reported in the veterinary literature. Our study suggests that severe and mild abnormalities on CXR and detection of only B‐lines on LUS correspond poorly with clinical findings during follow‐up. This is supported by the fact that severe CXR lesions were present in 13% and 11% and mild CXR lesions in 74% and 82% of all the regions evaluated at T1 and T2, respectively. B‐lines were detected in 35% and 24% of the regions evaluated at T1 and T2, respectively.
This study had several limitations including the small number of dogs enrolled, which decreased over time. The reference standard for diagnosis of AP is defined as the presence of bacteria on lower airway samples. Lower airway sampling was not performed in any dog because hospital policy at the clinical study location considers it to be a relatively expensive and invasive technique. 1 , 6 Regardless, given the clinical presentation and response to treatment noted in all cases, AP was the most likely final diagnosis. We did not distinguish static and dynamic air bronchograms as AP is rarely associated with atelectasis, which is the main cause of static air bronchograms. 28
In conclusion, dogs with AP have similar lesions as those described in humans with comAP. There are significant differences noted between CXR and LUS CAPS and sCAPS scores in dogs. At the time of diagnosis, LUS consolidations are most often observed ventrally. Resolution of lung consolidations on LUS and normalization of CRP concentrations seem to be the monitoring tools that most closely follow clinical findings compatible with AP. The sCAPS might be preferred over CAPS as it is easier to apply but still allows resolution of lung consolidations to be followed serially over time. Further studies comparing CRP, LUS, and clinical findings are required to determine optimal antibiotic discontinuation times in dogs with AP.
CONFLICT OF INTEREST DECLARATION
Authors declare no conflict of interest.
OFF‐LABEL ANTIMICROBIAL DECLARATION
Authors declare no off‐label use of antimicrobials.
INSTITUTIONAL ANIMAL CARE AND USE COMMITTEE (IACUC) OR OTHER APPROVAL DECLARATION
Approved by the small animal ethics committee at the University of Liège, number 19‐2081.
HUMAN ETHICS APPROVAL DECLARATION
Authors declare human ethics approval was not needed for this study.
ACKNOWLEDGMENT
No funding was received for this study.
Fernandes Rodrigues N, Giraud L, Bolen G, et al. Comparison of lung ultrasound, chest radiographs, C‐reactive protein, and clinical findings in dogs treated for aspiration pneumonia. J Vet Intern Med. 2022;36(2):743‐752. doi: 10.1111/jvim.16379
REFERENCES
- 1. Dear JD. Bacterial pneumonia in dogs and cats. Vet Clin Small Anim. 2014;44:143‐159. [DOI] [PMC free article] [PubMed] [Google Scholar]
- 2. Sherman R, Karagiannis M. Aspiration pneumonia in the dog: a review. Topics in Compan an Med. 2017;32:1‐7. [DOI] [PubMed] [Google Scholar]
- 3. Kogan DA, Johnson LR, Jandrey KE, Pollard RE. Clinical, clinicopathologic, and radiographic findings in dogs with aspiration pneumonia: 88 cases (2004–2006). J Am Vet Med Assoc. 2008;233:1742‐1747. [DOI] [PubMed] [Google Scholar]
- 4. Kogan DA, Lynelle RJ, Sturges BK, et al. Etiology and clinical outcome in dogs with aspiration pneumonia: 88 cases (2004–2006). J Am Vet Med Assoc. 2008;233:1748‐1755. [DOI] [PubMed] [Google Scholar]
- 5. Tart KM, Babski DM, Lee JA. Potential risks, prognostic indicators, and diagnostic and treatment modalities affecting survival in dogs with presumptive aspiration pneumonia: 125 cases (2005‐2008). J Vet Emerg Crit Care. 2010;20:319‐329. [DOI] [PubMed] [Google Scholar]
- 6. Lappin MR, Blondeau J, Boothe D, et al. Antimicrobial use guidelines for treatment of respiratory tract disease in dogs and cats: antimicrobial guidelines working group of the International Society for Companion Animal Infectious Diseases. J Vet Intern Med. 2017;31:279‐294. [DOI] [PMC free article] [PubMed] [Google Scholar]
- 7. Corrado ER, Lee D, Lucero DE, et al. Burden of adult community‐acquired, healthcare‐associated, hospital‐acquired, and ventilator‐associated pneumonia – New York City, 2010‐2014. Chest. 2017;152:930‐942. [DOI] [PubMed] [Google Scholar]
- 8. Lim WS, Baudouin SV, George RC, et al. BTS guidelines for the management of community acquired pneumonia in adults: update 2009. Thorax. 2009;64:1‐55. [DOI] [PubMed] [Google Scholar]
- 9. Li JZ, Winston LG, Moore DH, Bent S. Efficacy of short‐course antibiotic regimens for community‐acquired pneumonia: a meta‐analysis. Am J Med. 2007;120:783‐790. [DOI] [PubMed] [Google Scholar]
- 10. Christ‐Crain M, Stolz D, Bingisser R, et al. Procalcitonin guidance of antibiotic therapy in community‐acquired pneumonia: a randomized trial. Am J Respir Crit Care Med. 2006;174:84‐93. [DOI] [PubMed] [Google Scholar]
- 11. Schuetz P, Christ‐Crain M, Thomann R, et al. Effect of procalcitonin‐based guidelines vs standard guidelines on antibiotic use in lower respiratory tract infections: the ProHOSP randomized controlled trial. JAMA. 2009;302:1059‐1066. [DOI] [PubMed] [Google Scholar]
- 12. Long W, Deng X, Zhang Y, et al. Procalcitonin guidance for reduction of antibiotic use in low‐risk outpatients with community‐acquired pneumonia. Respirology. 2011;16:819‐824. [DOI] [PubMed] [Google Scholar]
- 13. Reissig A, Copetti R, Mathis G, et al. Lung ultrasound in the diagnosis and follow‐up of community‐acquired pneumonia: a prospective, multicenter, diagnostic accuracy Study. Chest. 2012;142:965‐972. [DOI] [PubMed] [Google Scholar]
- 14. Bruns AH, Oosterheert JJ, Prokop M, et al. Patterns of resolution of chest radiograph abnormalities in adults hospitalized with severe community‐acquired pneumonia. Clin Infect Dis. 2007;45:983‐991. [DOI] [PubMed] [Google Scholar]
- 15. Bruns AH, Oosterheert JJ, El Moussaoui R, et al. Pneumonia recovery: discrepancies in perspectives of the radiologist, physician and patient. J Gen Intern Med. 2010;25:203‐206. [DOI] [PMC free article] [PubMed] [Google Scholar]
- 16. Wayne A, Davis M, Sinnott VB, et al. Outcomes in dogs with uncomplicated, presumptive bacterial pneumonia treated with short or long course antibiotics. Canad Vet J. 2017;58:610‐613. [PMC free article] [PubMed] [Google Scholar]
- 17. Viitanen SJ, Lappalainen AK, Christensen MB, Sankari S, Rajamäki MM. The utility of acute phase proteins in the assessment of treatment response in dogs with bacterial pneumonia. J Vet Intern Med. 2017;31:124‐133. [DOI] [PMC free article] [PubMed] [Google Scholar]
- 18. Viitanen SJ, Laurila HP, Lilja‐Maula LI, Melamies MA, Rantala M, Rajamäki MM. Serum C‐reactive protein as a diagnostic marker in dog with bacterial respiratory diseases. J Vet Intern Med. 2014;28:84‐91. [DOI] [PMC free article] [PubMed] [Google Scholar]
- 19. Nazerian P, Volpicelli G, Vanni S, et al. Accuracy of lung ultrasound for the diagnosis of consolidations when compared to chest computed tomography. Am J Emerg Med. 2015;33:620‐625. [DOI] [PubMed] [Google Scholar]
- 20. Reissig A, Kroegel C. Sonographic diagnosis and follow‐up of pneumonia: a prospective Study. Respirology. 2007;74:537‐547. [DOI] [PubMed] [Google Scholar]
- 21. Parlamento S, Copetti R, Di Bartolomeo S. Evaluation of lung ultrasound for the diagnosis of pneumonia in the ED. Am J Emerg Med. 2009;27:379‐384. [DOI] [PubMed] [Google Scholar]
- 22. Lichtenstein D. Should lung ultrasonography be more widely used in the assessment of acute respiratory disease? Expert Rev Resp Med. 2010;4:533‐538. [DOI] [PubMed] [Google Scholar]
- 23. Lichtenstein D. Ultrasound examination of the lungs in the intensive care unit. Pediatr Crit Care Med. 2009;10:693‐698. [DOI] [PubMed] [Google Scholar]
- 24. Lichtenstein D, Hooland SV, Elbers P, et al. Ten good reasons to practice ultrasound in critical care. Anesth Int Therap. 2014;46:323‐335. [DOI] [PubMed] [Google Scholar]
- 25. Touw HRW, Tuinman PR, Gelissen HPMM, et al. Lung ultrasound: routine practice for the next generation of internists. Neth J Med. 2015;73:100‐107. [PubMed] [Google Scholar]
- 26. Volpicelli G, Elbarbary M, Blaivas M, et al. International evidence‐based recommendations for point‐of‐care lung ultrasound. Int Care Med. 2012;38:577‐591. [DOI] [PubMed] [Google Scholar]
- 27. Zanforlin A, Giannuzzi R, Nardini S, et al. The role of chest ultrasonography in the management of respiratory diseases: document I. Multidiscip Respir Med. 2013;8:54. [DOI] [PMC free article] [PubMed] [Google Scholar]
- 28. Smargiassi A, Inchingolo R, Soldati G, et al. The role of chest ultrasonography in the management of respiratory diseases: document II. Multidiscip Respir Med. 2013;8:8:55. [DOI] [PMC free article] [PubMed] [Google Scholar]
- 29. Arabiat M, Foderaro AE, Levinson AT, et al. Lung ultrasound for diagnosing patients with severe dyspnea and acute hypoxic respiratory failure. Rhode Isl Med J. 2019;102:34‐38. [PubMed] [Google Scholar]
- 30. Reissig A, Gramegna A, Aliberti S. The role of lung ultrasound in the diagnosis and follow‐up of community‐acquired pneumonia. Eur J Int Med. 2012;23:391‐397. [DOI] [PubMed] [Google Scholar]
- 31. Boysen SR, Lisciandro GR. The use of ultrasound for dogs and cats in the emergency room AFAST and TFAST. Vet Clin Small Anim. 2013;43:773‐797. [DOI] [PubMed] [Google Scholar]
- 32. Lisciandro GR, Fosgate GT, Fulton RM. Frequency and number of ultrasound lung rockets (B‐lines) using a regionally based lung ultrasound examination named vet BLUE (veterinary bedside lung ultrasound exam) in dogs with radiographically normal lung findings. Vet Radiol Ultrasound. 2014;55:315‐322. [DOI] [PubMed] [Google Scholar]
- 33. Ward JL, Lisciandro GR, Keene BW, Tou SP, DeFrancesco TC. Accuracy of point‐of‐care lung ultrasonography for the diagnosis of cardiogenic pulmonary edema in dogs and cats with acute dyspnea. J Am Vet Med Assoc. 2017;250:666‐675. [DOI] [PubMed] [Google Scholar]
- 34. Rademacher N, Pariaut R, Pate J, Saelinger C, Kearney MT, Gaschen L. Transthoracic lung ultrasound in normal dogs and dogs with cardiogenic pulmonary edema: a pilot study. Vet Radiol Ultrasound. 2014;55:447‐452. [DOI] [PubMed] [Google Scholar]
- 35. Lisciandro GR. Abdominal and thoracic focused assessment with sonography for trauma, triage, and monitoring in small animals. J Vet Emerg Crit Care. 2011;21:104‐122. [DOI] [PubMed] [Google Scholar]
- 36. Ward JL, Lisciandro JR, Ware WA, et al. Lung ultrasonography findings in dogs with various underlying causes of cough. J Am Vet Med Assoc. 2019;255:574‐583. [DOI] [PubMed] [Google Scholar]
- 37. Armenise A, Boysen S, Rudloff E, et al. Veterinary focused assessment with sonography for trauma‐airway, breathing, circulation, disability and exposure: a prospective observational study in 64 canine trauma patients. J Small Anim Pract. 2019;60:173‐182. [DOI] [PubMed] [Google Scholar]
- 38. Boysen S, McMurray J, Gommeren K. Abnormal curtain signs identified with a novel lung ultrasound protocol in six dogs with pneumothorax. Frontiers Vet Science. 2019;6:291. [DOI] [PMC free article] [PubMed] [Google Scholar]
- 39. Boysen S. Small animal point of care ultrasound techniques. Vet Ireland J. 2017;7:613‐619. [Google Scholar]
- 40. Ward JL, Lisciandro GR, DeFrancesco TC. Distribution of alveolar‐interstitial syndrome in dogs and cats with respiratory distress as assessed by lung ultrasound versus thoracic radiographs. J Vet Emerg Crit Care. 2018;28:415‐428. [DOI] [PubMed] [Google Scholar]
- 41. Cole L, Pivetta M, Humm K. Diagnostic accuracy of a lung ultrasound protocol (vet BLUE) for detection of pleural fluid, pneumothorax and lung pathology in dogs and cats. J Small Anim Pract. 2021;62:178‐186. [DOI] [PubMed] [Google Scholar]
- 42. GrooteBidlingmaier F, Koegelenberg CFN. A practical guide to transthoracic ultrasound. Breathe. 2012;9:133‐142. [Google Scholar]
- 43. Piñeiro M, Pato R, Soler L, et al. A new automated turbidimetric immunoassay for the measurement of canine C‐reactive protein. Vet Clin Pathol. 2018;47:130‐137. [DOI] [PubMed] [Google Scholar]
- 44. Frame M, King A. The pleural space. In: Schwars T, Johnson V, eds. BSAVA Manual of Canine and Feline Thoracic Imaging. 1st ed. Quedgeley; Gloucs: BSAVA; 2008:321‐339. [Google Scholar]
- 45. Yang W, Zhang B, Zhang ZM. Infectious pleural effusion status and treatment progress. J Thorac Dis. 2017;9:4690‐4699. [DOI] [PMC free article] [PubMed] [Google Scholar]
- 46. Reissig A, Copetti R. Lung ultrasound in community‐acquired pneumonia and in interstitial lung diseases. Respirology. 2014;87:179‐189. [DOI] [PubMed] [Google Scholar]


