Abstract
RYR2 mutation is clinically frequent in non‐small cell lung cancer (NSCLC) with its function being elusive. We downloaded lung squamous cell carcinoma and lung adenocarcinoma samples from the TCGA database, split the samples into RYR2 mutant group (n = 337) and RYR2 wild group (n = 634), and established Kaplan‐Meier curves. The results showed that RYR2 mutant group lived longer than the wild group (p = 0.027). Weighted gene co‐expression network analysis (WGCNA) of differentially expressed genes (DEGs) yielded prognosis‐related genes. Five mRNAs and 10 lncRNAs were selected to build survival prognostic models with other clinical features. The AUCs of 2 models are 0.622 and 0.565 for predicting survival at 3 years. Among these genes, the AUCs of DKK1 and GS1‐115G20.1 expression levels were 0.607 and 0.560, respectively, which predicted the 3‐year survival rate of NSCLC sufferers. GSEA identified an association of high DKK1 expression with TP53, MTOR, and VEGF expression. Several target miRNAs interacting with GS1‐115G20.1 were observed to show the relationship with the phenotype, treatment, and survival of NSCLC. NSCLC patients with RYR2 mutation may obtain better prognosis by down‐regulating DKK1 and up‐regulating GS1‐115G20.1.
Keywords: Dickkopf Wnt signalling pathway inhibitor‐1, differentially expressed gene, long non‐coding RNA, non‐small cell lung cancer, prognostic signature, ryanodine receptor 2
1. INTRODUCTION
Globally, the number of lung cancer cases and deaths is increasing, with GLOBOCAN statistics in 2018 showing approximately more than 2 million new cases of lung cancer, reported to hold 11.6% of all cancer types, and 1.76 million deaths, accounting for 18% of all cancers [1]. Despite the availability of surgery, chemotherapy, and targeted drug therapy [2], the overall survival (OS) of lung cancer is still disappointing, with a survival rate at 5 years of only 19.4% [3]. Non‐small cell lung cancer (NSCLC) is the highest prevalent subtype reported to take up 85% of total lung cancers [4]. Depending on the different pathological features, NSCLC can be further classified into three types: squamous cell carcinoma, adenocarcinoma, and large cell carcinoma. In NSCLC cells, there are a large number of genetic and epigenetic alterations [5], which have an important impact on the pathogenesis and progression of NSCLC. Understanding the somatic genetic mutations and transcriptome changes of NSCLC is of great significance for improving the prognosis of NSCLC.
Many cancer genetic studies have identified frequent mutations in the genes that encode extremely large protein molecules in cancer cells, and these mutated genes include TTN, RYR2, RYR3, MUC16, MUC4, and DNAH5 [6]. In order to study human cancers at the gene and transcriptional product level, numerous public databases from large patient cohorts have been created to identify various biomarkers related to cancer pathogenesis, progression and therapeutic responses [7, 8]. By analysing public data, we found that RYR2 mutation is a clinically frequent variant in NSCLC. Ryanodine receptor two protein, encoded by the RYR2 gene, is predominantly distributed in heart and involved in excitation–contraction coupling [9], whose mutations are mainly associated with a range of myopathies and arrhythmias [10]. Although RYR2 polymorphisms have been confirmed for underlying functions in three different regions or “hotspots” of the coding sequence, the study of its assumed function in cancers is still in its initial stages and further studies are expected [11]. Schmitt, K et al. found differential promoter methylation status and expression level of RYR2 in head and neck tumor, suggesting that reduced expression of RYR2 in adjacent tissues and precancerous lesions may potentially indicate poor survival and impending malignancy [6]. In oesophageal cancer, the RYR2 mutation upregulated signalling pathways involved in the immune response and enhanced anti‐tumor immunity [12]. The RYR2 rs12594 mutation (occurring in the 3′‐UTR) also significantly reduced the risk of developing breast cancer [13]. Nevertheless, its role in NSCLC is currently unknown.
Long non‐coding RNAs (lncRNAs), a type of RNA molecule composed of over 200 nucleotides, are structurally similar to messenger RNAs but not translated into proteins [14, 15]. The main ways in which lncRNAs perform biological functions in disease include: RNA decoy, miRNA sponge, constituting RNP, recruiting chromatin modifier as well as influencing transcription, splicing and degradation of mRNA [16]. More and more evidences have shown that lncRNAs are disordered in human cancer [17]. Yang et al. demonstrated that NSCLC cells with up‐regulated lncRNA GACAT3 expression have increased the resistance of tumor cells to radiotherapy [18], while Shi’s group uncovered that down‐regulated GAS5 expression in NSCLC suggested poor prognosis [19]. Although there is no lncRNA specifically associated with NSCLC, the crucial functions which lncRNAs play towards the diagnosis, treatment and prognostic evaluation of NSCLC are emerging [16].
In this study, we used a series of bioinformatical tools to construct risk prognostic models of mRNAs and lncRNAs in NSCLC with RYR2 mutations. For the first time, significant associations of high DKK1 or low GS1‐115G20.1 expressions with the poor outcomes of NSCLC in the presence of RYR2 mutations were uncovered, and a significant negative correlation was identified between the expression of DKK1 and GS1‐115G20.1 in RYR2 mutated NSCLC.
2. MATERIALS AND METHODS
2.1. Sample preparation and preprocessing
Genomic and transcriptomic data was retrieved from the lung adenocarcinoma (LUAD) and lung squamous cell carcinoma (LUSC) files which are documented in the Cancer Genome Atlas (TCGA) on the UCSC Xena platform (https://xenabrowser.net/). Samples with no survival status or survival time were removed from our study, while the samples with both genomic and transcriptomic data were retained. According to the mutation data detected by the Varscan2 software [20], those containing RYR2 sense mutations were classified as the mutant group, while those without RYR2 sense mutations were classified as the wild group. We used Kaplan‐Meier curves to analyse survival differences between the RYR2 mutant and wild groups and included age, gender, TNM classification of the tumour, disease diagnosis (LUAD or LUSC) and tumour stage as covariates to reduce the effect of confounding factors.
2.2. Identification of differentially expressed genes (DEGs) and functional enrichment analysis
Differentially expressed mRNAs (DEmRNAs) and lncRNAs (DElncRNAs) were analysed by R package “edgeR” between the RYR2 mutant group (n = 337) and RYR2 wild group (n = 634), the DEmRNAs and DElncRNAs with adjusted p values less than 0.05 were retained [21, 22]. Gene Ontology (GO) analysis [23, 24] and Kyoto Encyclopaedia of Genes and Genomes (KEGG) pathway enrichment analysis were run for differential mRNAs with R package “clusterProfiler” [24].
2.3. Weighted gene co‐expression network analysis (WGCNA)
The modules of co‐expressed differential mRNAs and lncRNAs were identified by R package “WGCNA” [25, 26]. First, a suitable soft threshold β = 6 was calculated. Then, average linkage hierarchical clustering was realised on a dendrogram as a result of DynamicTreeCut analysis based on a Topological Overlap Measure (TOM)‐based dissimilarity matrix. A minimum threshold of 40 was set to group the genes of similar expression pattern into the same modules. Module eigengenes (MEs) were calculated, and then the modules were analysed by clustering, and the closer modules were merged into new modules by setting height = 0.5. To determine the association with clinical traits, gene significance (GS) for each module was computed, and higher GS indicated genes with more biologically significant association with clinical features. Module‐gene significance (MS) describes the relationship between module gene expression profiles and MEs. Then, MEs were correlated with different clinical features to identify the modules associated with prognosis [27].
2.4. Risk prognostic model based on multivariate COX proportional hazard model
For DEGs, univariate regression analysis with p < 0.05 was used as a filter to identify prognosis‐related mRNAs and lncRNAs by combining clinical information. The mRNA genes and lncRNA genes associated with prognosis were screened by the least absolute shrinkage and selection operator (Lasso) Cox penalised regression model. Corresponding coefficients were obtained, and risk prognostic models of the identified mRNAs and lncRNAs were constructed according to the expression levels and coefficients of these genes. According to the models, each patient was scored and then defined as high and low risk by taking the median score as the threshold. Differences in survival rates between the two cohorts were analysed. Time‐dependent receiver operating characteristic (ROC) curves were drawn to determine the predictive performance of risk score one and risk score two on the survival of NSCLC patients at 3 years. To further investigate the reliability of the mRNA prediction model, we downloaded the data of the other article for external validation of the 3‐year survival rate [28].
2.5. Analysis of crucial DEmRNA DKK1 and DELncRNA GS1‐115G20.1
Multivariate Cox regression models were constructed to validate whether the crucial DEmRNA DKK1 and DElncRNA GS1‐115G20.1 are prognostic factors independent of other clinical factors. Statistical significance was defined when p < 0.05. According to TP53 mutation, the samples were split into the TP53 mutant group and wild group. Thereafter, expressions of DKK1 and GS1‐115G20.1 in both groups were compared. Median expression‐based grouping was then performed to classify patients into high and low expression groups, and Kaplan‐Meier curves were plotted to compare their survival. ROC analysis was run to evaluate the predictive accuracy of DKK1 and GS1‐115G20.1 on 3‐year survival in NSCLC.
The transcriptomic data were processed by GSEA software based on the high and low DKK1 expression in the samples [29]. The DEGs between the high and low expression groups of DKK1 were analysed by the R package “edgeR”, and then the DEGs list was annotated by DAVID [30]. To identify the transcription factors (TFs), the DEGs in high and low DKK1 expression groups were analysed by R package “edgeR”, and a total of 1485 DEGs were obtained with the condition that p < 0.05 and |log2(FC)|≥ 0.8. The list of DEGs was annotated by DAVID (module UCSC_TFBS of function Protein_Interactions), and the filtering condition was p < 0.05. In this way, we can use the UCSC database collection of TFBS (transcription factor binding sites) to understand which transcription factors the genes are enriched to.
To further investigate DElncRNA GS1‐115G20.1, we used the StarBase v2.0 database [31] for the competing endogenous RNAs (ceRNAs) of C1ORF21, which took the top 20. The correlation of C1ORF21, GS1‐115G20.1 and ceRNAs expression was performed separately based on the data obtained from this analysis. The Custom Prediction function of the miRDB database (http://www.mirdb.org/) was consulted to show the possible miRNA targets of GS1‐115G20.1 [32].
2.6. Ethical statement
Not applicable.
2.7. Statistical analysis
Statistical tests and plots were completed on R and GraphPad Prism 7.04. A difference of statistical significance was defined at p < 0.05. In the graph, *p < 0.05, **p < 0.01, **p < 0.001, ***p < 0.0001.
3. RESULTS
3.1. Survival analysis of the RYR2 mutant group and wild group
Figure 1 shows the workflow of the whole study. Totally, 971 analysable NSCLC samples were obtained by the UCSC Xena database retrieval (Table S1), which were split into the RYR2 mutant group (n = 337) and the wild group (n = 634) (Table 1). See Table S2 for a comparison of the clinical characteristics of the two groups of patients. Between‐group comparison for survival was implemented, and it was demonstrated that the OS of the RYR2 mutant group was longer than that of the RYR2 wild group (HR = 0.778 95% CI = 0.625–0.969) (Figure 2a), with the statistical significance as indicated in the logarithmic rank test (p = 0.025).
FIGURE 1.
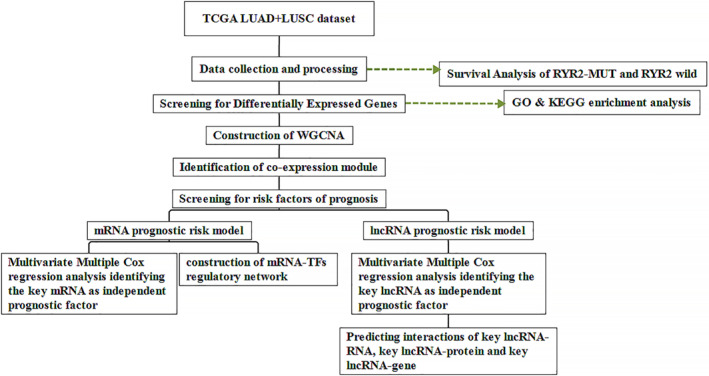
Workflow chart of the study
TABLE 1.
NSCLC samples based on RYR2 mutation/wild grouping
| No. of pts. | RYR2 MUT | RYR2 WT | |
|---|---|---|---|
| LUAD | 491 | 171 | 320 |
| LUSC | 480 | 166 | 314 |
Abbreviations: NSCLC, non‐small cell lung cancer; LUAD, lung adenocarcinoma; LUSC, lung squamous cancer; pts, patients; MUT, mutation; WT, wild type.
FIGURE 2.
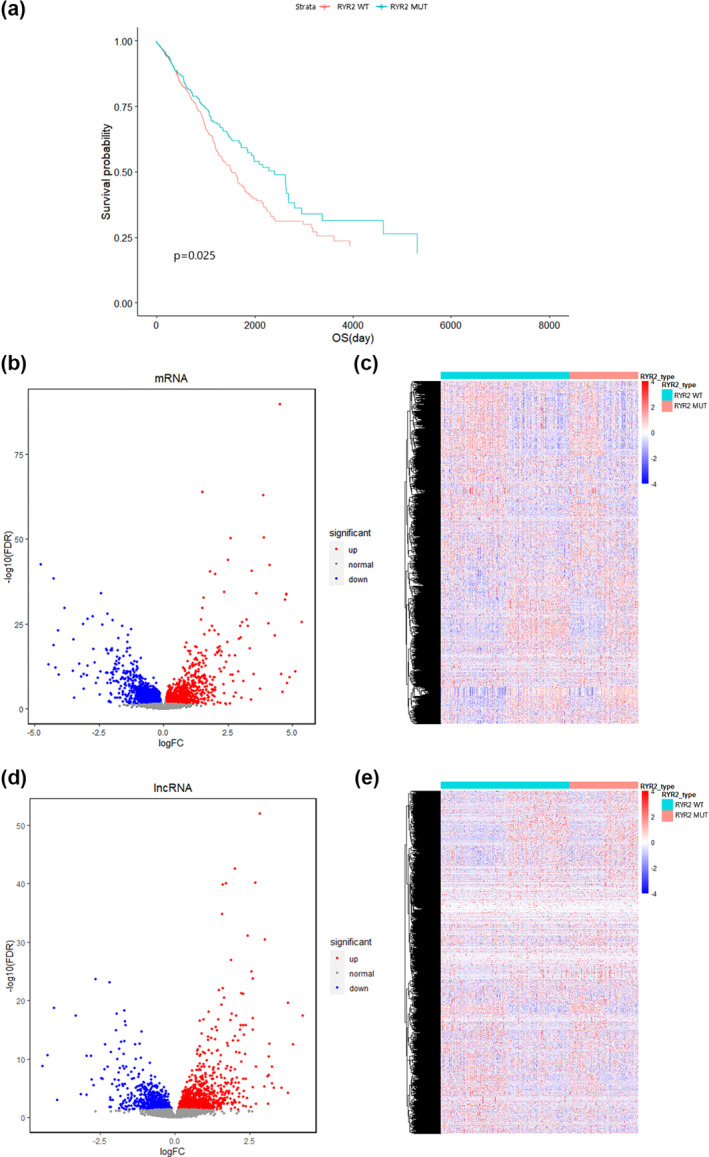
Overall survival and DEGs of RYR2 mutant group and wild group. (a) Kaplan‐Meier curve comparison of survival times between RYR2 wild‐type and mutant groups. (b, c) volcano plot (b) and heat map (c) of DEmRNAs obtained by “edgeR” analysis. (d, e): volcano plot (d) and heat map (e) of DElncRNAs obtained by “edgeR” analysis. DEGs, differentially expressed genes; DElncRNAs, differentially expressed lncRNAs; DEmRNAs, differentially expressed mRNAs; FC, fold change; FDR, false discovery rate; RYR2 WT, RYR2 wild‐type; RYR2 MUT, RYR2 mutant
3.2. DEmRNAs and DElncRNAs between the RYR2 mutant group and wild group
The DEmRNAs and DElncRNAs between the RYR2 mutation and wild group were screened by using R package “edgeR” on 971 patients genomic and transcriptomic data. With p < 0.05, 9271 DEGs were obtained in total, composed of 5346 DEmRNAs and 3925 DElncRNAs (Table 2). Compared with the wild group, the mutant group had 2702 up‐regulated and 2644 down‐regulated mRNAs, with significantly reduced transcription of RYR2 (logFC = −0.376 p = 4.43e‐4) (Figures 2b,c. Table S3); besides, 2168 and 1857 lncRNAs were differentially up‐regulated and down‐regulated, respectively, in the mutant group (Figures 2d,e, Table S4).
TABLE 2.
Differentially expressed mRNAs and lncRNAs
| DEGs | Up | Down | |
|---|---|---|---|
| mRNA | 5346 | 2702 | 2644 |
| lncRNA | 3925 | 2168 | 1757 |
Abbreviation: DEGs, differentially expressed genes.
Functional enrichment analysis of DEmRNAs was performed by R package “clusterProfiler”. GO annotation showed that DEmRNAs were mainly associated with nuclear division, organelle division, transmembrane transport complex, and metal ion transmembrane transport activity (Figure 3a–c, Table S5). Additionally, KEGG pathway enrichment analysis revealed that the genes of DEmRNA were predominantly involved in neuroactive ligand‐receptor interaction, complement and coagulation cascades, cAMP signalling pathway, adrenergic signalling in cardiomyocytes, cell cycle and other pathways (Figure 3d, Table S6).
FIGURE 3.
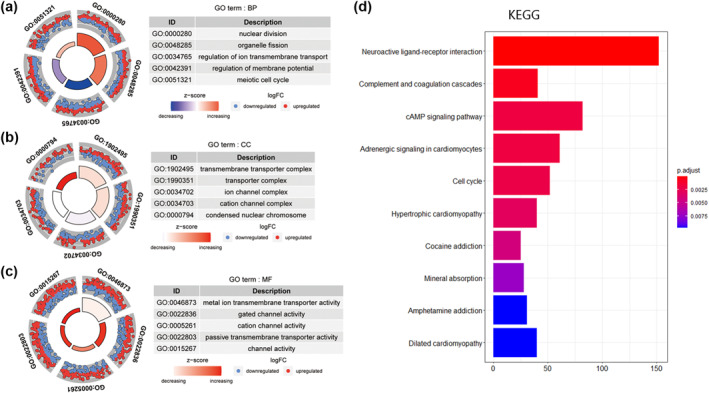
The most enriched GO terms and KEGG pathways of DEmRNA. (a, b, c) GO functional enrichment analysis annotated DEmRNA in terms of BP (a), CC (b), and MF (c), respectively. (d) KEGG pathway analysis. The X‐axis displays the number of genes activated in each pathway. BP, biological process; CC, cellular component; KEGG, Kyoto encyclopaedia of genes and genomes; MF, molecular function
3.3. Construction of co‐expression network to identify prognosis‐related modules
DEmRNAs and DElncRNAs were projected onto a weighted co‐expression network with the R package “WGCNA”, and then the modules obtained were clustered into 24 modules in total (Figure 4a), with the module sizes ranging from 52 to 2208 genes (Table 3). Independent genes were clustered into grey modules which were excluded from this analysis. The topological overlap of co‐expressed genes in each module was shown in the DEGs heat map (Figure 4b), and the relationship of the 24 co‐expression modules was shown in the eigengene adjacency heat map (Figure 4c). Pearson correlation coefficients were calculated for the MEs. The numbers displayed in each small cell are the coefficients that reflect the association between the gene modules and the corresponding clinical factors, and the numbers in parentheses indicate the p‐value. In Figure 4d, we can conclude significant associations of the blue and light green modules with one‐year survival and the red module with OS; hence, genes from these three modules were selected for further analysis.
FIGURE 4.
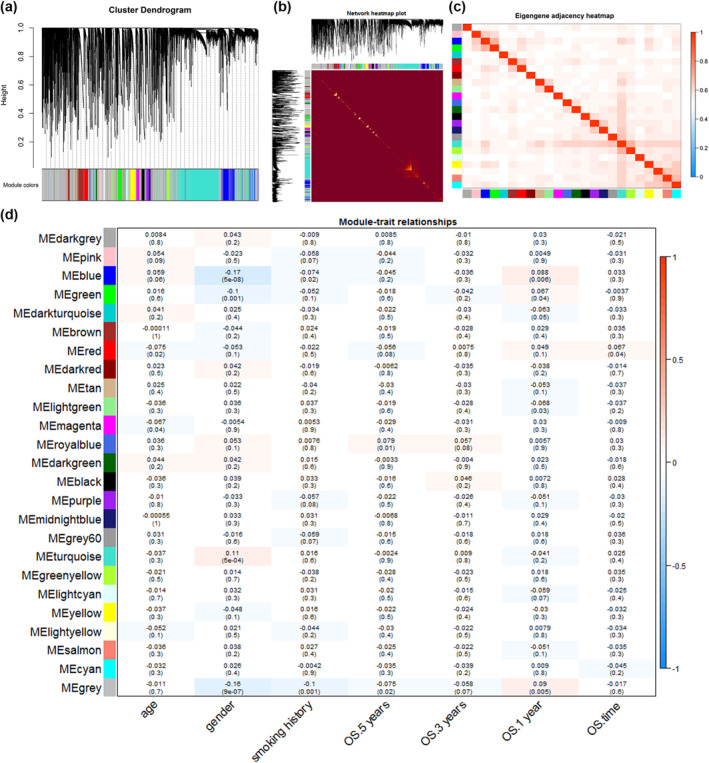
Network construction and module‐trait relationships of co‐expressed genes. (a) Clustered dendrograms and co‐expression network modules generated by topologically overlapping DEGs based on average linkage hierarchical clustering. Each branch in the tree diagram represents a gene. Euclidean distances are highly depicted. Each colour indicates a different co‐expression module. (b) Heat map of topological overlap. Yellow areas represent high levels of topological overlap. (c) Heat map of feature gene adjacency. The heat map shows the correlation between different co‐expression modules. (d) Module‐trait relationship. Each row is a specific module and each column is a clinical feature. The R 2 and p values (in parentheses) for the Pearson correlations of modules with clinical traits were shown in the squares. Gradient colour ranging from −1 to 1 represent the R2‐values of Pearson correlations. ME, module eigengene; OS, overall survival
TABLE 3.
Gene number of each WGCNA module
| Module | No. of genes | Module | No. of genes |
|---|---|---|---|
| Black | 145 | Light green | 71 |
| Blue | 596 | Light yellow | 69 |
| Brown | 290 | Magenta | 134 |
| Cyan | 98 | Midnight blue | 93 |
| Dark green | 59 | Pink | 137 |
| Dark grey | 52 | Purple | 129 |
| Dark red | 64 | Red | 189 |
| Dark turquoise | 53 | Royal blue | 67 |
| Green | 196 | Salmon | 106 |
| Green yellow | 113 | Tan | 112 |
| Grey | 72 | Turquoise | 2208 |
| Light cyan | 74 | Yellow | 275 |
3.4. Univariate regression analysis to screen prognosis‐related genes in blue, light green, and red modules
For DEGs, univariate regression analysis with p < 0.05 as the filtering condition was used to screen a total of 77 prognosis‐related genes from blue, light green and red modules, including 57 mRNAs and 20 lncRNAs (Table S7), and the significance was selected for forest plotting from the top 15 (Figure 5a). With the median expression of prognosis‐related genes in all samples considered, the samples were grouped into high and low expression cohorts, and survival conditions were analysed using R package “survival”. Among them, 13 genes were differentially expressed with statistically significant differences in OS, and the Kaplan‐Meier curves were shown (Figure 5b–e and Figure S1).
FIGURE 5.
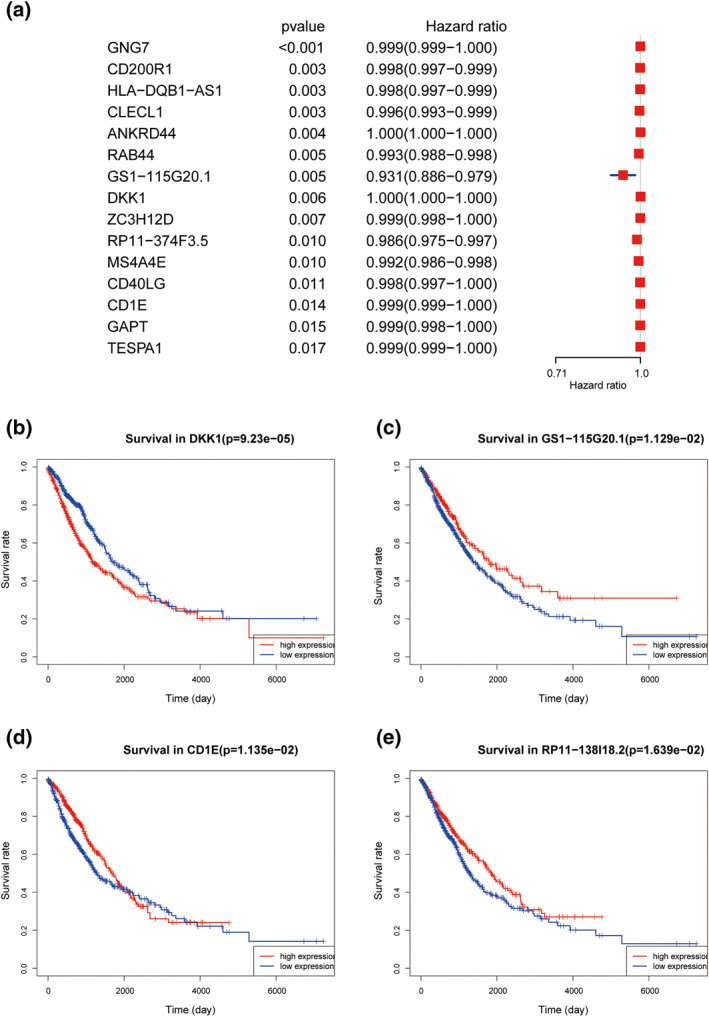
Univariate regression analysis for screening prognostic genes. (a) Top 15 prognostic relevant genes in blue, light green and red modules of significance. (b, c, d, e): prognostic relevant genes were assigned into high and low expression groups based on median expression level, and the final Kaplan‐Meier curves of four genes with p < 0.05 were demonstrated. Kaplan‐Meier curves of the GS1‐115G20.1 curve (c) divergence is obvious. CD1E curve (d) has a significant crossover and therefore is not significant
3.5. Risk prognostic model of mRNA
The 57 prognosis‐related mRNAs obtained by univariate regression analysis were put into a Lasso regression model, and 12 mRNAs were selected according to the parameter Lambda value, with Lambda.min. The minimum value was used as the threshold (Figures S2a–b), and then the Cox penalty regression model was used to reduce the dimension and finally screened a linear risk score model consisting of 5 mRNA genes associated with survival: risk score 1 = = (−4.27e‐3*RAB44) + (−5.11e‐4*GNG7)+ (1.61e‐4*RASA3) + (−1.26e‐3*CD200R1) + (3.69e‐5*DKK1).
All samples were assigned a score and defined as high‐ and low risk based on the median risk score 1 value as the cutoff. Figure 6a shows the expression of 5 prognosis‐related mRNAs in two cohorts. Figure 6b shows the survival time in two groups, and Figure 6c shows the heat map which reflects the expression of the 5 genes in the risk model in different risk score 1, diagnoses, and genders. The Kaplan‐Meier curve shows the lower OS of the high‐risk patients compared with the low‐risk group (Figure 6d); meanwhile, the area under the ROC curve (AUC) for the survival rate at 3 years was 0.622, indicating the favourable predictive ability of the risk model (Figure 6e).
FIGURE 6.
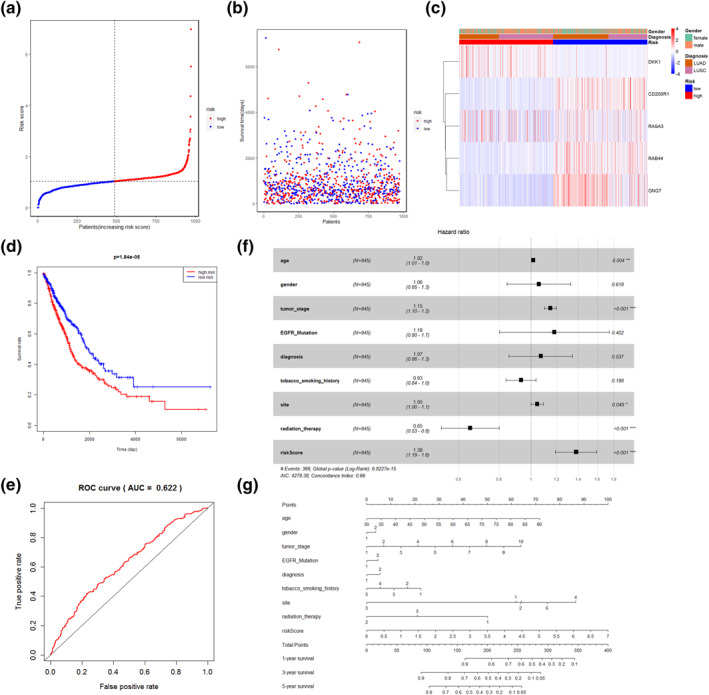
Construction of the mRNA risk prognostic model. (a, b): Distribution of samples in high‐ and low‐risk groups using median risk score one, with vertical coordinates of risk score one is shown. (c) Heat map shows the expression of five mRNA genes in the risk model in different risk score 1, different diagnoses, and different genders. (d) Kaplan‐Meier curves for survival time of patients with high‐ and low risk. (e) ROC curves for predicting 3 year survival. (f) The forest plots of multivariate Cox regression. Black squares on the horizontal line indicate the hazard ratio and the horizontal lines show the 95% confidence interval. (g) Nomogram for predicting survival in NSCLC
Risk score 1 was combined with the age, gender, tumour stage, presence of EGFR mutation, type of diagnosed disease, smoking history, tumour location, and clinical factors of radiation therapy in a multivariate Cox regression model. Age, tumour stage, radiation therapy and risk score 1 were determined as independent predictive factors for OS, while risk score 1 possessed a stronger impact on survival (Figure 6f). In order to facilitate the utilisation of risk score 1, a nomogram was plotted (Figure 6g). The results of the external validation showed that the area under the ROC curve for 3 year survival had an AUC of 0.595 and this model had acceptable predictive power (Figure S3).
3.6. Risk prognostic model of lncRNA
The 20 lncRNAs with prognostic related genes obtained by univariate regression analysis were first analysed by Lasso regression analysis (Figures S2c–d), and 10 lncRNAs were selected by the threshold parameter, Lambda.min (Figure 7a), which constitutes a linear risk assessment model associated with survival. The lncRNA risk score model is risk score 2 = = (−3.86e‐4*LINC00402) + (−7.83e‐3*AC007880.1) + (−1.74e‐3*LINC01352) + (−7.58e‐4*RP11‐354E11.2) + (−3.28e‐3*RP11‐374F3.5)+ (−6.46e‐4*AC018647.3) + (−5.75e‐4*HLA‐DQB1‐AS1)+(−3.45e‐2*GS1‐115G20.1) + (−4.34e‐3*SMCR5) + (−2.00e‐3*RP11‐357N13.6).
FIGURE 7.
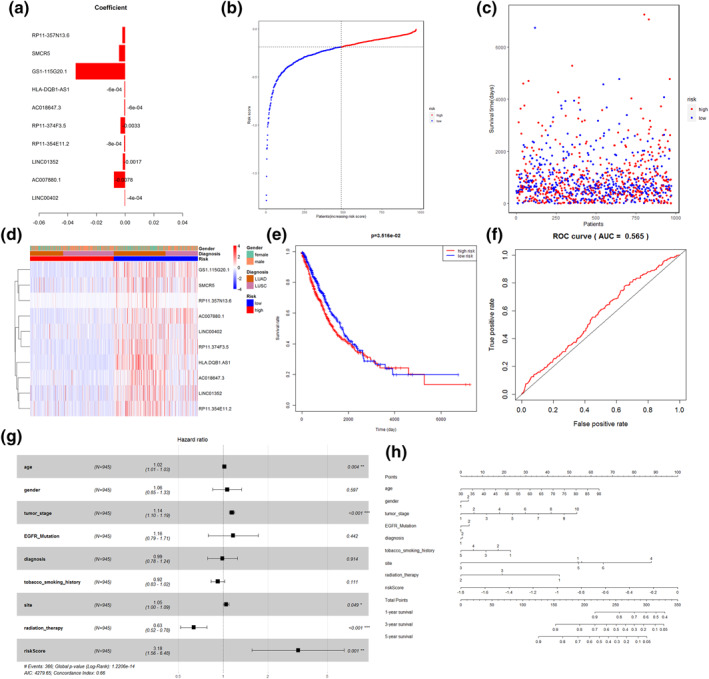
Construction of the lncRNA risk‐prognosis model. (a) 10 lncRNAs associated with prognosis and co‐efficiency values. (b, c): Distribution of samples into high‐ and low‐risk groups with median risk score 2 and vertical coordinates of Risk Score two is shown. (d) The risk model with 10 lncRNA genes expressed in different risk score two, different diagnoses, and different genders is shown in a heat map. (e) Survival curves of the high‐risk and low‐risk groups. (f) ROC curves for predicting 3 year survival. (g) The forest plots of multivariate Cox regression. Black squares on the horizontal line indicate the hazard ratio and the horizontal lines show the 95% confidence interval. (h) Nomogram for predicting survival in NSCLC
Similarly, all samples were assigned into high‐ and low‐risk cohorts (cutoff: risk score 2). Figure 7b demonstrates the change in risk values; Figure 7c demonstrates the survival difference; Figure 7d carries out the expression of 10 genes in the two cohorts, the diagnostic outcome, and the gender subgroup. Survival curves (Figure 7e) indicated that the OS rate of patients with high‐risk was lower; meanwhile, the AUC value was 0.565, suggesting that the model had certain predictive accuracy in the prognosis of NSCLC patients (Figure 7f).
Risk score 2 was combined with the age, gender, tumour stage, presence of EGFR mutation, types of diagnosed disease, smoking history, tumour location, and clinical factors of radiation therapy in a multivariate Cox regression analysis. Age, tumour stage, radiation therapy and risk score two were observed to be the predictive factors for OS in an independent manner, while the prognostic performance of risk score two was much greater (Figure 7g). Similarly, the nomogram was plotted (Figure 7h).
3.7. Crucial prognosis‐related mRNA gene DKK1 is an independent prognostic factor and correlated with the expression of TP53, MTOR, VEGF
The mRNA genes included in the risk score 1 were analysed. There were five mRNA genes in the mRNA‐based risk prognostic model, and only one gene, DKK1, was carried out with survival significance between high and low expression groups (Figure 5b). DKK1, therefore, was selected for the study and then observed to present increased expression in the TP53 mutation group compared with the wild group with a statistically significant difference (Figure 8a). The AUC value was 0.607 using high and low DKK1 expressions to predict survival at 3 years of NSCLC cases (Figure 8b). With clinical information considered, multivariate analysis by Cox regression identified DKK1 as an independent prognostic factor (Figure 8c). Additionally, GSEA analysis found that the differential genes in the high and the low DKK1 expression groups were related to the expression of mTOR, VEGF and TP53 (Figure 8d).
FIGURE 8.
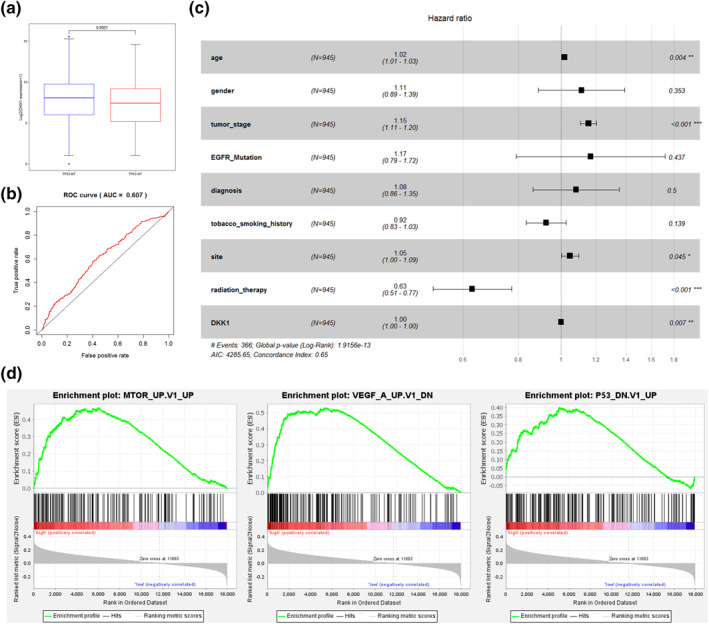
DKK1 is an independent prognostic factor. (a) DKK1 was highly expressed in the TP53 mutant group and low in the TP53 wild group. (b) ROC curves of high and low DKK1 expression predicting 3 year survival in NSCLC patients. (c) Multivariate Cox regression analysis with DKK1 as an independent prognostic factor. (d) GSEA identified enrichment of DKK1 low expression phenotype of the gene set
With regard to the regulation network of mRNA‐TFs, 911 DEGs were of decreased expression and 574 DEGs were of increased expression (Table S8). The DEGs which were enriched in these TFs were: CHX10, S8, E47, LHX3, CREL, AP1 and HNF3B. The top 18 TFs associated mRNAs with greater |log2(FC)| were selected for the regulatory network mapping (Figure 9).
FIGURE 9.
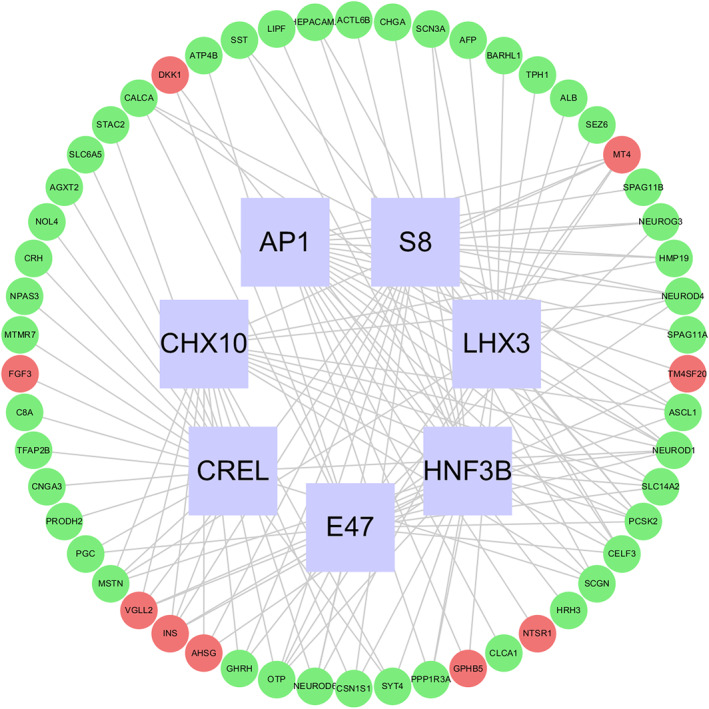
The transcript factors regulatory network for DEmRNAs between high and low DKK1 expression groups. The red genes are up‐regulated, the green genes are down‐regulated, and the blue boxes indicate the enriched transcript factors
3.8. Crucial prognosis‐related lncRNA GS1‐115G20.1 is an independent prognostic factor, associated with the expression of C1ORF21, multiple target miRNAs, and DKK1
The lncRNA genes in the risk score 2 were analysed, and the patients were assigned into high and low expression groups on the basis of median lncRNA expression values. GS1‐115G20.1 was identified to be of survival significance at a higher degree (Figure 5c); GS1‐115G20.1, therefore, was selected for the study. TP53 mutation group witnessed a downward trend of GS1‐115G20.1 expression compared with the wild group characterised by a statistically significant difference (Figure 10a). The expression level of GS1‐115G20.1 was used to predict the 3 year survival rate of NSCLC cases with AUC = 0.560 (Figure 10b). Combined with the clinical information, multivariate Cox regression analysis showed that GS1‐115G20.1 was a prognostic factor independent of other variables (Figure 10c).
FIGURE 10.
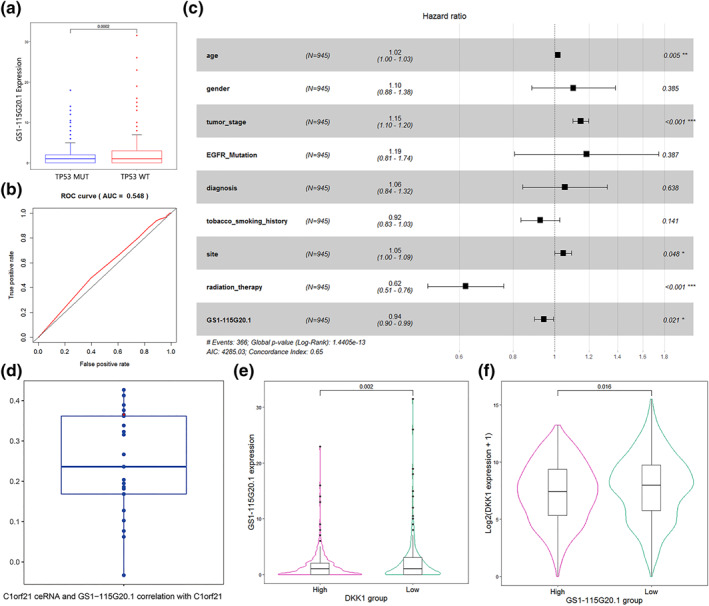
GS1‐115G20.1 is an independent prognostic factor. (a) Low expression of GS1‐115G20.1 in the TP53 mutant group and high expression of GS1‐115G20.1 in the TP53 wild group. (b) ROC curves of high and low GS1‐115G20.1 expression to predict 3 year survival in NSCLC patients. (c) Results of multivariate Cox regression analysis with GS1‐115G20.1 as an independent prognostic factor. (d) Correlation analysis of ceRNAs of C1ORF1, GS1‐115G20.1 and C1ORF21 expression. The red point in the graph is GS1‐115G20.1 (p = 2.2e‐16). (e) Expression changes of GS1‐115G20.1 at different DKK1 expression levels. (f) Expression changes of DKK1 at different GS1‐115G20.1 expression levels
The correlation analysis by C1ORF21, GS1‐115G20.1 and ceRNAs of C1ORF21 expression showed that the correlation coefficients were between −0.033 and 0.423 (Figure 10d), and the correlation coefficient between GS1‐115G20.1 and C1ORF21 was 0.365, p = 2.2E‐16, which is much higher in LUAD, r = 0.468. The “custom prediction” function of miRDB database was used to predict miRNA targets of lncRNA GS1‐115G20.1, and there were 27 miRNAs that might interact with GS1‐115G20.1 (Table S9). In addition, we also found low GS1‐115G20.1 expression in the high DKK1 expression group (Figure 10e,f). However, we did not find any evidence of their direct interaction in public databases.
4. DISCUSSION
It has been proven that RYR mutations are frequently found in most cancer genomic studies with somatic mutations [6]. Nevertheless, the role and mechanism of RYR2 mutations in NSCLC pathogenesis and progression have not been confirmed. It is important to further clarify the potential genes related to the prognosis of NSCLC with RYR2 mutation. Extracting transcriptomic data from the UCSC Xena dataset can help identify prognostic factors that may be involved in cancer development or evolution. In this study, we used genomic and transcriptomic data of LUAD and LUSC from the UCSC Xena database to identify lncRNAs and mRNAs, which are differentially expressed in RYR2 mutant and RYR2 wild‐type NSCLC. By survival analysis, we found that patients in the RYR2 mutant group have better survival, and the somatic mutation of RYR2 may be protective.
To further investigate the molecular mechanism by which RYR2 mutation improves the prognosis of NSCLC patients, we constructed co‐expression networks for DEmRNAs and DElncRNAs, selected modules related to NSCLC prognosis for analysis, and constructed risk prognosis models for the prognosis‐related mRNA and lncRNA genes. The important DEmRNA genes included were RAB44, GNG7, RASA3, CD200R1 and DKK1. KEGG enrichment analysis showed that the DEmRNA gene was mainly related to neuroactive ligand‐receptor interaction, complement and coagulation cascades, cAMP signalling pathway, adrenergic signalling in cardiomyocytes, cell cycle and other pathways. Among them, the cell cycle and cAMP signalling pathway are pivotal in tumour development in the study of NSCLC [33, 34]. Meanwhile, based on the above results, we constructed the mRNA risk prognostic model with reliable results for both internal and external validation. Although the transcriptome‐based prognostic model has not yet reached a very satisfactory level for the prediction of survival in NSCLC patients, the attempt still has far‐reaching implications.
As the crucial DEmRNA gene in this study, the Dickkopf Wnt signalling pathway inhibitor‐1 (DKK1) is a well‐established classical Wnt signalling inhibitor [35], which is essential in the proliferation and migration of multiple tumour cell types [36]. Overexpressed DKK1 promotes bony metastasis of breast cancer while inhibiting its lung metastasis, and even in the same tumours, an organ‐specific role of DKK1 has been noted [37]. Several studies have indicated associations of DKK1 overexpression with cancer malignant progression and adverse prognosis in a raft of human cancers, suggesting a potential oncogenic function of DKK1 [38, 39, 40, 41]. Yamabuki et al. showed that high DKK1 expression indicates adverse outcomes of NSCLC patients, and its exogenous expression improves migration and invasion of cells [40]. Notably, significant correlations between elevated serum DKK1 protein concentrations and tumour progression as well as lowered survival were identified in lung cancer patients [42]. In the results of this study, high DKK1 mRNA expression in the RYR2 wild type suggested a worse prognosis for lung cancer by analysing the UCSC xena database. In the present study, E47, CREL and AP1 were important cancer‐related TFs enriched to DKK1 high‐ and low‐expressing DEmRNAs [43, 44, 45].
Recent advances have suggested that non‐coding genes may also be new participants in the cancer paradigm [19]. In this study, a predictive model of lncRNAs was constructed, and in these lncRNAs, GS1‐115G20.1 may play a role in the development of NSCLC. GS1‐115G20.1 (also called ENSG00000230470.1; OTTHUMG00000035468.1; AL078645.1) is located on chromosome CHR1:184408336‐184412360 (Grch38), which is exactly located on the protein‐coding gene C1ORF21 (chr1:184387057‐184629020) that encodes this protein gene [46]. The general regulatory effect of lncRNAs on adjacent mRNAs, coupled with expression correlation, leads to the speculation that GS1‐115G20.1 regulates the expression of C1ORF21, but the correlation is not strong. We found that the lncRNA’s high expression in NSCLC indicated better survival and may play a protective function in NSCLC.
Due to the lack of experimental studies for GS1‐115G20.1, we could only use predictive databases. As a result, several target miRNAs that may interact with GS1‐11520.1 were identified (Table S8). hsa‐miR‐608 has been confirmed to play a significant part in the apoptosis of NSCLC cells via the regulation of migration inhibitor factor (MIF), Akt serine/threonine kinase 2 (AKT2) and transcription factor activation enhancer binding protein 4 (TFAP4) [47, 48, 49, 50]; Dong et al. found that hsa‐miR‐105‐5p could be a biomarker for early diagnosis of NSCLC [51]; Zheng and other researchers found that hsa‐miR‐4651 elicited a negative effect on the progression of NSCLC via targeting bromodomain‐containing protein 4 (BRD4) [52]; from a study by Wang's group, lncRNA LIFR‐AS1 could inhibit NSCLC cell invasion and migration by serving as a sponge for hsa‐miR‐942‐5p [53]; in patients suffering from anaplastic lymphoma kinase (ALK)‐positive NSCLC, decreased hsa‐miR‐362‐5p was accompanied by longer progression‐free survival [54]. Therefore, we speculate that GS1‐115G20.1 may interact with the above miRNAs to have an influence on the phenotype, treatment, and prognosis of NSCLC, but further validation of molecular experiments is still needed.
In conclusion, using survival analysis, we found that RYR2 mutations may have a protective effect on NSCLC. Through comprehensive bioinformatic analysis, two risk prognostic models of mRNA and lncRNA were established in this study, and prognostic risk models have some degree of predictive ability. The OS of high DKK1 expression group and low GS1‐115G20.1 expression group was worse. Overall, our findings may extend our understanding on the protective mechanisms of RYR2 mutations on the prognosis of NSCLC and identify new targets for prognostic assessment and treatment.
CONFLICT OF INTEREST
The authors declare no conflict of interests.
PATIENT CONSENT STATEMENT
Not applicable.
Supporting information
Supplementary Material 1
Supplementary Material 2
Supplementary Material 3
Supplementary Material 4
Supplementary Material 5
Supplementary Material 6
Supplementary Material 7
Supplementary Material 8
Supplementary Material 9
Supplementary Material 10
Supplementary Material 11
Supplementary Material 12
ACKNOWLEDGEMENTS
We gratefully acknowledge the contributions of the TCGA Research Network (https://www.cancer.gov/tcga), UCSC Xena platform (https://xenabrowser.net/), KEGG (Kyoto Encyclopedia of Genes and Genomes), GO (Gene Ontology), DAVID (https://david.ncifcrf.gov/home.jsp), StarBase v2.0 (http://starbase.sysu.edu.cn/starbase2/) and miRDB (http://mirdb.org/). This study was sponsored by these projects: the Applied Basic Research Project of Yunnan Provincial Science and Technology Department and Kunming Medical University (grant No. 2020001AY070001‐117, 202001AY070001‐130 and 202001AY070001‐284); the Open Project of The First People's Hospital of Yunnan Province Clinical Medicine Center (2021LCZXXF‐XZ03).
Ren, W. , et al.: RYR2 mutation in non‐small cell lung cancer prolongs survival via down‐regulation of DKK1 and up‐regulation of GS1‐115G20.1: a weighted gene Co‐expression network analysis and risk prognostic models. IET Syst. Biol. 16(2), 43–58 (2022). 10.1049/syb2.12038
Wenjun Ren and Yongwu Li contributed equally.
DATA AVAILABILITY STATEMENT
All data, models, or codes that are generated in this study could be available upon reasonable request to the corresponding author.
REFERENCES
- 1. Bray, F. , et al.: Global cancer statistics 2018: GLOBOCAN estimates of incidence and mortality worldwide for 36 cancers in 185 countries. CA Cancer J. Clin. 68(6), 394–424 (2018) [DOI] [PubMed] [Google Scholar]
- 2. Yang, C.Y. , Yang, J.C. , Yang, P.C. : Precision management of advanced Non‐Small cell lung cancer. Annu. Rev. Med. 71, 117–136 (2020) [DOI] [PubMed] [Google Scholar]
- 3. Howlader, N. , et al.: SEER cancer statistics review, 1975–2016. Accessed 26 May (2019). https://seer.cancer.gov/csr/1975_2016/2019 [Google Scholar]
- 4. Inamura, K. : Adjuvant chemotherapy in patients with early‐stage non‐small cell lung cancer. JAMA Oncol. 4(7), 637–638 (2021) [DOI] [PubMed] [Google Scholar]
- 5. Zhang, X. , Chang, A. : Somatic mutations of the epidermal growth factor receptor and non‐small‐cell lung cancer. J. Med. Genet. 44(3), 166–172 (2007) [DOI] [PMC free article] [PubMed] [Google Scholar]
- 6. Schmitt, K. , et al.: Somatic mutations and promotor methylation of the ryanodine receptor 2 is a common event in the patho genesis of head and neck cancer. Int. J. Cancer. 145(12), 3299–3310 (2019) [DOI] [PubMed] [Google Scholar]
- 7. Shi, J. , et al.: Pathological and prognostic indications of the mdig gene in human lung cancer. Cell Physiol. Biochem. 55(S2), 13–28 (2021) [DOI] [PMC free article] [PubMed] [Google Scholar]
- 8. Yu, P. , et al.: High expression of the SH3TC2‐DT/SH3TC2 gene pair associated with FLT3 mutation and poor survival in acute myeloid leukemia: an integrated TCGA analysis. Front. Oncol. 10, 829 (2020) [DOI] [PMC free article] [PubMed] [Google Scholar]
- 9. Van Petegem, F. : Ryanodine receptors: structure and function. J. Biol. Chem. 287(38), 31624–31632 (2012) [DOI] [PMC free article] [PubMed] [Google Scholar]
- 10. Betzenhauser, M.J. , Marks, A.R. : Ryanodine receptor channelopathies. Pflugers Arch. 460(2), 467–480 (2010) [DOI] [PMC free article] [PubMed] [Google Scholar]
- 11. Thomas, N.L. , et al.: Ryanodine receptor mutations in arrhythmia: the continuing mystery of channel dysfunction. FEBS Lett. 584(10), 2153–2160 (2010) [DOI] [PubMed] [Google Scholar]
- 12. Liu, Z. , et al.: Association of RYR2 mutation with tumor mutation burden, prognosis, and antitumor immunity in patients with esophageal adenocarcinoma. Front. Genet. 12, 669694 (2021) [DOI] [PMC free article] [PubMed] [Google Scholar]
- 13. Wei, Y. , et al.: Impact of NR5A2 and RYR2 3'UTR polymorphisms on the risk of breast cancer in a Chinese Han population. Breast Cancer Res. Treat. 183(1), 1–8 (2020) [DOI] [PubMed] [Google Scholar]
- 14. Esteller, M. : Non‐coding RNAs in human disease. Nat. Rev. Genet. 12(12), 861–874 (2011) [DOI] [PubMed] [Google Scholar]
- 15. Guttman, M. , et al.: Ribosome profiling provides evidence that large noncoding RNAs do not encode proteins. Cell. 154(1), 240–251 (2013) [DOI] [PMC free article] [PubMed] [Google Scholar]
- 16. Zhang, X. , et al.: The role of long noncoding RNA in major human disease. Bioorg Chem. 92, 103214 (2019) [DOI] [PubMed] [Google Scholar]
- 17. Huarte, M. : The emerging role of lncRNAs in cancer. Nat. Med. 21(11), 1253–1261 (2015) [DOI] [PubMed] [Google Scholar]
- 18. Yang, X. , et al.: High expression of lncRNA GACAT3 inhibits invasion and metastasis of non‐small cell lung cancer to en hance the effect of radiotherapy. Eur. Rev. Med. Pharmacol. Sci. 22(5), 1315–1322 (2018) [DOI] [PubMed] [Google Scholar]
- 19. Shi, X. , et al.: A critical role for the long non‐coding RNA GAS5 in proliferation and apoptosis in non‐small‐cell lun g cancer. Mol. Carcinog. 54(Suppl 1), E1–E12 (2015) [DOI] [PubMed] [Google Scholar]
- 20. Koboldt, D.C. , et al.: VarScan 2: somatic mutation and copy number alteration discovery in cancer by exome sequencing. Genome Res. 22(3), 568–576 (2012) [DOI] [PMC free article] [PubMed] [Google Scholar]
- 21. Robinson, M.D. , McCarthy, D.J. , Smyth, G.K. : edgeR: a Bioconductor package for differential expression analysis of digital gene expression data. Bioinformatics. 26(1), 139–140 (2010) [DOI] [PMC free article] [PubMed] [Google Scholar]
- 22. McCarthy, D.J. , Chen, Y. , Smyth, G.K. : Differential expression analysis of multifactor RNA‐Seq experiments with respect to biological variat ion. Nucleic Acids Res. 40(10), 4288–4297 (2012) [DOI] [PMC free article] [PubMed] [Google Scholar]
- 23. GOC : The gene ontology resource: 20 years and still GOing strong. Nucleic Acids Res. 47(D1), D330–D338 (2019) [DOI] [PMC free article] [PubMed] [Google Scholar]
- 24. Kanehisa, M. , et al.: KEGG: new perspectives on genomes, pathways, diseases and drugs. Nucleic Acids Res. 45(D1), D353–D361 (2017) [DOI] [PMC free article] [PubMed] [Google Scholar]
- 25. Iancu, O.D. , et al.: Cosplicing network analysis of mammalian brain RNA‐Seq data utilising WGCNA and Mantel correlations. Front. Genet. 6, 174 (2015) [DOI] [PMC free article] [PubMed] [Google Scholar]
- 26. Langfelder, P. , Horvath, S. : WGCNA: an R package for weighted correlation network analysis. BMC Bioinforma. 9, 559 (2008) [DOI] [PMC free article] [PubMed] [Google Scholar]
- 27. Fuller, T.F. , et al.: Weighted gene coexpression network analysis strategies applied to mouse weight. Mamm. Genome. 18(6–7), 463–472 (2007) [DOI] [PMC free article] [PubMed] [Google Scholar]
- 28. Chen, J. , et al.: Genomic landscape of lung adenocarcinoma in East Asians. Nat. Genet. 52(2), 177–186 (2020) [DOI] [PubMed] [Google Scholar]
- 29. Subramanian, A. , et al.: Gene set enrichment analysis: a knowledge‐based approach for interpreting genome‐wide expression profiles. Proc. Natl. Acad. Sci. U. S. A. 102(43), 15545–15550 (2005) [DOI] [PMC free article] [PubMed] [Google Scholar]
- 30. Huang, D.W. , et al.: DAVID Bioinformatics Resources: expanded annotation database and novel algorithms to better extract biology from large gene lists. Nucleic Acids Res. 35(2), W169–W175 (2007) [DOI] [PMC free article] [PubMed] [Google Scholar]
- 31. Li, J.H. , et al.: StarBase v2.0: decoding miRNA‐ceRNA, miRNA‐ncRNA and protein‐RNA interaction networks from large‐scal e CLIP‐Seq data. Nucleic Acids Res. 42, D92–D97 (2014) [DOI] [PMC free article] [PubMed] [Google Scholar]
- 32. Chen, Y. , Wang, X. : miRDB: an online database for prediction of functional microRNA targets. Nucleic Acids Res. 48(D1), D127–D131 (2020) [DOI] [PMC free article] [PubMed] [Google Scholar]
- 33. Chen, Z. , et al.: CAMP/CREB‐regulated LINC00473 marks LKB1‐inactivated lung cancer and mediates tumor growth. J. Clin. Invest. 126(6), 2267–2279 (2016) [DOI] [PMC free article] [PubMed] [Google Scholar]
- 34. Concato, V.M. , et al.: 3,3',5,5'‐tetramethoxybiphenyl‐4,4'diol induces cell cycle arrest in G2/M phase and apoptosis in huma n non‐small cell lung cancer A549?cells. Chem. Biol. Interact. 326, 109133 (2020) [DOI] [PubMed] [Google Scholar]
- 35. Bafico, A. , et al.: Novel mechanism of Wnt signalling inhibition mediated by Dickkopf‐1 interaction with LRP6/Arrow. Nat. Cell Biol. 3(7), 683–686 (2001) [DOI] [PubMed] [Google Scholar]
- 36. Liu, Y. , et al.: Prognostic significance of dickkopf‐1 overexpression in solid tumors: a meta‐analysis. Tumour Biol. 35(4), 3145–3154 (2014) [DOI] [PubMed] [Google Scholar]
- 37. Zhuang, X. , et al.: Differential effects on lung and bone metastasis of breast cancer by Wnt signalling inhibitor DKK1. Nat. Cell Biol. 19(10), 1274–1285 (2017) [DOI] [PubMed] [Google Scholar]
- 38. Forget, M. , et al.: The Wnt pathway regulator DKK1 is preferentially expressed in hormone‐resistant breast tumours and in some common cancer types. Br. J. Cancer. 96(4), 646–653 (2007) [DOI] [PMC free article] [PubMed] [Google Scholar]
- 39. Takahashi, N. , et al.: Dickkopf‐1 is overexpressed in human pancreatic ductal adenocarcinoma cells and is involved in invasive growth. Int. J. Cancer. 126(7), 1611–1620 (2009) [DOI] [PubMed] [Google Scholar]
- 40. Yamabuki, T. , et al.: Dikkopf‐1 as a novel serologic and prognostic biomarker for lung and esophageal carcinomas. Cancer Res. 67(6), 2517–2525 (2007) [DOI] [PubMed] [Google Scholar]
- 41. Yu, B. , et al.: Elevated expression of DKK1 is associated with cytoplasmic/nuclear β‐catenin accumulation and poor prognosis in hepatocellular carcinomas. J. Hepatol. 50(5), 948–957 (2009) [DOI] [PubMed] [Google Scholar]
- 42. Sheng, S.L.E. , et al.: Clinical significance and prognostic value of serum dickkopf‐1 concentrations in patients with lung cancer. Clin. Chem. 55(9), 1656–1664 (2009) [DOI] [PubMed] [Google Scholar]
- 43. Hunter, J.E. , Leslie, J. , Perkins, N.D. : C‐Rel and its many roles in cancer: an old story with new twists. Br. J. Cancer. 114(1), 1–6 (2016) [DOI] [PMC free article] [PubMed] [Google Scholar]
- 44. Ibrahim, S.A.E. , et al.: The role of AP‐1 in self‐sufficient proliferation and migration of cancer cells and its potential impact on an autocrine/paracrine loop. Oncotarget. 9(76), 34259–34278 (2018) [DOI] [PMC free article] [PubMed] [Google Scholar]
- 45. Zhu, G. , et al.: PAK5‐mediated E47 phosphorylation promotes epithelial–mesenchymal transition and metastasis of colon cancer. Oncogene. 35(15), 1943–1954 (2016) [DOI] [PubMed] [Google Scholar]
- 46. Ronchetti, D. , et al.: A compendium of long non‐coding RNAs transcriptional fingerprint in multiple myeloma. Sci. Rep. 8(1), 6557 (2018) [DOI] [PMC free article] [PubMed] [Google Scholar]
- 47. Othman, N. , Nagoor, N.H. : MiR‐608 regulates apoptosis in human lung adenocarcinoma via regulation of AKT2. Int. J. Oncol. 51(6), 1757–1764 (2017) [DOI] [PubMed] [Google Scholar]
- 48. Wang, Y. , et al.: MicroRNA‐608 promotes apoptosis in Non‐Small cell lung cancer cells treated with doxorubicin through the inhibition of TFAP4. Front. Genet. 10, 809 (2019) [DOI] [PMC free article] [PubMed] [Google Scholar]
- 49. Yu, H.X. , et al.: MiR‐608 exerts tumor suppressive function in lung adenocarcinoma by directly targeting MIF. Eur. Rev. Med. Pharmacol. Sci. 22(15), 4908–4916 (2018) [DOI] [PubMed] [Google Scholar]
- 50. Zhang, N. , et al.: MiR‐608 and miR‐4513 significantly contribute to the prognosis of lung adenocarcinoma treated with EGFR‐TKIs. Lab. Invest. 99(4), 568–576 (2019) [DOI] [PubMed] [Google Scholar]
- 51. Dong, X. , et al.: PlasmamiR‐1247‐5p,miR‐301b‐3p andmiR‐105‐5p as potential biomarkers for early diagnosis of non‐small cell lung cancer. Thorac. Cancer. 12(4), 539–548 (2021) [DOI] [PMC free article] [PubMed] [Google Scholar]
- 52. Zheng, J. , et al.: MicroRNA‐4651 targets bromodomain‐containing protein 4 to inhibit non‐small cell lung cancer cell progression. Cancer Lett. 476, 129–139 (2020) [DOI] [PubMed] [Google Scholar]
- 53. Wang, Q. , et al.: LncRNA LIFR‐AS1 suppresses invasion and metastasis of non‐small cell lung cancer via the miR‐942‐5p/ZNF471 axis. Cancer Cell Int. 20(1), 180 (2020) [DOI] [PMC free article] [PubMed] [Google Scholar]
- 54. Li, L. , et al.: Circulating microRNAs as novel biomarkers of ALK‐positive non‐small cell lung cancer and predictors of response to crizotinib therapy. Oncotarget. 8(28), 45399–45414 (2017) [DOI] [PMC free article] [PubMed] [Google Scholar]
Associated Data
This section collects any data citations, data availability statements, or supplementary materials included in this article.
Supplementary Materials
Supplementary Material 1
Supplementary Material 2
Supplementary Material 3
Supplementary Material 4
Supplementary Material 5
Supplementary Material 6
Supplementary Material 7
Supplementary Material 8
Supplementary Material 9
Supplementary Material 10
Supplementary Material 11
Supplementary Material 12
Data Availability Statement
All data, models, or codes that are generated in this study could be available upon reasonable request to the corresponding author.


