Abstract
Purpose
To evaluate dynamic gallium 68 (68Ga) tetraazacyclododecane tetraacetic acid octreotate (DOTATATE) brain PET/MRI as an adjunct modality in meningioma, enabling multiparametric standardized uptake value (SUV) and Patlak net binding rate constant (Ki) imaging, and to optimize static acquisition period.
Materials and Methods
In this prospective study (ClinicalTrials.gov no. NCT04081701, DOMINO-START), 68Ga-DOTATATE PET/MRI–derived time-activity curves (TACs) were measured in 84 volumes of interest in 19 participants (mean age, 63 years; range, 36–89 years; 13 women; 2019–2021) with meningiomas. Region- and voxel-specific Ki were determined using Patlak analysis with a validated population-based reference tissue TAC model built from an independent data set of nine participants. Mean and maximum absolute and relative-to-superior-sagittal-sinus SUVs were extracted from the entire 50 minutes (SUV50) and last 10 minutes (SUV10) of acquisition. SUV versus Ki Spearman correlation, SUV and Ki meningioma versus posttreatment-change Mann-Whitney U tests, and SUV50 versus SUV10 Wilcoxon matched-pairs signed rank tests were performed.
Results
Absolute and relative maximum SUV50 demonstrated a strong positive correlation with Patlak Ki in meningioma (r = 0.82, P < .001 and r = 0.85, P < .001, respectively) and posttreatment-change lesions (r = 0.88, P = .007 and r = 0.83, P = .02, respectively). Patlak Ki images yielded higher lesion contrast by mitigating nonspecific background signal. All SUV50 and SUV10 metrics differed between meningioma and posttreatment-change regions (P < .001). Within the meningioma group, SUV10 attained higher mean scores than SUV50 (P < .001).
Conclusion
Combined SUV and Patlak K i 68Ga-DOTATATE PET/MRI enabled multiparametric evaluation of meningioma, offering the potential to enhance lesion contrast with Ki imaging and optimize the SUV measurement postinjection window.
Keywords: Molecular Imaging–Clinical Translation, Neuro-Oncology, PET/MRI, Dynamic, Patlak
ClinicalTrials.gov registration no. NCT04081701
© RSNA, 2022
Keywords: Molecular Imaging–Clinical Translation, Neuro-Oncology, PET/MRI, Dynamic, Patlak
Summary
Multiparametric standardized uptake value (SUV) and K i imaging with dynamic 68Ga-DOTATATE PET/MRI was feasible within MRI-only scan durations, offering highly quantitative evaluations and enhanced lesion contrast, compared with SUV alone, for assessing meningiomas against posttreatment change.
Key Points
■ Dynamic gallium 68 (68Ga) tetraazacyclododecane tetraacetic acid octreotate (DOTATATE) PET/MRI–generated standardized uptake value (SUV) and Patlak-derived Ki scores demonstrated strong, positive correlation but with Ki images visually exhibiting higher meningioma lesion contrast relative to SUV through elimination of nonspecific background signal.
■ Analysis of dynamic 68Ga-DOTATATE PET data from 10–60 minutes after injection suggested enhanced meningioma SUV scores (P < .001) when SUV was measured at 50–60 minutes after injection (SUV10) compared to 10–60 minutes after injection (SUV50); however, both SUV metrics exhibited well-differentiated scores (P < .001 for both) between meningioma and posttreatment change regions.
Introduction
Meningiomas are the most common primary intracranial tumors, accounting for nearly 40% of all primary brain tumors (1). Approximately 80% of cases are benign (World Health Organization [WHO] grade I) and carry a favorable prognosis; however, grade II and III meningiomas are associated with increased rates of recurrence and associated 5-year survival rates of 78% and 44%, respectively (2). Contrast-enhanced MRI is the reference standard method for treatment planning and postoperative evaluation of meningiomas; however, MRI has its limitations in helping discern recurrent or residual disease from postoperative findings (3), requiring serial MRI follow-up, which may delay the diagnosis, with an associated potential increase in morbidity and mortality. Furthermore, MRI can have limited accuracy in cases of infiltrative or “en plaque” lesions, as well as in the setting of osseous or brain parenchymal invasion or for extension into skull-base foramina.
Meningiomas express high levels of somatostatin receptor 2 (SSTR2) (3). Given the lack of physiologic intracranial SSTR2 expression (with the exception of the pituitary gland), SSTR2 represents an attractive target for molecular imaging of meningiomas (3). PET imaging with SSTR ligands has improved the detection and delineation of meningiomas, particularly for radiation treatment planning (4,5). Gallium 68 (68Ga) tetraazacyclododecane tetraacetic acid octreotate (DOTATATE) binds to SSTR2 with high specificity (6,7) and has demonstrated clinical utility in the differentiation of meningioma and posttreatment change (8), as well as in the detection of osseous invasion (9,10).
In the current clinical setting, PET acquisition is typically performed in static mode by averaging the acquired signal over a single time frame to produce a time snapshot of the radiotracer concentration. While helpful in clinical practice, this method neglects factors affecting the variability of the radiotracer-target interaction across examinations, such as the uptake period, the pharmacokinetics of the tracer, and the availability of the radiotracer in the blood plasma or a region of reference tissue, known as input function and reference tissue time-activity curve (refTTAC), respectively (11–14).
Dynamic PET allows for evaluation of the radiotracer kinetics over time after injection, while also accounting for the blood input function or refTTAC (11,13) to allow the extraction of radiotracer uptake features independent of many scan parameters varying between examinations, thus enabling more reliable tumor characterization and treatment response monitoring (11,15–17). The Patlak reference region graphical analysis method encompasses robust linear models to characterize irreversible or mildly reversible radiotracer binding kinetics using an image-derived refTTAC, serving as background negative reference to the targeted tissue time-activity curve (TAC), thereby obviating invasive arterial blood sampling (18). The quantitative parameters of radiotracer net utilization (ie, net binding or net internalization) rate constant, Ki, in units of milliliters of reference tissue/min/grams of tissue and sum of radiotracer blood volume fraction and distribution volume, Vb, in units of milliliters of reference tissue/grams of tissue, can be determined by plotting for every targeted tissue its measured TAC and the common refTTAC according to the Patlak model assumptions (18). Subsequently, the plotted measurement data are fitted to the linear Patlak model, allowing derivation of the tissue-specific Ki and Vb kinetic parameters (18). Voxelwise analysis allows the generation of Ki and Vb parametric images. Overall, Patlak PET parametric imaging may increase lesion detectability (reduced false-positive rates) when complementing standard-of-care standardized uptake value (SUV) imaging (16,17).
Ki has been shown to more accurately reflect tumor SSTR density than SUV in neuroendocrine tumors (19), noting a nonlinear relationship between K i and SUV for high Ki values, attributed to faster blood clearance in patients with a high tumor receptor expression (19,20). Patlak imaging often requires longer scan times (approximately 50 minutes) compared with static SUV imaging to allow sufficient temporal tracking of the radiotracer kinetic features (21–23). This requirement is well suited to clinical PET/MRI protocols that typically require comparable acquisition periods (11). Previously the pharmacokinetic properties of 68Ga-DOTA-conjugate peptides have been evaluated on PET/CT meningioma studies at a regional level (24,25).
In this study, we investigated the clinical usefulness of dynamic 68Ga-DOTATATE acquisitions in simultaneous brain PET/MRI meningioma examinations. By complementing SUV with Patlak K i images, we evaluated any benefits in meningioma lesion contrast. Moreover, by accounting for the 68Ga-DOTATATE kinetics over a 50-minute postinjection PET acquisition period, we assessed any quantitative differences in meningioma SUV measured from the entire 50 minutes versus the last 10 minutes to optimize the SUV measurement time window, not only for PET/MRI, but potentially for PET/CT static protocols too.
Materials and Methods
Participant Sample
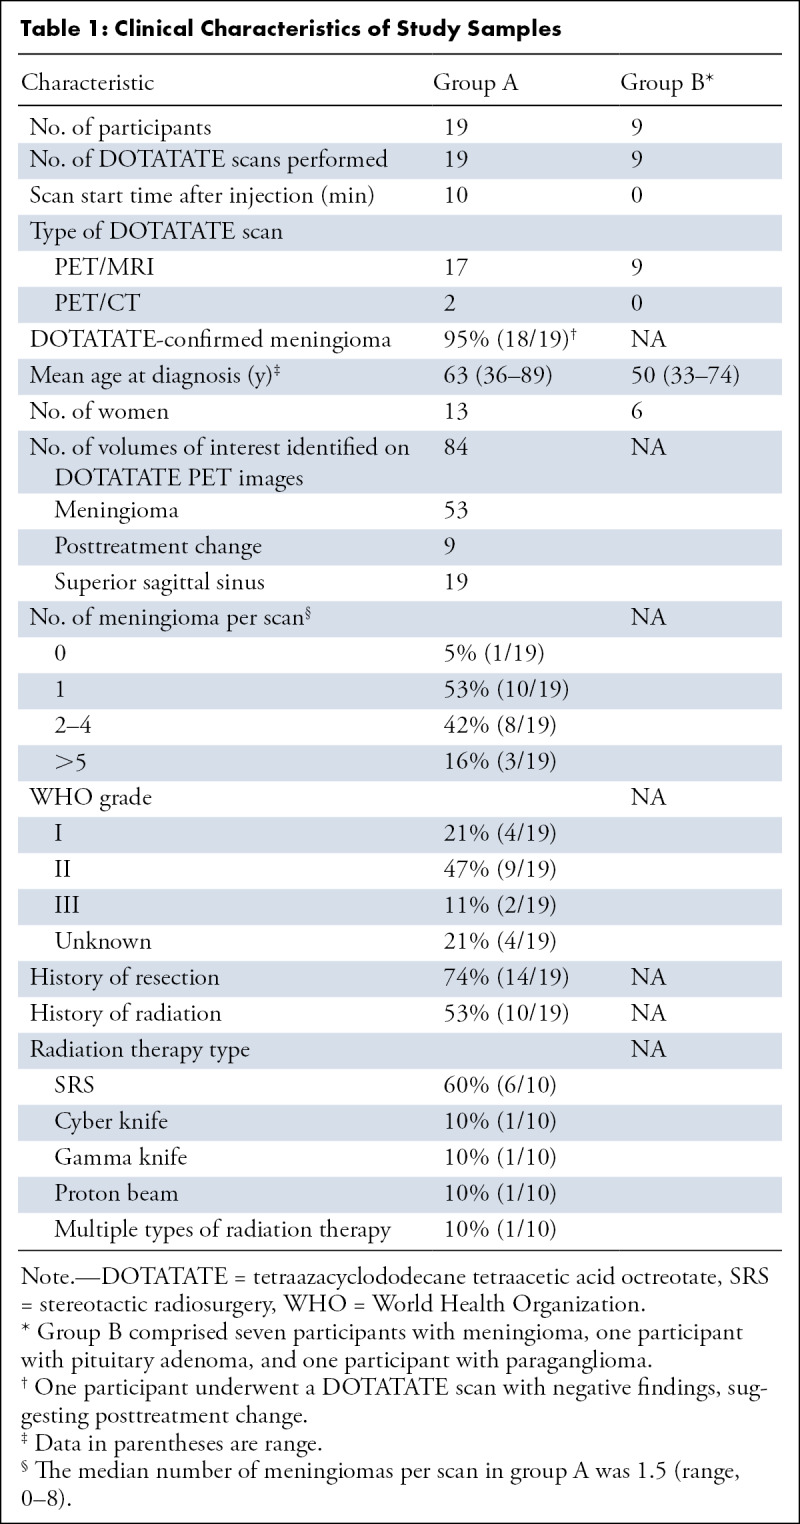
Funding support for this study was provided by Novartis Pharmaceuticals in the form of radiotracer doses and funding paid to the institution, in support of an investigator-initiated trial (ClinicalTrials.gov no. NCT04081701; primary investigator, J.I.). None of the authors are employees of or consultants for Novartis Pharmaceuticals. All authors had control of the data and information submitted in the publication. Data generated or analyzed during the study are available from the corresponding author by request. Institutional review board approval, according to Health Insurance Portability and Accountability Act guidelines, and written informed consent from each participant were obtained. An initial group (group A) consisted of 19 participants who each underwent one imaging examination. The inclusion criterion was a diagnosis of pathologic analysis–proven or clinically suspected meningioma; exclusion criteria were contraindications to gadolinium-based contrast agent and contraindications to 3-T MRI. A set of 40 target lesions were identified and imaged with a 50-minute simultaneous PET/MRI scan protocol. Through clinical chart review, demographic and clinical information was recorded for all participants, including age at diagnosis, sex, WHO grade of meningioma at time of pathologic diagnosis, and surgical and/or radiation treatment history (Table 1). MRI-based classification of meningioma was based on characteristic imaging features, including well-circumscribed margins, lobular structure, avid contrast enhancement, and extra-axial location with a broad-based dural attachment, often with an associated dural tail, as determined by both the interpreting neuroradiologist and secondary review from study neuroradiologists.
Table 1:
Clinical Characteristics of Study Samples
In participants with multiple meningiomas, in whom at least one meningioma was proven with histopathologic analysis, all meningiomas were assigned the same WHO grade on the basis of previously published studies (26–28).
For participants in group A, it was not possible to perform the administration of 68Ga-DOTATATE at the scanner table due to a lack of an MRI-compatible injection shield at the time. Therefore, acquisition in these participants started at 7 minutes (mean) ± 3 (SD) after injection, thereby missing the early postinjection section of the refTTACs section. The complete refTTAC measurements since injection time are required by the Patlak model to accurately estimate the K i and Vb parameters at each targeted tissue region or voxel (18). Thus, to infer the missing refTTACs section in the examinations of participants in group A, separate refTTAC data from a new group (group B) of nine PET/MRI examinations were later acquired in a new set of nine participants, enrolled on the basis of the same inclusion criteria (Table 1). Using an MRI-compatible portable injection shield, group B participants were injected at the scanner table, with PET performance commencing with 68Ga-DOTATATE injection, allowing measurement of the complete refTTAC. The complete refTTACs were then processed to build a population-based refTTAC (PB-refTTAC) model, as described later, which could subsequently be used to infer the missing early section of the refTTAC of group A examinations and enable the estimation of the Patlak kinetic parameters.
Image Acquisition and Reconstruction
All PET/MRI examinations of participants in groups A and B were performed with the Biograph mMR scanner (Siemens Healthineers) with the exception of one participant in group A scanned with the GE SIGNA PET/MRI scanner (GE Healthcare). Participants were injected with 172.9 MBq ± 18.4 of 68Ga-DOTATATE.
In participants in group A, a dynamic list-mode three-dimensional (3D) PET data acquisition of 50 minutes was initiated within 10 minutes after injection. Histograms were created of the PET list data from the entire 50-minute scan period (10–60 minutes after injection), as well as from the last 10 minutes of the same acquisition (50–60 minutes after injection), in two respective static data frames to produce SUV50 and SUV10 images, respectively (29). In addition, histograms were created of the list data in 10 sequential postinjection frames of 5 minutes each. All PET frames were subsequently reconstructed with the standard ordered subset expectation maximization algorithm using three iterations and 21 (Siemens) or 28 (GE) subsets of projection views. Matrix size of 344 × 344 × 127 voxels with voxel size of 2.086 × 2.086 × 2.031 mm (Siemens) was employed (for GE, matrix size was 192 × 192 × 89 voxels with voxel size of 1.875 × 1.875 × 2.780 mm).
MRI was performed according to institutional protocol, including pre- and postcontrast sagittal 3D T1 SPACE (ie, sampling perfection with application-optimized contrast using different flip-angle evolutions) (repetition time, 600–700 msec; echo time, 11–19 msec; flip angle, 120°; and section thickness, 1 mm) and 3D T2 fluid-attenuated inversion recovery (repetition time, 6300–8500 msec; echo time, 394–446 msec; flip angle, 120°; and section thickness, 1 mm). MRI-based PET attenuation correction was obtained according to the manufacturer standard-of-care specifications. In two group A participants, a dynamic PET/CT scan was performed instead of PET/MRI because of participant-specific contraindications to 3-T MRI, and the PET images were aligned and fused to recent contrast-enhanced MR images of the same participants using syngo.via software (Siemens Healthineers).
All group B participants underwent 3D list-mode acquisition for a total of 60 minutes starting simultaneously with 68Ga-DOTATATE injection. Histograms were created of the first 5 minutes of list PET data in 12 10-second frames, followed by nine 20-second frames (17). Histograms were also created of the remaining 55 minutes in 11 300-second frames. All PET frames were reconstructed with the same settings as group A. The PB-refTTAC model was built from the individual refTTACs of group B and employed to extrapolate the missing 0–10 minutes section of the individual refTTACs of group A examinations as explained below.
Volume of Interest Analysis
Volumes of interest (VOIs) were delineated in targeted regions across all the dynamic PET images using VINCI v4.84 (Max Planck Institute for Metabolism Research) (30). The VOIs were drawn for selected lesions, including meningioma (radiographically suspected and/or pathologic analysis proven), suspected posttreatment change, and superior sagittal sinus (SSS, as an approximation of background cranial blood pool and serving as negative reference for 68Ga-DOTATATE uptake in meningioma) (8). Tumors with a diameter greater than 0.6 cm and with high tracer avidity (determined visually) were included for evaluation. The anatomic delineation of the VOIs in the PET images was based on the coregistered sagittal 3D T1-weighted postcontrast MR images with respective axial and coronal reformations.
Of the total 19 PET data sets, a PET physicist (N.A.K.) with 15 years of experience drew VOIs with VINCI for 13 data sets, while an image analyst (S.K.) with 3 years of experience drew VOIs for the other six data sets. In addition, to evaluate interobserver agreement on VOI delineation, both experts drew VOIs from a common subset of five PET data sets, randomly selected from the study sample, in 12 unique regions, including seven meningiomas and five SSS.
Static Analysis and Postinjection Acquisition Window
Absolute maximum and mean SUV values were extracted at each targeted VOI from the entire 50-minute (10–60 minutes after injection) acquisition window (SUV50), as previously demonstrated in static PET/MRI scan protocols to attain minimal statistical noise (8), knowing that 68Ga-DOTATATE uptake in meningioma had previously been shown to begin approaching a maximum plateau at approximately 10–20 minutes after injection (24,25). Subsequently, the same type of SUV regional scores were extracted from SUV images reconstructed from data corresponding to the last 10 minutes of the same acquisition (SUV10). In addition, the extracted SUVs were normalized to the respective SUVs of the SSS region to yield the relative maximum and mean SUV scores for each acquisition window.
Kinetic Analysis
PMOD (PMOD Technologies) was used for kinetic modeling. Tissue TACs were extracted in mean kilobecquerel per milliliter units from the delineated VOIs imported to PMOD from VINCI and subsequently propagated across all the dynamic PET images. The additional computational time required to complete Patlak analysis for all regions and all image voxels per examination did not exceed 4 minutes, which should be considered acceptable in clinical practice (31). The PB-refTTAC model was employed to infer the missing 0–10 minutes of refTTAC data needed by the Patlak method to quantify the Ki parameter for each region. For that purpose, a full 0–60 minutes postinjection PB-refTTAC model was built from refTTACs extracted from the negative reference region of SSS of dynamic PET images acquired from the nine PET/MRI scans of group B, which commenced concurrently with 68Ga-DOTATATE injection. Each of the nine 0–60 minutes SSS refTTACs were normalized to their area under the curve and averaged together to produce a single SSS PB-refTTAC model (32). The SSS PB-refTTAC model was then scaled to best match the tail section (40–55 minutes after injection) of each of the 19 individual SSS refTTACs of group A examinations. The scaling was performed such that the SSS PB-refTTAC model’s tail section at 40–55 minutes after injection matched, on average, the corresponding tail section of the individual SSS refTTACs measured from the group A examination. Thus, the missing 0–10 minutes postinjection SSS refTTAC data of each of the 19 examinations in group A could then be extrapolated from the scaled PB-refTTAC model for that examination (33). Before applying the PB-refTTAC model to group A examinations, the leave-one-out cross-validation method had been applied to the nine SSS refTTACs of the respective 60-minute PET data set in group B to assess the accuracy of the model (34). More specifically, nine different PB-refTTAC models were built by excluding one (hence the term “leave-one-out”) of the nine SSS refTTACs from the model building process every time. Then, each of the nine PB-refTTACs was scaled to match, on average, the excluded refTTAC at their tail section corresponding to 40–55 minutes after injection, assuming the early 0–10 minutes postinjection section of the excluded refTTAC was missing. Subsequently, all 22 predicted PB-refTTAC values corresponding to the early 0–10 minutes postinjection sections of all nine applied SSS refTTACs were compared against the respective 22 measured values of all nine excluded refTTACs. No evidence of a difference (P > .1, paired t test) was found between the 198 (22 × 9) pairs of predicted and measured refTTAC values for that 0–10 minutes postinjection period.
Following the extrapolation of the missing early section of the SSS refTTACs of group A examinations, the standard Patlak (sPatlak) and generalized Patlak (gPatlak) reference graphical analysis methods were employed for the region-based kinetic analysis of the dynamic PET TACs data and the estimation of the net utilization or binding or internalization rate constant K i parameter for each target VOI (18,23). The sPatlak method assumes an irreversible binding process for 68Ga-DOTATATE with a simple linear model to support the estimation of the Patlak kinetic parameters via linear regression. The gPatlak method is a generalization of the sPatlak method by introducing the definition of the net efflux rate constant kloss (considered to be 0 in linear sPatlak method) in a nonlinear exponential model to account for the possibility of mild 68Ga-DOTATATE reversible binding (externalization) in tissue at a temporal rate that is very small (ie, negligible or mild) compared with the net binding (internalization) rate constant (23). Thus, the gPatlak method involves a less robust linearization fitting method to estimate the Patlak kinetic parameters. Although it is expected to be less precise, in theory it is considered more accurate than sPatlak in the presence of true underlying binding reversibility (kloss>0). We employed both Patlak models to assess any significant difference between the more precise sKi and the potentially more accurate gKi metric, as past studies have shown a negligible or very small degree of reversible binding for 68Ga-DOTA-peptide agents in meningiomas (25).
The measured target and reference VOI tissue TACs were then plotted according to the assumptions of the respective Patlak method to form the sPatlak and gPatlak plots, respectively. Subsequently, the data of each plot were fitted using the ordinary least-squares linear regression method (35) for the sPatlak method and the basis function method (23) for the gPatlak method. The slope of each fit yielded the respective sPatlak K i (sKi) and gPatlak K i (gKi) scores for each VOI.
Finally, the sKi spatial distribution features of 68Ga-DOTATATE in meningioma and other brain tissues were visually assessed by repeating the sPatlak analysis on a voxel-by-voxel basis across the entire field of view to produce sKi and Vb parametric images of the whole brain of each participant to assess imaging contrast of meningioma lesions between SUV and Patlak parametric images.
Statistical Analyses
Spearman rank correlation analyses were performed to assess correlation between Patlak sKi, gKi, and maximum or mean SUV50 in meningioma and posttreatment change regions. To evaluate differences in Spearman correlations between sKi versus SUV and gK i versus SUV, we also calculated a z score and P value for each different type of SUV metric. On the website https://www.danielsoper.com/statcalc/references.aspx?id=104, one may find references to the online calculator (36), which was accessed on June 28, 2020, and to the related literature (37). Mann-Whitney U tests were also employed to assess any potential statistical significance in the score differences between meningioma and posttreatment change lesions for all the types of SUV metrics, as well as for sKi and gKi parameters. Additionally, Wilcoxon matched-pairs signed rank tests were performed to determine differences between SUV50 and SUV10 score pairs or between sKi and gKi score pairs at matched regions of same participants. Moreover, Bland-Altman analysis was conducted to assess systematic differences between SUV50 and SUV10 scores or between sK i and gKi parameters at matched regions of the same participants across all evaluated regions of all participants. To assess for interobserver variability, interclass correlation coefficient estimates and 95% CIs were calculated from the 12 common VOIs of the interobserver subgroup of studies using SPSS statistical package version 26 (IBM) on the basis of the mean rating (k = 2), absolute and consistency agreement, and two-way mixed-effects models (38). In all statistical tests above, the significance level was set to a P value less than .05 (Prism, version 6.07; GraphPad Software).
Results
Study Sample
The study included two separate groups of PET/MRI examinations that were performed at different time periods. For group A, 19 examinations were performed in 19 participants (six men and 13 women; mean age, 63 years; range, 36–81 years) with a history of clinically suspected or histopathologic analysis–proven meningioma (WHO grade I, n = 4; WHO grade II, n = 9; WHO grade III, n = 2; WHO grade not available, n = 4) with a total of 53 meningiomas and nine regions of suspected posttreatment change (Table 1). For group B, nine examinations were performed in nine participants (three men and six women; mean age, 50 years; range, 33–74 years) where only the nine respective SSS regions were evaluated to collect the complete (0–60 minutes after injection) refTTACs data that were necessary to build the PB-refTTAC model (Table 1). Employing the leave-one-out cross-validation method on the PB-refTTAC model, a paired difference of 2% ± 4 (P > .10, paired t test) was found after comparing 198 pairs of extrapolated versus measured values at 198 matched time points within the early 0–10 minutes postinjection section of the nine SSS refTTACs in group B.
Dynamic PET/MRI Acquisition and Multiparametric Image Analysis
Figures 1A–1F demonstrate characteristic 68Ga-DOTATATE PET dynamic images from an early, mid, and late frame and the respective PET images fused with T1-weighted postcontrast MR images in a representative participant from group A. In addition, Figure 1G shows characteristic reference tissue (SSS) and targeted tissue (meningioma) TACs measured for the entire 0–60 minutes postinjection scan period in a group B examination. The meningioma TACs exhibited a fast uptake phase quickly followed by a slow rise at a relatively high activity concentration level within the first 10 minutes after injection, thereby confirming previous studies reporting similar kinetic features (24,25). Figure 2 shows a 68Ga-DOTATATE SUV50 image compared with a standard Patlak K i parametric image for the same participant before and after fusion with a T1 postcontrast MR image.
Figure 1:
(A–C) Three axial 68Ga-DOTATATE PET dynamic images (first, fourth, and ninth 5-minute frame) in a 66-year-old woman in group A with a history of World Health Organization grade II meningioma status after resection 4 months prior to imaging and (D–F) corresponding PET T1-weighted post-gadolinium-enhancement fusion images from 5-minute frames at (A, D) 10 minutes after injection, (B, E) 30 minutes after injection, and (C, F) 45 minutes after injection. (G) Corresponding reference tissue (superior sagittal sinus [SSS]) and targeted tissue (meningioma) region time-activity curves (TACs). DOTATATE = tetraazacyclododecane tetraacetic acid octreotate, 68Ga = gallium 68, p.i. = postinjection.
Figure 2:
Axial images of (A) 68 Ga-DOTATATE PET SUV50, (B) Patlak Ki, (C) three-dimensional T1-weighted post-gadolinium-enhanced MRI, (D) fused PET SUV/MRI T1, and (E) fused Patlak Ki/MRI T1 parameters in a 66-year-old woman in group A with a history of World Health Organization grade II meningioma status (same participant as in Fig 1). DOTATATE = tetraazacyclododecane tetraacetic acid octreotate, 68Ga = gallium 68, Ki = net binding rate constant, SUV = standardized uptake value, SUV50 = SUV extracted from the entire 50 minutes of acquisition.
Comparison of Postinjection Acquisition Windows
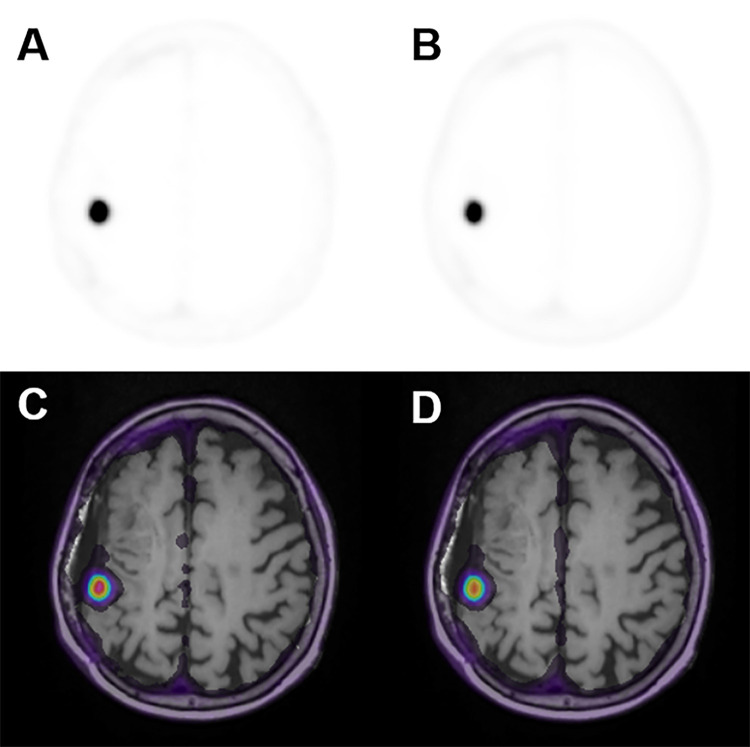
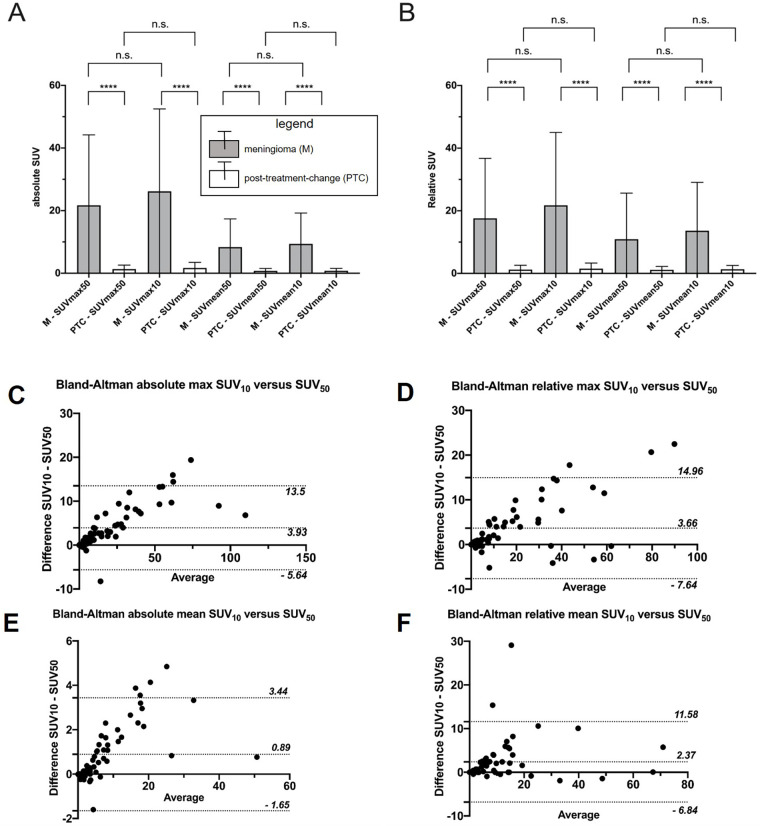
A side-by-side comparison of 68Ga-DOTATATE PET SUV50 and SUV10 images fused with T1 postcontrast MRI is presented in Figure 3. SUV10 metrics were found to be different than the respective SUV50 metrics in meningioma regions (P < .001, Table 2), but not necessarily in posttreatment change regions (P > .05, Table 2). Across both meningioma and posttreatment change regions and all ranges of scores, Bland-Altman analysis showed that SUV10 scores were on average higher than SUV50 scores across all ranges of scores (Fig 4C–4F). The few outlier points suggesting a negative difference can be attributed to noise due to the small size of corresponding VOIs.
Figure 3:
(A, B) Axial 68Ga-DOTATATE PET images and (C, D) corresponding PET T1-weighted post-gadolinium-enhancement fusion images from (A, C) the last 10-minute frame at 50–60 minutes after injection and (B, D) the entire 50-minute acquisition period at 10–60 minutes after injection in a 66-year-old woman in group A with a history of World Health Organization grade II meningioma status (same participant as in Fig 1). DOTATATE = tetraazacyclododecane tetraacetic acid octreotate, 68Ga = gallium 68.
Table 2:
P Values for Differences between SUV50 and SUV10 Scores for All Evaluated Types of SUV Metrics and between sKi and gKi across Meningiomas and Posttreatment Change Regions
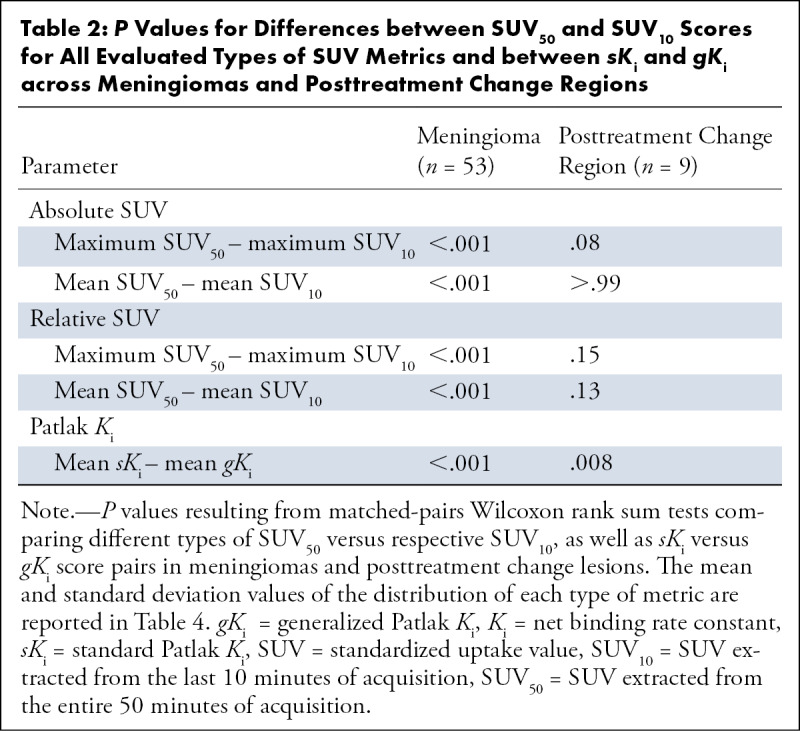
Figure 4:
Comparison of meningioma and posttreatment-change lesions using maximum and mean standardized uptake value (SUV) measured over the entire scan period versus the last 10 minutes. Shown are mean and SD of each of the four types of SUV metrics. (A) Maximum and mean absolute SUV and (B) relative maximum and mean SUV (normalized to the superior sagittal sinus). **** indicates P value less than .001. (C–F) The respective Bland-Altman plots including both meningioma and posttreatment-change regions in the same chart with most SUV10−SUV50 differences being positive and lying within the plotted 95% CIs. n.s. = not significant, SUV10 = SUV extracted from the last 10 minutes of acquisition, SUV50= SUV extracted from the entire 50 minutes of acquisition.
Comparison of SUV and Patlak-derived Ki Values
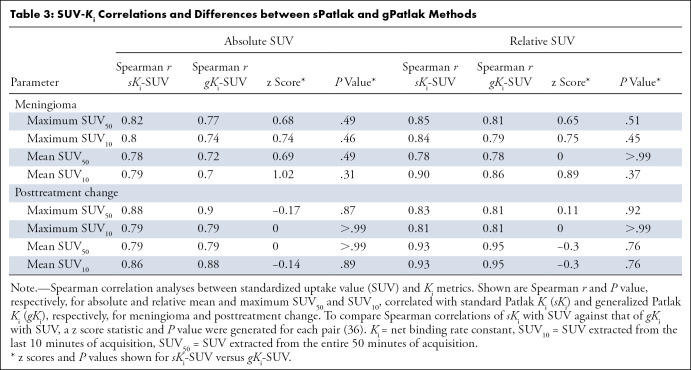
Ki values estimated from the sPatlak and gPatlak graphical analysis methods were calculated for all VOIs as described in the methods section. In total, 53 meningiomas and nine VOIs consistent with posttreatment change were included in the study. In meningioma, absolute and relative maximum SUV50 demonstrated a strong positive correlation with sKi (r = 0.82, P < .001 and r = 0.85, P < .001, respectively). Similar results were found in posttreatment change regions (r = 0.88, P = .007 and r = 0.83, P = .02, respectively). Similarly, absolute and relative maximum SUV50 demonstrated a strong positive correlation with gKi in meningiomas (r = 0.77, P < .001 and r = 0.81, P < .001, respectively) and posttreatment change regions (r = 0.90, P = .005 and r = 0.81, P = .02, respectively). Moreover, mean absolute and relative SUV50 demonstrated similarly positive and strong correlations with sKi and gKi in both meningioma and posttreatment change regions (Table 3). To compare Spearman correlations of sKi and gKi with each of the different types of SUV metrics evaluated, a z score statistic and P value were generated for each pair (36); none of these P values were significant (Table 3).
Table 3:
SUV-Ki Correlations and Differences between sPatlak and gPatlak Methods
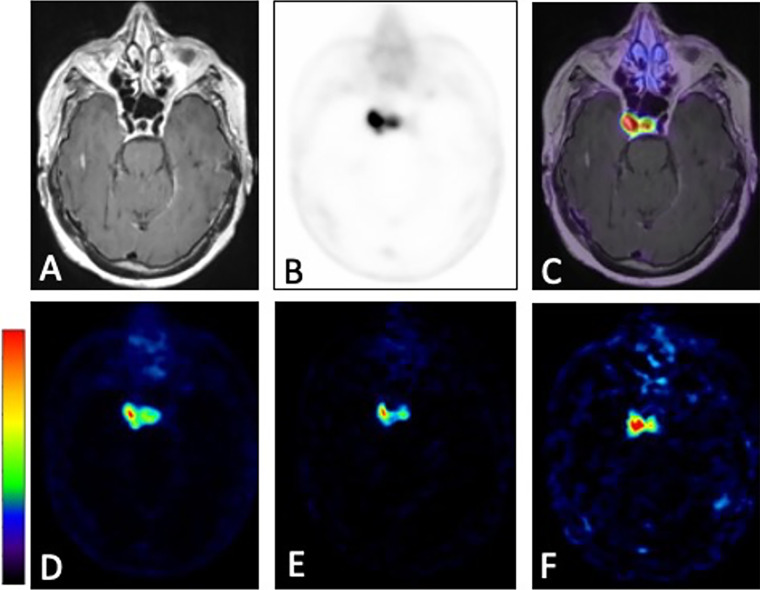
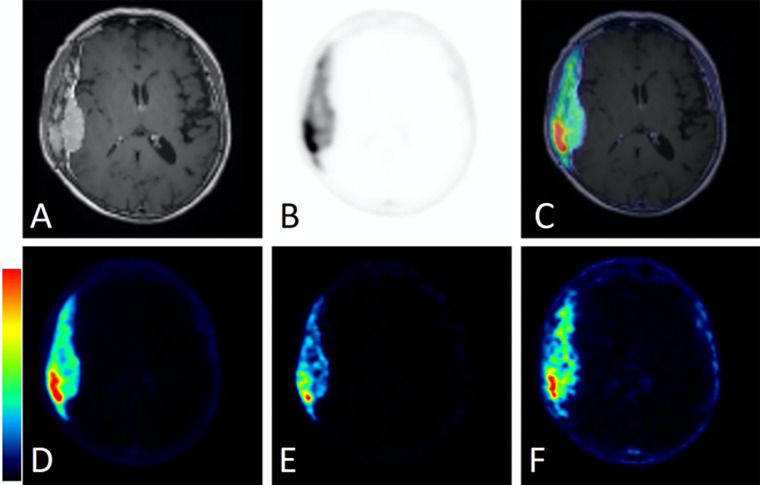
Furthermore, the qualitative comparison of the PET SUV50 and SUV10 images against the respective parametric Patlak sKi and Vb maps, using contrast-enhanced T1-weighted MRI maps as anatomic reference, revealed the visually apparent improvement in the contrast attained with the sKi maps relative to SUV and Vb maps between meningioma and pituitary gland (Fig 5) or between dural and transosseous components (Fig 6) for two different characteristic examinations in group A, respectively. This finding was attributed to the removal of nonspecific background signal in neighboring tissue and the less diffused signal distribution in the targeted regions observed with the sKi maps compared with the SUV50, SUV10, and Vb maps. Because of the less diffused signal distribution in target regions attained with Patlak sKi maps, the meningioma signal was more clearly differentiated from the neighboring nonspecific pituitary gland avid signal typically observed in 68Ga-DOTATATE brain PET studies (Fig 5). Moreover, the mean target–to–mean background contrast between the meningioma dural and transosseous components was increased from 2.5 in SUV10 images to 4.2 in Patlak sKi images (Fig 6).
Figure 5:
Comparison of static standardized uptake value (SUV) and standard Patlak (sPatlak)–derived parametric images in a representative examination from group A. This 72-year-old woman with a history of right cavernous sinus meningioma who underwent gamma knife radiosurgery 12 years prior presented with an avidly enhancing soft-tissue mass involving the right cavernous sinus, not well delineated on (A) T1-weighted postcontrast images alone. (B) Static PET image summed over the entire 50-minute acquisition period and (C) PET/MRI fusion image demonstrate markedly improved delineation of the tumor. (D) Static PET image from the last 10 minutes of acquisition (50–60 minutes after injection), along with (E) PatlakslopeKi and (F) Patlak interceptVb parametric images from the same PET/MRI examination. The color bars are to maximum SUV for C and D, from 0 to maximum Ki (0–0.4 mL of reference tissue/min/grams of targeted tissue) for E, and from 0 to maximum Vb (0–11 mL of reference tissue/grams of targeted tissue) for F. Ki = net binding rate constant, Vb = sum of blood volume fraction and distribution volume.
Figure 6:
Comparison of static standardized uptake value (SUV) and standard Patlak (sPatlak)–derived parametric images in a second representative participant from group A. This 81-year-old woman presented with an avidly enhancing dural-based mass along the right temporal convexity. (A) Dural-based mass with heterogeneous enhancement of the overlying calvarium concerning for intraosseous extension as presented in T1-weighted postcontrast image alone. (B) Corresponding PET and (C) PET/MRI fusion images demonstrate intense 68Ga-DOTATATE avidity within both the dural-based and the intraosseous components of the mass. (D) Static PET image from the last 10 minutes of acquisition (50–60 minutes after injection), along with (E) Patlak slope Ki and (F) Patlak intercept Vb parametric images from the same PET/MRI examination. The color bars are to maximum SUV for C and D, from 0 to maximum Ki (0–0.4 mL of reference tissue/min/grams of targeted tissue) for E, and from 0 to maximum Vb (0–11 mL of reference tissue/grams of targeted tissue) for F. DOTATATE = tetraazacyclododecane tetraacetic acid octreotate, 68Ga = gallium 68, Ki = net binding rate constant, Vb = sum of blood volume fraction and distribution volume.
Comparison of Linear sKi versus Nonlinear gKi Metric
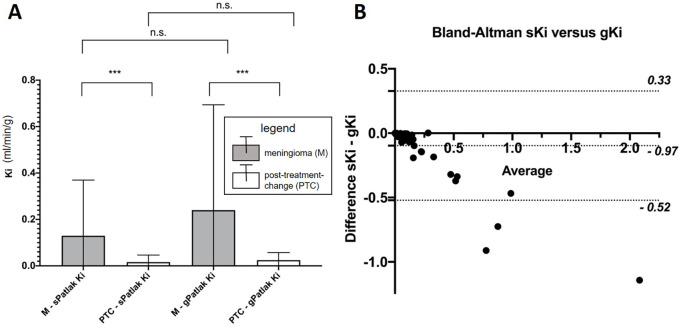
The gKi metrics were found to be different from the sKi metrics in both meningioma and posttreatment change regions (P < .001, Table 2). Across both meningioma and posttreatment change regions and all ranges of Ki scores, Bland-Altman analysis showed that gKi scores were on average higher than sKi scores (Fig 7B), as expected in theory (18). Any of the very few outliers suggesting a negative difference can be attributed to the high statistical noise levels exhibited by Ki values because Patlak fitting occurs after reconstruction, rather than within the reconstruction itself, as is the case with direct Patlak four-dimensional reconstruction methods (33).
Figure 7:
(A) Comparison of meningioma and posttreatment-change lesions using standard (sPatlak) and generalized (gPatlak) Ki scores. Shown are mean and standard deviation. *** indicates P value less than .001. (B) Respective Bland-Altman plot including both meningioma and posttreatment change regions in the same chart with most sKi-gKi differences being negative and lying within the plotted 95% CIs. gKi = gPatlak Ki, Ki = net binding rate constant, n.s. = not significant, sKi = sPatlak K i.
Differentiation of Meningioma from Posttreatment Change
We further investigated the clinical value of SUV50, SUV10, sKi, and gK i in differentiating meningioma from posttreatment change. Different averaged scores (P < .001) were observed between meningioma and posttreatment change for absolute maximum (21.71 vs 1.33), absolute mean (8.36 vs 0.77), relative maximum (17.59 vs 1.21), and relative mean (10.94 vs 1.15) SUV50 metrics (Table 4, Fig 4A). Furthermore, different average scores were also recorded in meningioma versus posttreatment change for absolute maximum (26.17 vs 1.71), absolute mean (9.39 vs 0.78), relative maximum (21.75 vs 1.53), and relative mean (13.64 vs 1.33) SUV10 metrics (Table 4, Fig 4B). Similar and distinct differences in scores of the same type were observed between meningioma and posttreatment change for both SUV50 and SUV10 (P < .001 for both, Table 4) metrics, that is, regardless of the measurement time window. Furthermore, the meningioma-over–posttreatment change ratio of relative maximum SUV scores of three, which was previously established as a quantitative cutoff criterion to differentiate meningioma from posttreatment change using the 10–60 minutes postinjection window for the SUV (SUV50) calculation (8), did not result in reclassification of any of the lesions evaluated in this study when SUV50 scores were replaced by SUV10 scores instead.
Table 4:
SUV and Ki Scores between Meningioma and Posttreatment Change Region
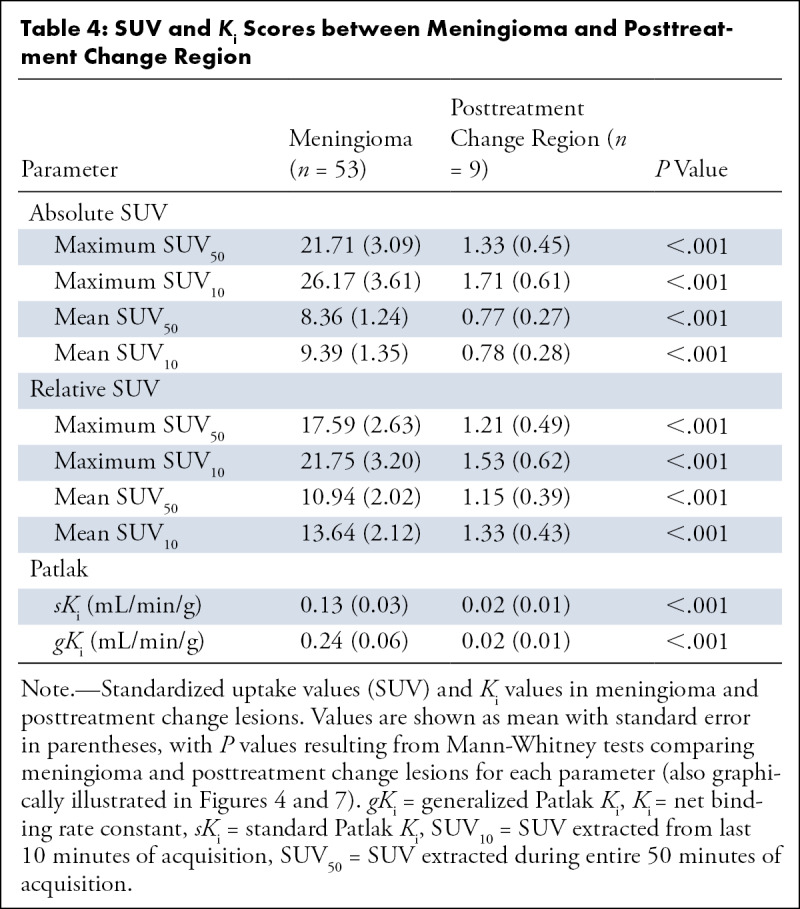
In addition, both sKi (0.13 vs 0.02 mL/min/g) and gKi (0.24 vs 0.02 mL/min/g) exhibited differences (P < .001) between the two region types (Table 4; Fig 7A). In Figure 8, the differences in the Patlak plots for meningioma versus posttreatment change are demonstrated under both sPatlak and gPatlak model assumptions. Stratification into meningioma versus posttreatment change lesions based on absolute or relative SUV50 or SUV10 was not affected when using sKi or gKi metrics instead.
Figure 8:
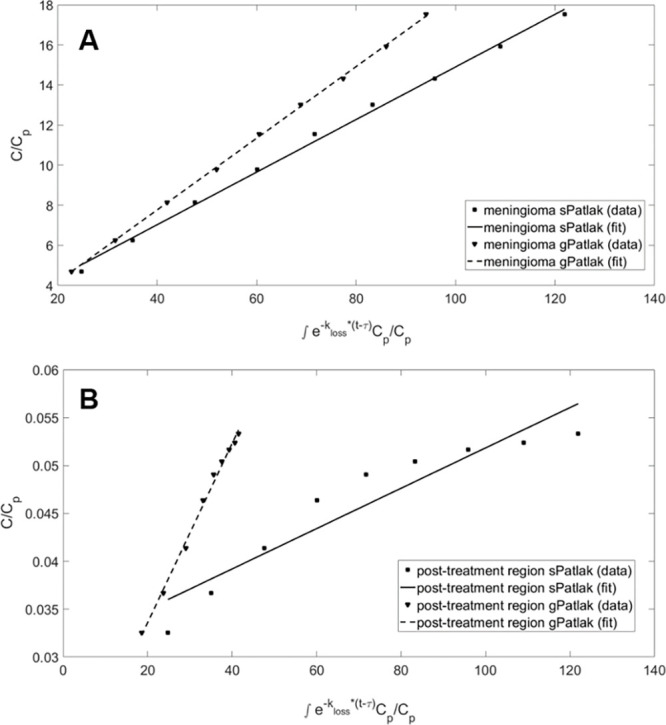
Graphical analysis of standard Patlak (sPatlak) (kloss= 0) and generalized Patlak (gPatlak) (kloss≥ 0) plots of 68Ga-DOTATATE dynamic uptake in a (A) meningioma and (B) posttreatment-change regions from a single participant examination. Although the different dynamic 68Ga-DOTATATE uptake patterns illustrated for this participant between meningioma and posttreatment change may suggest a higher efflux rate constant for posttreatment change, no evidence of a difference in the efflux rate constant was observed between meningioma and posttreatment change across the volumes of interest evaluated in this study. C = radiotracer activity concentration in tissue, Cp= radiotracer activity concentration in reference tissue, DOTATATE = tetraazacyclododecane tetraacetic acid octreotate, 68Ga = gallium 68, kloss = radiotracer deassociation rate constant, τ = time after injection to attain kinetic equilibrium and enter linear region in the Patlak plot.
Interobserver Variability
Interclass correlation coefficients comparing the Ki values from the meningioma between sets of VOI delineated by two independent observers were 0.973 (95% CI: 0.853, 0.995) and 0.970 (95% CI: 0.827, 0.995) for the absolute and consistency agreement models, respectively.
Discussion
Sensitivity and specificity of contrast-enhanced MRI in meningioma can be limited particularly in the postsurgical and postradiation setting. 68Ga-DOTATATE PET was previously shown to improve assessment for residual and recurrent tumor and optimize adjuvant radiation therapy planning (39,40). Dynamic and parametric 68Ga-DOTATATE brain PET has previously not been well established in the literature. We sought to evaluate 68Ga-DOTATATE PET/MRI as an adjunct modality in meningioma, taking advantage of the relatively long acquisition time of clinical brain tumor protocol MRI and simultaneous PET acquisition, with the potential of optimizing the static acquisition period, and to assess the potential benefits of voxelwise Patlak parametric mapping in lesion contrast enhancement via the removal of nonspecific background signal in surrounding tissue.
We employed the standard and relatively more robust linear Patlak graphical analysis method, as well as the nonlinear Patlak method, to account for irreversible and reversible SSTR2 binding, respectively (23). However, we observed no evidence of a difference in the differentiation of meningioma from posttreatment change effects or other regions of avid physiologic uptake (eg, pituitary gland) between the two methods (Fig 7), thereby confirming the findings of past studies (24,25). Our findings favor the sPatlak over the gPatlak model, particularly for voxelwise parametric mapping, which has the potential to enhance lesion detectability, decrease false-positive findings, and assess intratumoral heterogeneity of kinetic features (33).
We found a strong significant positive correlation between Ki and SUV in meningioma and posttreatment change, suggesting fast and sustained binding of SSTR2 on meningiomas and little added value in complementing SUV with Ki analysis for differentiating meningioma from posttreatment change for most cases. Nevertheless, our results in some of the participants suggested that Ki imaging may visually enhance PET signal contrast between meningioma and nonspecific background signal in neighboring tissue such as the pituitary gland for a few selected cases (Fig 5). This task could be challenging with the less specific and more diffused SUV signal distributions alone, particularly in the case of high proximity of meningioma to regions of physiologic 68Ga-DOTATATE avidity (eg, pituitary) or posttreatment effects. Furthermore, the Ki metric exhibited higher contrast between the dural and transosseous components of meningioma compared with SUV (Fig 6). Moreover, interclass correlation coefficient analysis demonstrated that regional sKi values can be extracted with high interobserver agreement, suggesting reproducibility of the proposed analysis approach and potential for adaptation into clinical practice. While kinetic modeling is not currently widely integrated into clinical workflows of PET/CT and PET/MRI routine examinations, manufacturers of clinical PET systems have begun to provide automated streamlined Patlak modeling analysis tools (31) to enable future clinical integration of kinetic modeling. Dynamic 68Ga-DOTATATE PET/MRI may also enhance personalized treatment planning in meningioma patients, as well as improve dosimetry analysis in the targeted radiation therapy of meningioma with lutetium 177 DOTATATE (41,42). Beyond meningioma, our findings can serve as a pilot to expand the application of whole-body dynamic 68Ga-DOTATATE PET scans and multiparametric whole-body SUV and Ki analysis (35) in SSTR2–positive systemic neoplasms.
We also compared SUV scores from the static 68Ga-DOTATATE images of the last 10 minutes (SUV10) versus SUV scores from the entire 50-minute acquisition period (SUV50). Given that very small P values (P < .001) were determined when evaluating the difference in SUV metrics between meningioma and posttreatment change regions regardless of the postinjection time window, our results suggest that the choice between SUV50 and SUV10 measurements does not affect the overall performance in differentiating meningioma from posttreatment change. Furthermore, the previously established criterion of a cutoff value of three in the maximum relative SUV50 metric for differentiating meningioma over posttreatment change (8,24,25) still holds when replacing SUV50 scores with their respective SUV10 metrics in all evaluated regions of our study. This replacement can be important when optimizing static PET acquisition time windows for examinations where the reduction of the PET scan time can significantly reduce the total scan time, such as for nonsimultaneous PET/MRI, as well as for PET/CT scan protocols. Moreover, the suggested 10-minutes measurement period may also provide SUV images of higher contrast for meningioma lesions because of the expected higher degree of 68Ga-DOTATATE binding in meningioma relative to surrounding nonspecific background tissue, as shown from the TACs in Figure 1, and because of the lower likelihood for motion during that period. On the other hand, for regular brain simultaneous PET/MRI studies where the MRI sequences typically last more than 30 minutes, the availability of such long scan periods may be exploited to perform similarly long dynamic PET scans parallel to the MRI, thus enabling multiparametric 68Ga-DOTATATE imaging (11).
Limitations of our study included the lack of dynamic PET data in the first 5–10 minutes after injection in group A. Nevertheless, we were able to acquire a group of PET/MR images in which 68Ga-DOTATATE injection coincided with acquisition start (group B), allowing us to build a population-based reference 68Ga-DOTATATE tissue TAC model that was successfully validated (34). We observed that most of the targeted tissue TACs were found to be stable after 50 minutes in terms of decay-corrected activity concentration. This finding, together with the short half-life (68 minutes) and relatively low administered activity (approximately 185 MBq) of 68Ga-DOTATATE dose, suggests that imaging later than 60 minutes after injection may be avoided.
Supported in part by an investigator-initiated trial grant from Advanced Accelerator Applications, a Novartis Company (primary investigator, J.I.); Radiological Society of North America (RSNA) Resident Research Grant (RR1962; primary investigator, M.R.); and RSNA Medical Student Research Grant (primary investigator, S.K.)
Data sharing: Data generated or analyzed during the study are available from the corresponding author by request.
Disclosures of Conflicts of Interest: J.I. This work was partially funded by an investigator-initiated clinical trial grant from Advanced Accelerator Applications, a Novartis company, author is primary investigator, payments made to author’s institution; associate editor of Radiology: Imaging Cancer. M.R. This work was partially funded by Radiological Society of North America (RSNA) 2019-2020 Radiology Research Grant (RR1962), author is primary investigator, payments made to author’s institution. M.S. No relevant relationships. S.K. This work was partially funded by RSNA Medical Student Research Grant, author is primary investigator. S.G. No relevant relationships. J.R.O. No relevant relationships. S.C.P. No relevant relationships. S.N. No relevant relationships. R.R. No relevant relationships. T.H.S. Consulting fees from RPW Technology, Integra, Elliquence, and NX Development; owns stocks in RPW Technology (consultant), MIVI Neuroscience (investor), Serenity Medical (investor), Neurotechnology Investors, and Endostream Medical (investor). J.P.S.K. Member of Data Safety Monitoring Board (DSMB) for a trial evaluating sulfasalazine as an adjunct to stereotactic radiosurgery for recurrent glioblastoma; the DSMB has been constituted, but has not yet been asked to review data. E.L. No relevant relationships. N.A.K. No relevant relationships.
Abbreviations:
- DOTATATE
- tetraazacyclododecane tetraacetic acid octreotate
- gKi
- gPatlak Ki
- gPatlak
- generalized Patlak
- Ki
- net binding rate constant
- PB-refTTAC
- population-based refTTAC
- refTTAC
- reference tissue TAC
- sKi
- sPatlak Ki
- sPatlak
- standard Patlak
- SSS
- superior sagittal sinus
- SSTR2
- somatostatin receptor 2
- SUV
- standardized uptake value
- SUV10
- SUV extracted from the last 10 minutes of acquisition
- SUV50
- SUV extracted from the entire 50 minutes of acquisition
- TAC
- time-activity curve
- 3D
- three dimensional
- Vb
- sum of blood volume fraction and distribution volume
- VOI
- volume of interest
- WHO
- World Health Organization
References
- 1. Ostrom QT, Gittleman H, Liao P, et al. CBTRUS Statistical Report: Primary brain and other central nervous system tumors diagnosed in the United States in 2010-2014. Neuro Oncol 2017; 19( suppl 5): v1– v88. [DOI] [PMC free article] [PubMed] [Google Scholar]
- 2. Durand A, Labrousse F, Jouvet A, et al. WHO grade II and III meningiomas: a study of prognostic factors. J Neurooncol 2009; 95( 3): 367– 375. [DOI] [PubMed] [Google Scholar]
- 3. Silva CB, Ongaratti BR, Trott G, et al. Expression of somatostatin receptors (SSTR1-SSTR5) in meningiomas and its clinicopathological significance. Int J Clin Exp Pathol 2015; 8( 10): 13185– 13192. [PMC free article] [PubMed] [Google Scholar]
- 4. Stade F, Dittmar JO, Jäkel O, et al. Influence of 68Ga-DOTATOC on sparing of normal tissue for radiation therapy of skull base meningioma: differential impact of photon and proton radiotherapy. Radiat Oncol 2018; 13( 1): 58. [DOI] [PMC free article] [PubMed] [Google Scholar]
- 5. Thorwarth D, Henke G, Müller AC, et al. Simultaneous 68Ga-DOTATOC-PET/MRI for IMRT treatment planning for meningioma: first experience. Int J Radiat Oncol Biol Phys 2011; 81( 1): 277– 283. [DOI] [PubMed] [Google Scholar]
- 6. Rachinger W, Stoecklein VM, Terpolilli NA, et al. Increased 68Ga-DOTATATE uptake in PET imaging discriminates meningioma and tumor-free tissue. J Nucl Med 2015; 56( 3): 347– 353. [DOI] [PubMed] [Google Scholar]
- 7. Reubi JC, Schär JC, Waser B, et al. Affinity profiles for human somatostatin receptor subtypes SST1-SST5 of somatostatin radiotracers selected for scintigraphic and radiotherapeutic use. Eur J Nucl Med 2000; 27( 3): 273– 282. [DOI] [PubMed] [Google Scholar]
- 8. Ivanidze J, Roytman M, Lin E, et al. Gallium-68 DOTATATE PET in the Evaluation of Intracranial Meningiomas. J Neuroimaging 2019; 29( 5): 650– 656. [DOI] [PubMed] [Google Scholar]
- 9. Kunz WG, Jungblut LM, Kazmierczak PM, et al. Improved Detection of Transosseous Meningiomas Using 68Ga-DOTATATE PET/CT Compared with Contrast-Enhanced MRI. J Nucl Med 2017; 58( 10): 1580– 1587. [DOI] [PubMed] [Google Scholar]
- 10. Afshar-Oromieh A, Giesel FL, Linhart HG, et al. Detection of cranial meningiomas: comparison of 68Ga-DOTATOC PET/CT and contrast-enhanced MRI. Eur J Nucl Med Mol Imaging 2012; 39( 9): 1409– 1415. [DOI] [PubMed] [Google Scholar]
- 11. Zaidi H, Karakatsanis N. Towards enhanced PET quantification in clinical oncology. Br J Radiol 2018; 91( 1081): 20170508. [DOI] [PMC free article] [PubMed] [Google Scholar]
- 12. Dimitrakopoulou-Strauss A, Pan L, Sachpekidis C. Kinetic modeling and parametric imaging with dynamic PET for oncological applications: general considerations, current clinical applications, and future perspectives. Eur J Nucl Med Mol Imaging 2021; 48( 1): 21– 39. [DOI] [PMC free article] [PubMed] [Google Scholar]
- 13. Carson RE. Tracer kinetic modeling in PET. In: Bailey DL, Townsend DW, Valk PE, Maisey MN, eds. Positron Emission Tomography. London, England: Springer, 2005;127–159. [Google Scholar]
- 14. Bentourkia M, Zaidi H. Tracer kinetic modeling in PET. PET Clin 2007; 2( 2): 267– 277. [DOI] [PubMed] [Google Scholar]
- 15. Sachpekidis C, Hillengass J, Goldschmidt H, et al. Treatment response evaluation with 18F-FDG PET/CT and 18F-NaF PET/CT in multiple myeloma patients undergoing high-dose chemotherapy and autologous stem cell transplantation. Eur J Nucl Med Mol Imaging 2017; 44( 1): 50– 62. [DOI] [PubMed] [Google Scholar]
- 16. Fahrni G, Karakatsanis NA, Di Domenicantonio G, Garibotto V, Zaidi H. Does whole-body Patlak 18F-FDG PET imaging improve lesion detectability in clinical oncology? Eur Radiol 2019; 29( 9): 4812– 4821. [DOI] [PubMed] [Google Scholar]
- 17. Karakatsanis NA, Lodge MA, Tahari AK, Zhou Y, Wahl RL, Rahmim A. Dynamic whole-body PET parametric imaging: I. Concept, acquisition protocol optimization and clinical application. Phys Med Biol 2013; 58( 20): 7391– 7418. [DOI] [PMC free article] [PubMed] [Google Scholar]
- 18. Patlak CS, Blasberg RG. Graphical evaluation of blood-to-brain transfer constants from multiple-time uptake data. Generalizations. J Cereb Blood Flow Metab 1985; 5( 4): 584– 590. [DOI] [PubMed] [Google Scholar]
- 19. Thuillier P, Bourhis D, Karakatsanis N, et al. Diagnostic performance of a whole-body dynamic 68GA-DOTATOC PET/CT acquisition to differentiate physiological uptake of pancreatic uncinate process from pancreatic neuroendocrine tumor. Medicine (Baltimore) 2020; 99( 33): e20021. [DOI] [PMC free article] [PubMed] [Google Scholar]
- 20. Ilan E, Velikyan I, Sandström M, Sundin A, Lubberink M. Tumor-to-Blood Ratio for Assessment of Somatostatin Receptor Density in Neuroendocrine Tumors Using 68Ga-DOTATOC and 68Ga-DOTATATE. J Nucl Med 2020; 61( 2): 217– 221. [DOI] [PubMed] [Google Scholar]
- 21. Karakatsanis NA, Lodge MA, Casey ME, Zaidi H, Rahmim A. Impact of acquisition time-window on clinical whole-body PET parametric imaging. In:2014 IEEE Nuclear Science Symposium and Medical Imaging Conference (NSS/MIC),Seattle, WA, November 8–15, 2014.Piscataway, NJ:IEEE,2014;1–8. [Google Scholar]
- 22. Karakatsanis NA, Zhou Y, Lodge MA, Casey ME, Wahl RL, Rahmim A. Quantitative whole-body parametric PET imaging incorporating a generalized Patlak model. In: s, Seoul, Korea,October 27–November 2, 2013.Piscataway, NJ:IEEE, 2013;1–9. [Google Scholar]
- 23. Karakatsanis NA, Zhou Y, Lodge MA, et al. Generalized whole-body Patlak parametric imaging for enhanced quantification in clinical PET. Phys Med Biol 2015; 60( 22): 8643– 8673. [DOI] [PMC free article] [PubMed] [Google Scholar]
- 24. Bashir A, Vestergaard MB, Binderup T, et al. Pharmacokinetic analysis of [68Ga]Ga-DOTA-TOC PET in meningiomas for assessment of in vivo somatostatin receptor subtype 2. Eur J Nucl Med Mol Imaging 2020; 47( 11): 2577– 2588. [DOI] [PubMed] [Google Scholar]
- 25. Henze M, Dimitrakopoulou-Strauss A, Milker-Zabel S, et al. Characterization of 68Ga-DOTA-D-Phe1-Tyr3-octreotide kinetics in patients with meningiomas. J Nucl Med 2005; 46( 5): 763– 769. [PubMed] [Google Scholar]
- 26. Sommerauer M, Burkhardt JK, Frontzek K, et al. 68Gallium-DOTATATE PET in meningioma: A reliable predictor of tumor growth rate? Neuro Oncol 2016; 18( 7): 1021– 1027. [DOI] [PMC free article] [PubMed] [Google Scholar]
- 27. Mocker K, Holland H, Ahnert P, et al. Multiple meningioma with different grades of malignancy: case report with genetic analysis applying single-nucleotide polymorphism array and classical cytogenetics. Pathol Res Pract 2011; 207( 1): 67– 72. [DOI] [PubMed] [Google Scholar]
- 28. Butti G, Assietti R, Casalone R, Paoletti P. Multiple meningiomas: a clinical, surgical, and cytogenetic analysis. Surg Neurol 1989; 31( 4): 255– 260. [DOI] [PubMed] [Google Scholar]
- 29. Karakatsanis N, Skafida M, Lin E, et al. Dynamic Ga-68-DOTATATE PET/MRI and Patlak analysis for enhanced diagnosis of intracranial meningioma. Eur J Nucl Med Mol Imaging 2019; 46( Suppl 1): S262– S263. [Google Scholar]
- 30. Vollmar S, Hampl JA, Kracht L, Herholz K. Integration of Functional Data (PET) into Brain Surgery Planning and Neuronavigation. In: Buzug TM, Holz D, Bongartz J, Kohl-Bareis M, Hartmann U, Weber S,eds.Advances in Medical Engineering. Springer Proceedings in Physics, vol 114.Berlin, Heidelberg:Springer,2007. [Google Scholar]
- 31. Hu JC, Panin V, Smith AM, et al. Design and Implementation of Automated Clinical Whole Body Parametric PET With Continuous Bed Motion. IEEE Trans Radiat Plasma Med Sci 2020; 4( 6): 696– 707. [Google Scholar]
- 32. Akerele MI, Zein SA, Pandya S, et al. Population-based input function for TSPO quantification and kinetic modeling with [11C]-DPA-713. EJNMMI Phys 2021; 8( 1): 39. [DOI] [PMC free article] [PubMed] [Google Scholar]
- 33. Karakatsanis NA, Casey ME, Lodge MA, Rahmim A, Zaidi H. Whole-body direct 4D parametric PET imaging employing nested generalized Patlak expectation-maximization reconstruction. Phys Med Biol 2016; 61( 15): 5456– 5485. [DOI] [PMC free article] [PubMed] [Google Scholar]
- 34. Karakatsanis N, Zhou Y, Lodge M, et al. Clinical Whole-body PET Patlak imaging 60-90min post-injection employing a population-based input function. J Nucl Med 2015; 56( suppl 3): 1786.https://jnm.snmjournals.org/content/56/supplement_3/1786. 26338899 [Google Scholar]
- 35. Karakatsanis NA, Lodge MA, Zhou Y, Wahl RL, Rahmim A. Dynamic whole-body PET parametric imaging: II. Task-oriented statistical estimation. Phys Med Biol 2013; 58( 20): 7419– 7445. [DOI] [PMC free article] [PubMed] [Google Scholar]
- 36. Soper DS. Significance of the Difference between Two Correlations Calculator. Available from https://www.danielsoper.com/statcalc. Published 2020. Accessed June 28, 2020.
- 37. Fisher RA. On the probable error of a coefficient of correlation deduced from a small sample. Metron 1921; 1( 3): 32. [Google Scholar]
- 38. Koo TK, Li MY. A Guideline of Selecting and Reporting Intraclass Correlation Coefficients for Reliability Research. J Chiropr Med 2016; 15( 2): 155– 16. [Published correction appears in J Chiropr Med 2017;16(4):346.]. [DOI] [PMC free article] [PubMed] [Google Scholar]
- 39. Ueberschaer M, Vettermann FJ, Forbrig R, et al. Simpson Grade Revisited - Intraoperative Estimation of the Extent of Resection in Meningiomas Versus Postoperative Somatostatin Receptor Positron Emission Tomography/Computed Tomography and Magnetic Resonance Imaging. Neurosurgery 2020; 88( 1): 140– 146. [DOI] [PubMed] [Google Scholar]
- 40. Mahase SS, Roth O’Brien DA, No D, et al. [68Ga]-DOTATATE PET/MRI as an adjunct imaging modality for radiation treatment planning of meningiomas. Neurooncol Adv 2021; 3( 1): vdab012. [DOI] [PMC free article] [PubMed] [Google Scholar]
- 41. Seystahl K, Stoecklein V, Schüller U, et al. Somatostatin receptor-targeted radionuclide therapy for progressive meningioma: benefit linked to 68Ga-DOTATATE/-TOC uptake. Neuro Oncol 2016; 18( 11): 1538– 1547. [DOI] [PMC free article] [PubMed] [Google Scholar]
- 42. Makis W, McCann K, McEwan AJ. Rhabdoid papillary meningioma treated with 177Lu DOTATATE PRRT. Clin Nucl Med 2015; 40( 3): 237– 240. [DOI] [PubMed] [Google Scholar]


![(A–C) Three axial 68Ga-DOTATATE PET dynamic images (first, fourth, and ninth 5-minute frame) in a 66-year-old woman in group A with a history of World Health Organization grade II meningioma status after resection 4 months prior to imaging and (D–F) corresponding PET T1-weighted post-gadolinium-enhancement fusion images from 5-minute frames at (A, D) 10 minutes after injection, (B, E) 30 minutes after injection, and (C, F) 45 minutes after injection. (G) Corresponding reference tissue (superior sagittal sinus [SSS]) and targeted tissue (meningioma) region time-activity curves (TACs). DOTATATE = tetraazacyclododecane tetraacetic acid octreotate, 68Ga = gallium 68, p.i. = postinjection.](https://cdn.ncbi.nlm.nih.gov/pmc/blobs/5dc4/8965533/2253f1c23bfa/rycan.210067.fig1.jpg)

