

Abstract
Electrospray ionization (ESI) in-source fragmentation (ISF) has traditionally been minimized to promote precursor molecular ion formation, and therefore its value in molecular identification is underappreciated. In-source annotation algorithms have been shown to increase confidence in putative identifications by using ubiquitous in-source fragments. However, these in-source annotation algorithms are limited by ESI sources that are generally designed to minimize ISF. In this study, enhanced in-source fragmentation annotation (eISA) was created by tuning the ISF conditions to generate in-source fragmentation patterns comparable with higher energy fragments generated at higher collision energies as deposited in the METLIN MS/MS library, without compromising the intensity of precursor ions (median loss ≤10% in both positive and negative ionization modes). The analysis of 50 molecules was used to validate the approach in comparison to MS/MS spectra produced via data dependent acquisition (DDA) and data independent acquisition (DIA) mode with quadrupole time-of-flight mass spectrometry (QTOF-MS). Enhanced ISF as compared to QTOF DDA enabled higher peak intensities for the precursor ions (median: 18 times in negative mode and 210 times in positive mode), with the eISA fragmentation patterns consistent with METLIN for over 90% of the molecules with respect to fragment relative intensity and m/z. eISA also provides higher peak intensity as opposed to QTOF DIA for over 60% of the precursor ions in negative mode (median increase: 20%) and for 88% of the precursor ions in positive mode (median increase: 80%). Molecular identification with eISA was also successfully validated from the analysis of a metabolic extract from macrophages. An interesting side benefit of enhanced ISF is that it significantly improved molecular identification confidence with low resolution single quadrupole mass-spectrometry-based untargeted LC/MS experiments. Overall, enhanced ISF allowed for eISA to be used as a more sensitive alternative to other QTOF DIA and DDA approaches, and further, it enabled the acquisition of ESI TOF and ESI single quadrupole mass spectrometry instrumentation spectra with improved molecular identification confidence.
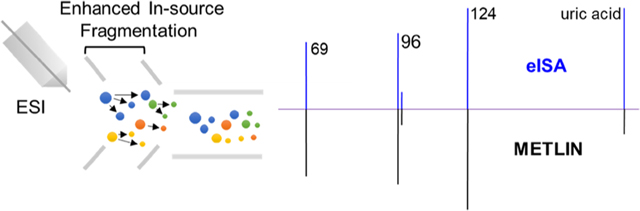
Graphical Abstract
Untargeted liquid chromatography electrospray ionization (ESI) mass spectrometry (LC-MS) experiments aim to capture the information for all the small molecules present in both biological and chemical sample analyses.1–5 However, the annotation and identification of the thousands of features typically detected in LC-MS experiments remain a critical challenge.6–8 It is well-known that in addition to molecular ions, LC-MS1 data also contain adducts, isotopes, multimers, in-source fragments, contaminants, etc., which can significantly impact annotation.6,7,9
In-source fragmentation (ISF) is a naturally occurring phenomenon in atmospheric ion sources.10–13 ESI is considered among the softest ionization technologies with the least ISF, however, even in the ESI source, unintentional ISF widely exists.7,14 The fragmentation pattern generated by ISF in the ESI source is similar to the low-energy collision-induced dissociation (CID) MS/MS spectra.7 This similarity allows retrieving level 2 putative identifications—based on the guidelines from the Metabolomics Standards Initiative—in cases where diagnostic fragments or neutral losses consistent with a specific structure are observed.7 For example, ISF of coumaric acid and phosphocholine are similar to the 0 and 10 eV MS/MS spectra reported in the METLIN database, respectively.7 These lower molecular weight in-source fragment ions may lead to false positives in compound identification, especially when the in-source fragment ions correlate with precursor ions of other molecules that elute at similar chromatographic retention times.14,15 For example, pipecolic acid, an in-source fragment ion of lysine, elutes at the same retention time with lysine. ISF-induced mis-annotation has been widely observed in the literature. In another example, Xu et al. found that correct identification of 21 out of 130 routinely monitored water-soluble intracellular metabolites in the yeast metabolome are impacted by in-source fragment ions.14 In-source cyclization of glutamine and glutamate to pyroglutamate have also been reported.16 In a lipidomics study conducted in ESI negative ionization, 40 of the 100 most abundant masses corresponding to unique phospholipids in the plasma metabolome were artifacts from ISF.15
Current efforts have been focused on minimizing or eliminating ISF to reduce the spectral complexity in untargeted LC-MS experiments by adjusting the in-source parameters.14,15 However, completely removing ISF while retaining metabolite coverage and sensitivity would be only possible with the design of novel ionization techniques. Instead, ESI in-source fragments present in untargeted MS1 data can be used for feature and molecular annotation.7,17–19 In a previous study, our group developed an approach called METLIN-guided in-source annotation (MISA) specifically intended for ISF annotation using experimental low-energy MS/MS spectra in the METLIN library.7 MISA leverages the fact that in-source and low-energy MS/MS fragmentations are similar as they are generated by collision under electric fields.7 In that sense, MISA consists of matching peaks observed in MS1 data against low-energy MS/MS spectra from the METLIN database.7 This allows a rapid metabolite annotation to facilitate preliminary data analysis and target MS/MS method design for metabolite identity confirmation.7 However, under standard ion source conditions, ISF can only mimic low energy MS/MS spectra, typically from 0 to 10 eV.7 Not all molecules undergo ISF at low energy, or they yield a small number of in-source fragments. This hampers the correct annotation of some molecules due to the low specificity of these fragments.
Currently, MS1 metabolite profiling is normally conducted in the first step in a typical LC-MS based untargeted experiment, followed by MS/MS spectra generation in the collision cell. Data-dependent acquisition (DDA) is generally used to produce MS/MS spectra of a target precursor ion for compound identification by matching it to library spectra. However, due to the nature of DDA, MS/MS spectra for some precursor ions cannot be generated, especially for low abundance ions. Alternatively, data-independent acquisition (DIA) techniques were designed to collect full MS/MS spectra on low abundance analytes, such as the SWATH acquisition in SCIEX instruments.20
Here, we demonstrated that enhancing ISF enables acquiring the pseudo MS/MS spectra for a broad range of molecules comparable to those produced by DDA or DIA, thus demonstrating the utility of this method as an alternative to DIA methods without incurring significant losses of precursor ion intensity due to collision-induced dissociation within a collision cell. In this study, we optimized the MISA workflow by enhancing ISF to generate metabolite in-source fragments that are comparable to the 20 eV MS/MS spectra in the METLIN library, as shown in Figure 1. The performance of enhanced in-source fragmentation annotation (eISA) was evaluated by the analysis of 50 endogenous metabolites using two indicators, the number of fragments that matched to the library (ratio score) and the relative intensity similarity between experimental and library mass spectra (match factor). Compared with the traditional MS/MS acquisition techniques, including both DDA and DIA, eISA demonstrated a comparable fragmentation pattern, higher peak intensity for precursor ions, and better precursor ion sensitivity for the select molecules. On the basis of the MS1 spectra generated with eISA, we successfully identified metabolites in a macrophage extract, confirmed by the analysis of pure standards under the same analytical conditions. Further, the eISA strategy was applied in the putative compound identification using single quadrupole mass spectrometry-based untargeted data. Our results indicated that eISA is a novel and much simplified DIA strategy for compound identification in LC-MS based untargeted experiments.
Figure 1.

eISA enhanced ISF fragmentation pattern compared to both nonenhanced ISF as well as METLIN’s 20 eV MS/MS spectra for uric acid in the negative mode (ESI(−)).
EXPERIMENTAL SECTION
Materials/Metabolite Extraction.
Information regarding the materials used in this study and the metabolite extraction procedure in the macrophage samples is provided in the Supporting Information (Experimental Section).
High-Resolution Mass Spectrometry Analysis.
Detailed information regarding the high-resolution mass spectrometry analysis is provided in the Supporting Information (Experimental Section). Briefly, liquid chromatography electrospray ionization quadrupole time-of-flight mass spectrometry (LC-ESI-QTOF-MS; BRUKER impact II) was used to acquire the mass spectra. And a ZORBAX 300 SB-C18 column (0.5 × 150 mm, 5 μm, Agilent) and Luna NH2 100 Å column (1 × 150 mm, 3 μm, Phenomenex) were used in the separation of metabolites in reverse phase (positive mode) and HILIC analysis (negative mode), respectively.
Single Quadrupole Mass Spectrometry Analysis.
An Agilent InfinityLab Liquid Chromatography/Mass Selective Detector (LC-MSD) system was used in the experiment. Detailed information regarding the single quadrupole mass spectrometry analysis of the metabolite mixture is provided in the Supporting Information (Experimental Section).
Data Analysis.
The eISA approach considers each molecule in the spectral library (e.g., METLIN) as an analysis target. By using this metabolite-centric approach, a direct link between the precursor ion and the fragments was established in the MS1 data produced by eISA techniques. Both ratio score and match factor were used to evaluate the fragmentation pattern similarity between eISA technique and other techniques.7 Detailed molecular identification procedure using eISA is explained in the Supporting Information (Experimental Section).
RESULTS AND DISCUSSION
In-Source Fragmentation Condition Optimization.
This study aimed to find in-source fragmentation conditions in which more fragments can be generated without compromising the intensity of precursor ions (Figure 1). Specifically, the aim was to generate mass spectral data including both the high abundance precursor ions and their corresponding in-source fragments for confident compound identification within a single run in full scan mode. The 20 eV MS/MS spectra in the METLIN library, produced in the collision cell with analytical standards, was used as a reference for the optimization process. The eISA condition was achieved by optimizing the transfer isCID energy, the energy between ion funnel 1 and ion funnel 2 in the BRUKER impact II. A mixture of 50 endogenous metabolites (30 μM) was analyzed by varying transfer isCID energy (from 0 to 100 eV in 10 eV increments). These metabolites were all observed in negative mode, and their MS/MS spectra at −20 eV were all available in the METLIN library, however, in positive mode, only 33 metabolites were observed. Three factors were mainly considered in selecting the appropriate ISF condition: the number and relative intensity of fragments that matched to 20 eV MS/MS spectra in the METLIN database and the intensity of precursor ion. Finally, 40 and 30 eV of isCID energy were selected as the eISA condition in negative and positive mode, respectively, with all other parameters fixed. The detailed information regarding the ISF condition optimization is provided in the Supporting Information (In-Source Fragmentation Condition Optimization Results Section; Table S1 and Figure S1).
eISA vs QTOF DDA Mode.
Fragmentation patterns produced by targeted MS/MS in high resolution mass spectrometry are considered the gold standard in compound identification. Here, fragmentation data were acquired using eISA and QTOF DDA (acquired at a collision energy of 20 eV).
Two indicators, ratio score and matching factor, were used to evaluate the similarity of fragmentation pattern between eISA and QTOF DDA mode (see Data Analysis in Supporting Information). The ratio score was calculated as a fraction with the denominator as the total number of fragments produced in DDA mode and numerator as the number of fragments produced in eISA mode (Table 1). Thus, the fragmentation pattern between the two techniques is more similar if more fragments in the 20 eV QTOF DDA spectra are found in eISA MS1 data. When considering the fragments with a relative intensity above 5%, 34 out of 50 molecules in negative mode and 17 out of 33 molecules in positive mode had all the fragments matched between the two approaches; when considering those fragments with a relative intensity above 30%, the numbers increased to 46 out of 50 in negative mode and 30 out of 33 in positive mode, respectively (Figure S2a). Since major fragment ions (≥30% relative intensity) are vital in MS/MS fragmentation pattern matching, eISA demonstrated the capability to generate fragments comparable to the DDA mode for 92% metabolites studied. On the other hand, the similarity of the fragmentation patterns generated by the two approaches (eISA and QTOF DDA) was further evaluated by calculating match factors for those metabolites with over three fragments, as opposed to the ratio score, the match factor takes into account the intensity of the fragments. As seen in Table 1 and Figure S2b, the match factors ranged from 10% to 100% (median: 87%) in negative mode and from 14% to 100% (median: 71%) in positive mode, respectively, suggesting good spectra fragment similarity for most molecules between the two methods.
Table 1.
Fragmentation Pattern Comparison between Mass Spectra Acquired with eISA Mode and QTOF DDA Mode (20 eV)
| ESI(−) | ESI(+) | |||||
|---|---|---|---|---|---|---|
|
|
|
|||||
| no. | name | scorea | M.F.b | name | score | M.F. |
| 1 | aspartate | 4/4 | 95 | |||
| 2 | malate | 4/4 | 80 | |||
| 3 | adenine | 2/4 | 100 | adenine | 2/3 | 100 |
| 4 | hypoxanthine | 2/3 | 100 | hypoxanthine | 2/5 | 95 |
| 5 | sulfoacetic acid | 2/2 | ||||
| 6 | glutamine | 8/9 | 84 | glutamine | 3/3 | 28 |
| 7 | glutamate | 2/2 | glutamate | 3/3 | 63 | |
| 8 | methionine | 1/1 | methionine | 6/7 | 42 | |
| 9 | xanthine | 2/2c | 100 | xanthine | 1/4 | 99 |
| 10 | aminoadipic acid | 5/6c | 96 | aminoadipic acid | 4/5 | 57 |
| 11 | phenylalanine | 4/5 | 87 | phenylalanine | 2/2 | |
| 12 | phosphoenol pyruvate | 1/1 | ||||
| 13 | uric acid | 4/4 | 100 | |||
| 14 | glyceraldehyde-3P | 2/2 | ||||
| 15 | arginine | 1/1 | arginine | 4/4 | 41 | |
| 16 | tyrosine | 4/4 | 88 | tyrosine | 8/9 | 73 |
| 17 | acetyl-glutamic acid | 5/6 | 87 | acetyl-glutamic acid | 4/4 | 89 |
| 18 | citric acid | 5/5 | 90 | |||
| 19 | tryptophan | 4/4 | 94 | tryptophan | 7/7 | 48 |
| 20 | myristic acid | 0/0 | ||||
| 21 | ribose-5-phosphate | 3/3 | 63 | |||
| 22 | cytidine | 5/5 | 100 | cytidine | 1/1 | |
| 23 | uridine | 6/6 | 98 | uridine | 1/3 | 100 |
| 24 | palmitic acid | 0/0 | palmitic acid | 12/12 | 62 | |
| 25 | glucose-6-phosphate | 3/3 | 94 | glucose-6-phosphate | 5/5c | 97 |
| 26 | fructose-6-phosphate | 3/3 | 94 | fructose-6-phosphate | 2/2 | |
| 27 | adenosine | 1/1 | adenosine | 1/1 | ||
| 28 | inosine | 1/1 | inosine | 1/1 | ||
| 29 | saccharopine | 7/14 | 97 | saccharopine | 2/4 | 68 |
| 30 | linoleic acid | 0/0 | ||||
| 31 | oleic acid | 0/0 | oleic acid | 23/25 | 77 | |
| 32 | guanosine | 3/3 | 100 | guanosine | 1/1 | |
| 33 | EPA | 1/7 | 94 | |||
| 34 | CMP | 3/3 | 71 | CMP | 2/2 | |
| 35 | UMP | 6/6 | 73 | UMP | 2/2 | |
| 36 | fructose-1,6-bisphosphate | 5/5 | 91 | |||
| 37 | AMP | 3/3 | 71 | AMP | 1/1 | |
| 38 | IMP | 3/5 | 81 | IMP | 1/2 | |
| 39 | GMP | 3/3 | 55 | GMP | 1/2 | |
| 40 | UDP | 4/9 | 17 | |||
| 41 | ADP | 5/7 | 25 | ADP | 2/2c | |
| 42 | GDP | 4/6 | 20 | GDP | 1/1 | |
| 43 | PG(16:0/0:0) | 1/3 | 99 | PG(16:0/0:0) | 2/3 | 100 |
| 44 | lysoPC(16:0) | 1/2c | 100 | lysoPC(16:0) | 1/3 | 14 |
| 45 | GTP | 8/8c | 23 | |||
| 46 | UDP-galactose | 3/4c | 10 | |||
| 47 | UDP-N-acetyl-glucosamine | 5/8 | 50 | |||
| 48 | oxidized glutathione | 9/9c | 60 | oxidized glutathione | 5/9 | 96 |
| 49 | dioleoylphosphatidic acid | 3/3c | 55 | |||
| 50 | acetyl-CoA | 4/4 | 64 | acetyl-CoA | 4/6 | 49 |
Score: ratio score.
M.F.: match factor.
The number of fragments found in DDA mode is less than that recorded in the 20 eV mass spectra in the METLIN database. Calculation of both score and M.F. was based on the mass spectra produced in QTOF DDA mode.
Next, the peak intensity of fragments was compared between the two approaches. Among all the fragments produced in negative mode, 49% of them had higher absolute intensities in eISA mode with a median of 0.91 times; 67% of fragments generated in the positive mode had higher absolute intensities in eISA mode with a median of 1.7 times (Figure S2c). This suggests that the intensity of most fragments generated in eISA mode is similar to or higher than that produced in the DDA mode.
Untargeted metabolomics studies often include two sets of experiments, MS1 metabolite profiling followed by MS/MS spectra generation for compound identification. In MS1 metabolite profiling, efforts are normally made to minimize the ISF to reduce the number of false positive features from in-source fragmentation; selected features are then analyzed for MS/MS spectra generation. Here, we show that, by enhancing ISF, putative identifications can be obtained with higher confidence based on in-source fragmentation patterns consistent with those generated by MS/MS experiments at 20 eV, without compromising the intensity of precursor ions.
It is worth noting that in DDA mode the absolute intensities of most precursor ions dropped significantly at higher collision energies in contrast to eISA. Overall, all the precursor ions observed in eISA mode had much higher absolute intensities than their counterparts acquired in the DDA mode with a median of 18-fold in negative mode and 210 fold in positive mode, respectively (Figure S2d). The quantitative relationship of the intensity of both precursor ions and fragments generated between eISA and DDA modes was exemplified with four metabolites, phenylalanine and tryptophan in positive mode and fructose-6-phosphate and oxidized glutathione in negative mode (Figure 2). This high abundance of precursor ions in eISA MS1 data allows tracing the parent ion of the generated fragments.
Figure 2.

Absolute peak intensity comparison for the precursor ions and the corresponding fragments of four metabolites (phenylalanine and tryptophan in positive mode; fructose-6-phosphate and oxidized glutathione in negative mode) acquired between QTOF DDA mode (20 eV) and eISA mode. 1Score: ratios score. 2M.F.: match factor. 3Only six in nine fragments of oxidized glutathione were shown here.
A useful feature of eISA mode is that fragment ions can be generated across a broad dynamic range of ion intensities. However, a low intensity of precursor ions can compromise DDA MS/MS fragmentation pattern generation. For the investigation of sensitivity, a mixture of four metabolites in positive and negative ionization mode was analyzed by eISA and DDA at nine concentrations ranging 6 orders of magnitude: 1 nM, 10 nM, 100 nM, 1 μM, 10 μM, 50 μM, 100 μM, 500 μM, and 1 mM (see Experimental Section in the Supporting Information for details). For example, in the DDA analysis in negative mode, two fragments of tyrosine with a relative intensity of 42% and 27%, respectively, were missing at 10 μM while many interfering high abundance fragments were observed, which could be problematic in the identification process (Table S2 and Figure S3). However, eISA generated two major fragments of tyrosine, with a relative intensity of 100% and 90%, respectively, even at 1 nM, with high abundance precursor ions (Table S2). Further, we calculated the limit of detection (LOD) for each metabolite determined as the precursor ion intensity being 3 times the signal/noise ratio. As shown in Table S3, eISA exhibited 1 to 2 orders of magnitude lower LOD than DDA.
Overall, compared with QTOF DDA-based MS/MS approaches, eISA can generate full scan mass spectra (MS1) containing both the precursor ion and its fragments within a single run. It enables maximum information collection even for analytes at low levels which may be missed with DDA. The high intensities of precursor ions observed in MS1 generated with eISA increases sensitivity and confidence in compound identification. By delivering 1 to 2 orders of magnitude deeper sensitivity, the eISA technique may enable the application of high-resolution mass spectrometry in full scan mode for direct low abundant metabolite identification and relative quantification.
eISA and QTOF DIA.
Similar to eISA, data independent acquisition (DIA) with high-resolution mass spectrometry does not require the initial detection of MS peaks to proceed to MS/MS analysis. In the BRUKER impact II system, the DIA technique is called Broadband Collision Induced Dissociation (bbCID). No precursor ion isolation is required in DIA mode, and all ions are fragmented in the collision cell, resulting in the generation of DIA MS/MS spectra across every LC peak. The workflows for the two techniques are illustrated in Figure 3a and b, respectively.
Figure 3.

Molecular in-source and collision cell dissociation in panels a and b for eISA and QTOF DIA, respectively. Panel c shows the vertical scatter plot with median match factor (eISA vs QTOF DIA) across different ionization modes. Panel d shows eISA precursor ion intensity/QTOF DIA precursor ion intensity ratios in different ionization modes with the black line representing the median. Panel e shows the absolute intensity ratio of fragments (median plus 95% CI) between eISA and QTOF DIA techniques. MS/MS spectra in the QTOF DIA mode were generated at 20 eV.
We first compared the mass spectra of the select molecules generated by the two approaches. The number of fragments generated with eISA that matched to 20 eV MS/MS spectra generated in DIA mode were calculated as a ratio score. As shown in Table S4, 33 in 50 metabolites had all the fragments matched between the two techniques in the negative mode; in the positive mode, 16 of 33 metabolites had a complete match between the two approaches. In general, over 90% molecules at both polarities had at least half the number of the fragments produced with eISA, compared to the DIA (Table S4). We then calculated the match factors to assess the similarity of the fragment spectra generated by the two techniques. In the negative mode, the median match factor was 82% and 68% molecules had a match factor over 60%; separately in the positive mode, the median match factor was 81% and 86% molecules had a match factor over 60% (Table S4; Figure 3c). This suggests a good match for the fragmentation patterns produced by the two techniques.
To explore the advantages of eISA over DIA, we compared the absolute intensities of the precursor ions and fragments for all the metabolites produced using the two techniques. In the negative mode, an increase of the absolute intensity was observed in over 60% of precursor ions acquired with eISA at a median of 1.2 times; in the positive mode, the increase was observed in 88% of precursor ions at a median of 1.8 times (Figure 3d). This indicates that most precursor ions generated with eISA have equal or higher intensity opposed to that acquired with DIA. We further investigated the precursor ion sensitivity of the two approaches with the mixture of four metabolites at each polarity mentioned earlier, and eISA demonstrated equal or better sensitivity with the tested metabolites (Table S3). This improvement observed with eISA may be explained by its unique fragmentation mechanism. A DIA experiment is normally run within a predefined duty cycle, which may limit the fragmentation of low abundant analytes in the collision cell. However, eISA fragments every peak simultaneously without the limit of cycle time. For the fragments, most peaks produced in both negative (92%) and positive (86%) ionization modes are higher with DIA by a median of 4.3 and 4.6 times, respectively (Figure 3e).
Overall, instead of submitting the MS1 with many in-source fragments to the collision cell for MS/MS acquisition as in DIA, eISA produces the pseudo MS/MS spectra for molecules comparable to the 20 eV MS/MS spectra produced in the DIA mode. This technique demonstrates equal or better precursor ion sensitivity of eISA for the studied molecules.
Application of eISA for Metabolite Annotation in Untargeted Metabolomics.
To illustrate the capacity of eISA in compound identification in untargeted metabolomics, we analyzed metabolites from a murine macrophage-like cell line (RAW264.7) in the enhanced ISF condition using high resolution mass spectrometry (QTOF-MS). eISA acquired the MS1 data containing all the molecular ions in the sample and their fragment ions. Table 2 shows the list of correctly annotated metabolites using eISA. Thirteen compounds were identified in both positive and negative modes (Table 2). Of the 50 molecules studied, we successfully identified the presence of 41 metabolites in the macrophage extracts based on two indicators, ratio score and match factor, by matching to the 20 eV MS/MS spectra in the METLIN database (Table 2). eISA also identified the presence of metabolites in the macrophages extract beyond the list, such as itaconate (Table 2). The identifications were confirmed by the analysis of analytical standards.
Table 2.
List of Correctly Identified Molecules in a Macrophage Extract with the MS1 Spectra Acquired with eISA Technique
| ESI(−) | ESI(+) | |||||
|---|---|---|---|---|---|---|
|
|
|
|||||
| no. | name | scorea | M.F.b | name | score | M.F. |
| 1 | itaconic acid | 1/1 | ||||
| 2 | aspartate | 3/4 | 82 | |||
| 3 | malate | 4/4 | 35 | |||
| 4 | adenine | 2/4 | 97 | |||
| 5 | hypoxanthine | 1/3 | 92 | |||
| 6 | sulfoacetic acid | 1/2 | ||||
| 7 | glutamine | 7/9 | 55 | glutamine | 3/3 | 25 |
| 8 | glutamate | 2/2 | glutamate | 3/3 | 71 | |
| 9 | methionine | 1/1 | methionine | 5/7 | 10 | |
| 10 | xanthine | 1/3 | 99 | |||
| 11 | aminoadipic acid | 5/7 | 74 | |||
| 12 | phenylalanine | 4/5 | 39 | phenylalanine | 2/2 | |
| 13 | phosphoenol pyruvate | 1/1 | ||||
| 14 | uric acid | 4/4 | 78 | |||
| 15 | arginine | 1/1 | arginine | 2/4 | 20 | |
| 16 | tyrosine | 3/4 | 91 | tyrosine | 8/9 | 61 |
| 17 | citric acid | 5/5 | 73 | |||
| 18 | tryptophan | 4/4 | 48 | tryptophan | 7/7 | 22 |
| 19 | ribose-5-phosphate | 3/3 | 80 | |||
| 20 | cytidine | 2/5 | 65 | |||
| 21 | uridine | 6/6 | 93 | |||
| 22 | palmitic acid | 0/0 | palmitic acid | 12/12 | 57 | |
| 23 | inosine | 1/1 | inosine | 1/1 | ||
| 24 | saccharopine | 7/14 | 10 | saccharopine | 3/4 | 55 |
| 25 | linoleic acid | 0/0 | ||||
| 26 | oleic acid | 0/0 | oleic acid | 24/25 | 27 | |
| 27 | EPA | 3/7 | 93 | |||
| 28 | CMP | 3/3 | 66 | |||
| 29 | UMP | 6/6 | 64 | |||
| 30 | fructose-1,6-bisphosphate | 5/5 | 26 | |||
| 31 | AMP | 3/3 | 52 | |||
| 32 | IMP | 4/5 | 78 | |||
| 33 | GMP | 3/3 | 61 | |||
| 34 | UDP | 6/9 | 72 | |||
| 35 | ADP | 4/7 | 64 | |||
| 36 | GDP | 4/6 | 42 | |||
| 37 | PG(l6:0/0:0) | 1/3 | 98 | PG(16:0/0:0) | 3/3 | 100 |
| 38 | GTP | 8/10 | 32 | |||
| 39 | UDP-galactose | 4/6 | 25 | |||
| 40 | UDP-N-acetyl-glucosamine | 4/8 | 52 | |||
| 41 | oxidized glutathione | 8/10 | 69 | oxidized glutathione | 5/9 | 85 |
| 42 | acetyl-CoA | 2/4 | 67 | |||
Score: ratio score.
M.F.: match factor. Calculation of both ratio score and match factor were based on the 20 eV MS/MS spectra in the METLIN library.
eISA and Compound Identification with an ESI Single Quadrupole MS.
The striking similarity between ESI in-source fragments of small molecules and MS/MS data may enable untargeted experiments on more general (simple) MS platforms, such as single quadrupole instruments. To examine this possibility, we analyzed the mixture of 50 molecules using an LC ESI single quadrupole MS at two fragmentor voltages, one of the key parameter settings in tuning the instrument’s in-source fragmentation energy. Compounds with easily fragmented chemical structures (e.g., amino acids) typically fragment at low fragmentor voltages while others (e.g., lipids) fragment at higher voltages, which may preclude the observation of precursor ions for the more fragile molecules. To compensate for variability in structural vulnerability to fragmentor voltage, we selected two fragmentor voltages, 150 and 300 V, to produce in-source fragments for those compounds requiring low and high collision energies, respectively. Overall, in-source fragment information consistent with METLIN data was successfully acquired for 36 of the 50 molecules (30 in positive mode and 36 in negative mode). To identify the molecule, the number of hits against the METLIN library ranged from 1 to 305 with a median of 34 (n = 66) when only using the precursor ion information (Figure 4). However, when the in-source fragments information was also considered, the number of hits significantly dropped to a level comparable with that obtained using high resolution mass spectrometry, as shown in Figure 4. Our results demonstrated that eISA strategy enabled single quadrupole MS based untargeted LC/MS data sets to be more useful.
Figure 4.

Number of hits obtained in the METLIN library when searching (a) precursor m/z as well as precursor plus fragmentation (eISA) data acquired from single quadrupole MS and (b) precursor m/z as well as precursor plus fragmentation (eISA) data acquired from QTOF (n = 66).
It should be noted that the ESI single quadrupole used in these experiments is a much lower sensitivity instrument with a limited dynamic range as compared to the QTOF used in the previous studies. However, and similar to many database-based untargeted LC-MS workflows, compounds that can be identified with eISA are limited to the compounds included in the METLIN MS/MS spectral database. For the identification of truly unknown compounds, targeted MS/MS analysis is still required to produce reliable MS/MS spectra for structural confirmation. Further, only a Bruker QTOF instrument and Agilent single quadrupole MS were examined for the validation of eISA strategy in this study.
CONCLUSIONS
LC-MS experiments are typically designed to minimize in-source fragmentation; however, this study demonstrates that enhancing ISF can be used to improve confidence in compound identification from MS1 experiments. Enhanced ISF can provide in-source fragments similar to 20 eV MS/MS spectra in the METLIN library in terms of intensity and number of fragments, thus allowing a straightforward and robust metabolite annotation to significantly facilitate subsequent metabolite identification. METLIN currently has the experimental MS/MS spectra for over 700 000 molecules, making eISA a promising approach for the autonomous and robust annotation and identification of a broad range of metabolites and small molecules.
Compared with the other DDA and DIA approaches, higher precursor ion sensitivity ranging from 1 to 2 orders of magnitude was observed over DDA while eISA provided equal or higher sensitivity as compared to DIA. Further, eISA enables MS1 data acquired on ESI time-of-flight and quadrupole instruments (single and triple) to be more useful for molecular identification. This last point is particularly compelling, as eISA will allow for untargeted LC/MS experiments to be performed with a significantly higher level of annotation confidence on the tens of thousands of quadrupole instruments currently relegated to MS1 experiments.
Supplementary Material
ACKNOWLEDGMENTS
This research was partially funded by National Institutes of Health grants R35 GM130385, P30 MH062261, P01 DA026146, and U01 CA235493 and by Ecosystems and Networks Integrated with Genes and Molecular Assemblies (ENIGMA), a Scientific Focus Area Program at Lawrence Berkeley National Laboratory for the U.S. Department of Energy, Office of Science, Office of Biological and Environmental Research, under contract number DE-AC02-05CH11231.
Footnotes
ASSOCIATED CONTENT
Supporting Information
The Supporting Information is available free of charge at https://pubs.acs.org/doi/10.1021/acs.analchem.0c00409.
Experimental section, in-source fragmentation condition optimization results section, Table S1–S4, Figure S1–S3 (PDF)
Complete contact information is available at: https://pubs.acs.org/10.1021/acs.analchem.0c00409
Contributor Information
Jingchuan Xue, Scripps Center for Metabolomics and Department of Molecular and Computational Biology, The Scripps Research Institute, La Jolla, California 92037, United States.
Xavier Domingo-Almenara, Centre for Omic Sciences, EURECAT − Technology Centre of Catalonia and Rovira i Virgili University Joint Unit, Reus, Catalonia, Spain.
Carlos Guijas, Scripps Center for Metabolomics and Department of Molecular and Computational Biology, The Scripps Research Institute, La Jolla, California 92037, United States.
Amelia Palermo, Scripps Center for Metabolomics and Department of Molecular and Computational Biology, The Scripps Research Institute, La Jolla, California 92037, United States.
Markus M. Rinschen, Scripps Center for Metabolomics and Department of Molecular and Computational Biology, The Scripps Research Institute, La Jolla, California 92037, United States
John Isbell, Discovery Chemistry, Genomics Institute of the Novartis Research Foundation, Metabolism and Pharmacokinetics, San Diego, California 92121, United States.
H. Paul Benton, Scripps Center for Metabolomics and Department of Molecular and Computational Biology, The Scripps Research Institute, La Jolla, California 92037, United States.
Gary Siuzdak, Scripps Center for Metabolomics and Department of Molecular and Computational Biology, The Scripps Research Institute, La Jolla, California 92037, United States.
REFERENCES
- (1).Johnson CH; Ivanisevic J; Siuzdak G. Nat. Rev. Mol. Cell Biol 2016, 17 (7), 451–9. [DOI] [PMC free article] [PubMed] [Google Scholar]
- (2).Yanes O; Tautenhahn R; Patti GJ; Siuzdak G. Anal. Chem 2011, 83 (6), 2152–61. [DOI] [PMC free article] [PubMed] [Google Scholar]
- (3).Domingo-Almenara X; Montenegro-Burke JR; Benton HP; Siuzdak G. Anal. Chem 2018, 90 (1), 480–89. [DOI] [PMC free article] [PubMed] [Google Scholar]
- (4).Guijas C; Montenegro-Burke JR; Domingo-Almenara X; Palermo A; Warth B; Hermann G; Koellensperger G; Huan T; Uritboonthai W; Aisporna AE; Wolan DW; Spilker ME; Benton HP; Siuzdak G. Anal. Chem 2018, 90 (5), 3156–64. [DOI] [PMC free article] [PubMed] [Google Scholar]
- (5).Zhou B; Xiao JF; Tuli L; Ressom HW Mol. BioSyst 2012, 8 (2), 470–81. [DOI] [PMC free article] [PubMed] [Google Scholar]
- (6).Senan O; Aguilar-Mogas A; Navarro M; Capellades J; Noon L; Burks D; Yanes O; Guimera R; Sales-Pardo M. Bioinformatics 2019, 35 (20), 4089–97. [DOI] [PMC free article] [PubMed] [Google Scholar]
- (7).Domingo-Almenara X; Montenegro-Burke JR; Guijas C; Majumder EL; Benton HP; Siuzdak G. Anal. Chem 2019, 91 (5), 3246–53. [DOI] [PMC free article] [PubMed] [Google Scholar]
- (8).Mahieu NG; Patti GJ Anal. Chem 2017, 89 (19), 10397−10406. [DOI] [PMC free article] [PubMed] [Google Scholar]
- (9).Lu W; Su X; Klein MS; Lewis IA; Fiehn O; Rabinowitz JD Annu. Rev. Biochem 2017, 86, 277–304. [DOI] [PMC free article] [PubMed] [Google Scholar]
- (10).Abranko L; Garcia-Reyes JF; Molina-Diaz AJ Mass Spectrom. 2011, 46 (5), 478–88. [DOI] [PubMed] [Google Scholar]
- (11).Pais P; Moyano E; Puignou L; Galceran MT J. Chromatogr A 1997, 775 (1−2), 125–36. [DOI] [PubMed] [Google Scholar]
- (12).Tian Q; Duncan CJ; Schwartz SJ J. Mass Spectrom. 2003, 38 (9), 990–5. [DOI] [PubMed] [Google Scholar]
- (13).Wickens JR; Sleeman R; Keely BJ Rapid Commun. Mass Spectrom 2006, 20 (3), 473–80. [DOI] [PubMed] [Google Scholar]
- (14).Xu YF; Lu W; Rabinowitz JD Anal. Chem 2015, 87 (4), 2273–81. [DOI] [PMC free article] [PubMed] [Google Scholar]
- (15).Gathungu RM; Larrea P; Sniatynski MJ; Marur VR; Bowden JA; Koelmel JP; Starke-Reed P; Hubbard VS; Kristal BS Anal. Chem 2018, 90 (22), 13523−13532. [DOI] [PMC free article] [PubMed] [Google Scholar]
- (16).Purwaha P; Silva LP; Hawke DH; Weinstein JN; Lorenzi PL Anal. Chem 2014, 86 (12), 5633–7. [DOI] [PMC free article] [PubMed] [Google Scholar]
- (17).Wu JL; Liu J; Cai Z. Rapid Commun. Mass Spectrom 2010, 24 (13), 1828–34. [DOI] [PubMed] [Google Scholar]
- (18).Carrier DJ; Eckers C; Wolff JC J. Pharm. Biomed. Anal 2008, 47 (4−5), 731–7. [DOI] [PubMed] [Google Scholar]
- (19).Seitzer PM; Searle BC J. Proteome Res 2019, 18 (2), 791–96. [DOI] [PubMed] [Google Scholar]
- (20).Yin Y; Wang R; Cai Y; Wang Z; Zhu ZJ Anal. Chem 2019, 91 (18), 11897−11904. [DOI] [PubMed] [Google Scholar]
Associated Data
This section collects any data citations, data availability statements, or supplementary materials included in this article.