

Abstract
A library of 23 synthetic heparan sulfate (HS) oligosaccharides, varying in chain length, types, and positions of modifications, was used to analyze the substrate specificities of heparin lyase III enzymes from both Flavobacterium heparinum and Bacteroides eggerthii. The influence of specific modifications, including N-substitution, 2-O sulfation, 6-O sulfation, and 3-O sulfation on lyase III digestion was examined systematically. It was demonstrated that lyase III from both sources can completely digest oligosaccharides lacking O-sulfates. 2-O Sulfation completely blocked cleavage at the corresponding site; 6-O and 3-O sulfation on glucosamine residues inhibited enzyme activity. We also observed that there are differences in substrate specificities between the two lyase III enzymes for highly sulfated oligosaccharides. These findings will facilitate obtaining and analyzing the functional sulfated domains from large HS polymer, to better understand their structure/function relationships in biological processes.
Keywords: glycomics, glycosaminoglycans, heparan sulfate, heparin lyase, mass spectrometry
Introduction
Heparan sulfate (HS) is a linear polysaccharide composed of alternating glucosamine (GlcN) and uronic acid residues (GlcA/IdoA) (Esko and Lindahl 2001). As a protein post-translational modification, HS attached to a core protein is found on the surface of almost all mammalian cells and in extracellular matrices, where it plays critical roles in key biochemical and developmental processes (Esko and Selleck 2002; Knelson et al. 2014). The protein-binding properties of HS depend largely on its fine structure (Chen et al. 2018; Qiu et al. 2018). However, the non-template–driven biosynthesis in the Golgi apparatus results in heterogeneity, including the pattern of O-sulfation, amine modifications, and stereochemistry of uronic acid, and thus poses serious analytical challenges. Although a few structural motif-function relationships of HS have been established, such as the well-known pentasaccharide for anticoagulant activity (Lindahl et al. 1979; Guerrini et al. 2008), the functions of numerous HS structures remain unknown.
Compositional analysis is often the first step for HS characterization, allowing investigators to observe the changes in HS of different biological processes (Chen et al. 2017; Raghunathan et al. 2018). Although these compositional methods are useful for HS characterization, protein-binding sequences contain critical sulfate groups along with other sulfate groups that are not critical and do not interfere with the binding (Lindahl and Kjellen 2013). It is necessary to determine the sequences of such oligosaccharide domains to gauge their spatial and temporal distributions in biological systems.
Recent developments in methods for on-line sequencing of HS oligosaccharides, including liquid chromatography tandem mass spectrometry (LC–MS/MS) (Wu et al. 2019), ion mobility–based tandem mass spectrometry (IMS-MS/MS) (Wei et al. 2019), and capillary zone electrophoresis-mass spectrometry (CZE-MS/MS) (Sanderson et al. 2018), allow separation and structural determination of HS oligosaccharides in a time-effective manner. Such on-line methods present opportunities to study the structural motifs of functional oligosaccharide domains in long HS chains and make it possible to understand the structure–function relationships at the domain level.
Thus, it is important to consider methods for analysis of the functional domains in long HS chains. Lyase digestion is useful to release and depolymerize intact HS chains (Xiao et al. 2011), along with chemical depolymerization (Gill et al. 2012; Zhang et al. 2020). Three type of heparin lyases have been studied and widely applied since the 1970s (Dietrich et al. 1973; Desai et al. 1993a; Desai et al. 1993b). Among these, lyase III (E.C. 4.2.2.8) cleaves regions with high content of GlcNAc residues (NA domain), while lyase I (E.C. 4.2.2.7) cleaves highly sulfated regions (NS domain). Lyase II has low selectivity and cleaves HS chains primarily to disaccharides, and tetrasaccharides that contain 3-O sulfation (Shriver et al. 2000). Considering that most known HS oligosaccharides that have biological functions are sulfated (Guerrini et al. 2008; Shriver et al. 2012; Zhao et al. 2017), lyase III digestion, which cleaves NA domains and leaves NS domains intact, has advantages for subsequent on-line sequencing of HS oligosaccharides.
However, many studies dealing with lyase III substrate specificity have been carried out on highly sulfated heparin, or heparin-derived oligosaccharides that differ in domain structure from HS found on cell surfaces or in extracellular matrices, which have much lower degrees of sulfation (Ledin et al. 2004; Shi and Zaia 2009; Raghunathan et al. 2018). Since lyase III cleaves primarily in lowly sulfated domains of HS, the substrate specificity of lyase III observed in heparin may not yield adequate understanding of its action against HS. Moreover, there are different sources of lyase III enzymes. Lyase III originating from Flavobacterium heparinum (now Pedobacter heparinus, lyase3F) was the earliest described (Galliher et al. 1981) and remains widely used. Lyase III from Bacteroides eggerthii (lyase3B) is also commercially available (carried by New England Biolabs, Ipswich, MA) and has been reported in recent studies (Raghunathan et al. 2018; Wu et al. 2018; Raghunathan et al. 2019; Raghunathan et al. 2020; Sethi et al. 2020). Yet, the differences in their substrate specificities have not been examined in detail.
Recently, we reported synthesis of a library of HS hexasaccharides that differs in backbone composition and pattern of O-sulfation including derivatives with and without 3-O-sulfation (Chopra et al. 2021). The compounds were employed to determine substrate specificities of lyases (I, II, and III) derived from B. eggerthii. In this study, we employed a number of these hexasaccharides in combination with range of HS-oligosaccharides that are unsulfated or have specific patterns of 6-O-sulfation to investigate and compare fine substrate specificities of lyase III from different sources (lyase3F and 3B).
Results
Influence of GlcN N-substitution on lyase III substrate specificity
Initially, lyase III digestion was performed using a set of synthetic oligosaccharides to investigate the influence of N-substitution of GlcN on lyase III digestion. A set of 12 oligosaccharides of varying degree of polymerization (dp, ranging from dp 4 to 9) were examined (oligosaccharide structures are shown in Table I). GT1-6 were composed of GlcNAc and GlcA residues, while GT7–12 were composed of GlcNS and GlcA residues. All of these compounds are devoid of O-sulfates.
Table I.
List of synthetic HS oligosaccharides employed for lyase III digestions study
| Compound | Structure* | Code** | |
|---|---|---|---|
| GT1 | Unsulfated | GlcNAc-GlcA-GlcNAc-GlcA-PNP | A0G0A0G0-PNP |
| GT2 | GlcA-GlcNAc-GlcA-GlcNAc-GlcA-PNP | G0A0G0A0G0-PNP | |
| GT3 | GlcNAc-GlcA-GlcNAc-GlcA-GlcNAc-GlcA-PNP | A0G0A0G0A0G0-PNP | |
| GT4 | GlcA-GlcNAc-GlcA-GlcNAc-GlcA-GlcNAc-GlcA-PNP | G0A0G0A0G0A0G0-PNP | |
| GT5 | GlcNAc-GlcA-GlcNAc-GlcA-GlcNAc-GlcA-GlcNAc-GlcA-PNP | A0G0A0G0A0G0A0G0-PNP | |
| GT6 | GlcA-GlcNAc-GlcA-GlcNAc-GlcA-GlcNAc-GlcA-GlcNAc-GlcA-PNP | G0A0G0A0G0A0G0A0G0-PNP | |
| GT7 | N-sulfated | GlcNS-GlcA-GlcNS-GlcA-PNP | S0G0S0G0-PNP |
| GT8 | GlcA-GlcNS-GlcA-GlcNS-GlcA-PNP | G0S0G0S0G0-PNP | |
| GT9 | GlcNS-GlcA-GlcNS-GlcA-GlcNS-GlcA-PNP | S0G0S0G0S0G0-PNP | |
| GT10 | GlcA-GlcNS-GlcA-GlcNS-GlcA-GlcNS-GlcA-PNP | G0S0G0S0G0S0G0-PNP | |
| GT11 | GlcNS-GlcA-GlcNS-GlcA-GlcNS-GlcA-GlcNS-GlcA-PNP | S0G0S0G0S0G0S0G0-PNP | |
| GT12 | GlcA-GlcNS-GlcA-GlcNS-GlcA-GlcNS-GlcA-GlcNS-GlcA-PNP | G0S0G0S0G0S0G0S0G0-PNP | |
| GT13 | N- and O-sulfated, GlcA only | GlcA-GlcNS-GlcA-GlcNS-GlcA-GlcNS-GlcA-GlcNS6S-GlcA-PNP | G0S0G0S0G0S0G0S6G0-PNP |
| GT14 | GlcA-GlcNS-GlcA-GlcNS-GlcA-GlcNS6S-GlcA-GlcNS6S-GlcA-PNP | G0S0G0S0G0S6G0S6G0-PNP | |
| GT15 | GlcA-GlcNS-GlcA-GlcNS6S-GlcA-GlcNS6S-GlcA-GlcNS6S-GlcA-PNP | G0S0G0S6G0S6G0S6G0-PNP | |
| GT16 | GlcA-GlcNS6S-GlcA-GlcNS6S-GlcA-GlcNS6S-GlcA-GlcNS6S-GlcA-PNP | G0S6G0S6G0S6G0S6G0-PNP | |
| B10 | N-and O-sulfated, IdoA only | GlcA-GlcNS6S-IdoA-GlcNS6S-IdoA-GlcNS6S-R | G0S6I0S6I0S6-R |
| B12 | GlcA-GlcNS6S-IdoA2S-GlcNS6S-IdoA-GlcNS6S-R | G0S6I2S6I0S6-R | |
| B16 | GlcA-GlcNS6S-IdoA-GlcNS6S-IdoA2S-GlcNS6S-R | G0S6I0S6I2S6-R | |
| B1 | N- and O-sulfated with 3-O-sulfation | GlcA-GlcNS6S-GlcA-GlcNS3S6S-GlcA-GlcNS6S-R | G0S6G0S9G0S6-R |
| B3 | GlcA-GlcNS6S-IdoA-GlcNS3S6S-GlcA-GlcNS6S-R | G0S6I0S9G0S6-R | |
| B7 | GlcA-GlcNS6S-GlcA-GlcNS3S6S-IdoA-GlcNS6S-R | G0S6G0S9I0S6-R | |
| B9 | GlcA-GlcNS6S-IdoA-GlcNS3S6S-IdoA-GlcNS6S-R | G0S6I0S9I0S6-R |
* PNP = p-nitrophenol and R = (CH2)5-NH2.
* * G0, GlcA; I0, IdoA; I2, IdoA2S; A0, GlcNAc; S0, GlcNS; S6, GlcNS6S; S9, GlcNS3S6S.
GT1-6 were digested exhaustively using lyase3B or lyase3F. As shown in Figure 1A–F, for lyase 3B, no digestion product larger than disaccharide was detected for any substrate. Extracted ion chromatograms of lyase3B digestion of GT2 were shown as a representation of the LC separation of products (in Supplementary Figure S1), and the list of observed products was shown in Supplementary Table SI. Similar results were obtained for lyase3F, as shown in Supplementary Figure S2. In summary, all of these oligosaccharides produced internal disaccharide (D0A0, m/z 378.1, Figure 1G) and an unsaturated GlcA residue with reducing end (RE) modification (D0-PNP, m/z 296.0, Figure 1H). In GT1, 3 and 5, nonreducing end (NRE) GlcNAc was also observed (Supplementary Figure S3). However, the peak was not observed in TICs, probably due to weak ionization. In contrast, for GT2, 4 and 6, NRE-saturated disaccharide (G0A0, m/z 396.1, Figure 1I), partially coeluted with its unsaturated counterpart D0A0.
Fig. 1 .

Lyase3B digestion of GT1–6. (A–F) Total ion chromatograms, TICs; (G) extracted mass spectrum of GT5 at 27.5 min; (H) extracted mass spectrum of GT5 at 31.5 min; (I) extracted mass spectrum of GT6 at 27.5 min. Peaks between m/z 750 and 800 in G and I correspond to dimerized D0A0 and G0A0, respectively. (A) GT1, A0G0A0G0-PNP; (B) GT2, G0A0G0A0G0-PNP; (C) GT3, A0G0A0G0A0G0-PNP; (D) GT4, G0A0G0A0G0A0G0-PNP; (E) GT5, A0G0A0G0A0G0A0G0-PNP; (F) GT6, G0A0G0A0G0A0G0A0G0-PNP. The y-axis on all panels is relative ion abundance. This figure is available in black and white in print and in colour at Glycobiology online.
Similarly, GT7-12 were exhaustively digested by lyase3B and lyase3F. Again, only disaccharides were detected in each of the digests (Figure 2A–F). Extracted ion chromatograms of Lyase3B digestion of GT10 were shown as a representation of the LC separation of products (in Supplementary Figure S4). All of compounds GT7-12 produced internal disaccharide (D0S0, m/z 416.0, Figure 2G) and unsaturated uronic acid residue with RE modification (D0-PNP, m/z 296.0, Figure 2H). Additionally, GT7, 9 and 11 produced NRE GlcNS, while GT8, 10 and 12 produced NRE-saturated disaccharide (G0S0, m/z 434.0, Figure 2I), which partially coelutes with its unsaturated counterpart D0S0.
Fig. 6 .
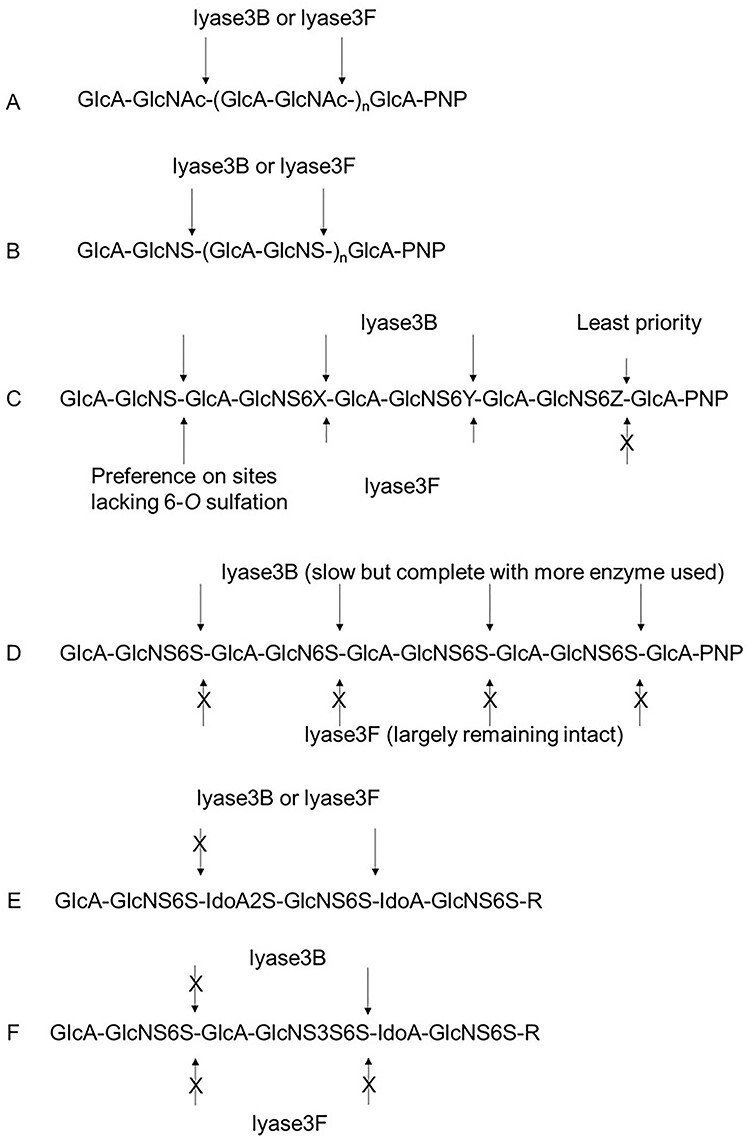
Summary of the activities of lyase3B and lyase3F against synthetic heparin saccharides. (A) Unsulfated saccharides were digested completely to disaccharides by both enzymes (Figure 1). (B) Saccharides with N-sulfated glucosamine residues were digested completely to disaccharide by both enzymes (Figure 2). (C) Nonasaccharides with N-sulfated glucosamine residues and up to three 6-O-sulfate groups at the RE were digested differently by both enzymes. X, Y, Z = H, H, SO3H or H, SO3H, SO3H or SO3H, SO3H, SO3H (Figure 3 and Supplementary Figure S8). The short arrow indicated that the sites were less preferable. (D) Nonasaccharides with N-sulfated glucosamine residues and four 6-O-sulfate groups were completely digested by lyase3B but largely remains intact after the treatment of lyase3F (Figure 3 and Supplementary Figure S8). (E) Highly sulfated hexasaccharides show resistance to both lyases depending on the position of 2-O-sulfation (Figure 4). (F) A highly sulfated hexasaccharide was cleaved at the RE side of GlcNS3S6S by lyase3B but not by lyase3F (Figure 5). This figure is available in black and white in print and in colour at Glycobiology online.
Fig. 2 .

Lyase3B digestion of GT7–12. (A–F) TICs; (G) extracted mass spectrum of GT11 at 25.8 min; (H) extracted mass spectrum of GT11 at 31.5 min; (I) extracted mass spectrum of GT12 at 25.8 min. (A) GT7, S0G0S0G0-PNP; (B) GT8, G0S0G0S0G0-PNP; (C) GT9, S0G0S0G0S0G0-PNP; (D) GT10, G0S0G0S0G0S0G0-PNP; (E) GT11, S0G0S0G0S0G0S0G0-PNP; (F) GT12, G0S0G0S0G0S0G0S0G0-PNP. The y-axis on all panels is relative ion abundance. This figure is available in black and white in print and in colour at Glycobiology online.
These results indicate that both lyase3B and 3F completely digest HS oligosaccharides lacking O-sulfation, indicating they completely digest NA domain and lowly sulfated NS domain. Among the compound sets GT1-6 and GT7-12, all were completely digested by both lyase III enzymes. Since the saccharides differed only by N-substitution (NAc vs. NS), there is no influence of the type of N-substitution of GlcN on the lyase III specificity. Moreover, both the chain length of the substrates and the type of NRE residue had no influence on the digestion. Additionally, both lyase3B and lyase3F digested these compounds completely, indicating that there is no difference of substrate specificity between these two enzymes when applied to substrates without O-sulfation.
Influence of 6-O sulfation on lyase III substrate specificity
Next, we examined oligosaccharides containing 6-O sulfation to elucidate the influence of 6-O sulfation on substrate specificities of both lyase III enzymes. Compounds GT12–16 have the same chain length (dp9) and backbone structure but GT-13-16 have from 1–4 6-O sulfate groups, respectively, starting from the RE.
As shown in Figure 3, the results of lyase3B digestion of these compounds produced several cleavage products. Oligosaccharides with no- to two 6-O sulfate groups, GT12, GT13 and GT14, were completely digested (Figure 3A–C). By contrast, oligosaccharides with three or more 6-O sulfate groups, GT15 and GT16, were digested incompletely and generated both disaccharides and larger saccharides, shown in Figure 3D and E, indicating that the presence of 6-O sulfation affects lyase III digestion.
Fig. 3 .

Lyase3B digestion of GT12-16. (A–E) TICs; (F) extracted mass spectrum of GT13 at 25.6 min; (G) extracted mass spectrum of GT14 at 25.6 min; (H) extracted mass spectrum of GT13 at 24.3 min. dp, degree of polymerization. (A) GT12, G0S0G0S0G0S0G0S0G0-PNP; (B) GT13, G0S0G0S0G0S0G0S6G0-PNP; (C) GT14, G0S0G0S0G0S6G0S6G0-PNP; (D) GT15, G0S0G0S6G0S6G0S6G0-PNP; (E) GT16, G0S6G0S6G0S6G0S6G0-PNP. The y-axis on all panels is relative ion abundance. This figure is available in black and white in print and in colour at Glycobiology online.
By extracting the mass spectrum of each peak, it was observed that both GT13 and GT14 produced D0S0 and G0S0, which partially coeluted at 25.6 min (Figure 3F and G). They also produced D0S6, which eluted at 24.3 min, as shown in Figure 3H. Compared to GT13, GT14 produced more abundant disulfated disaccharide D0S6 and less abundant mono-sulfated disaccharide D0S0, which was consistent with their structural features.
The result of GT15 and GT16 were much more complicated because the digestions were incomplete. The incomplete digestions of GT15 and GT16 were due to the negative impact of higher degree of 6-O sulfation on lyase III activity. For a better understanding of the cleavage priority of the digestion, 4 cleavable sites in GT15 and GT16 were designated 1,2,3,4 from NRE to RE. For GT15, extracted ion chromatograms of lyase3B digestion were shown in Supplementary Figure S5, and products arising from cleavages of site 1, 2, and 3 were detected as shown in Supplementary Figure S6. NRE disaccharide G0S0 and RE heptasaccharide D0S6G0S6G0S6G0-PNP were found as a result of cleavage at site 1. Tetrasaccharide G0S0G0S6 from NRE and pentasaccharide D0S6G0S6G0-PNP from RE were found as a result of cleavage of site 2. Hexasaccharide G0S0G0S6G0S6 from NRE and trisaccharide D0S6G0-PNP from RE were found as a result of cleavage of site 3. Internal di- and tetrasaccharide were also detected. Notably, GT15, as well as GT16, did not produced RE monosaccharide D0-PNP as GT13 and GT14 did, which indicates cleavage of site 4, suggesting site 4 may have the least priority among possible sites. Based on available data, it was difficult to deduce whether the lowest cleavage priority of site 4 was due to its location (last cleavable site from NRE) or imposed by increased 6-O sulfation.
For digestion of GT15 with lyase3B, the NRE disaccharide G0S0 was expected to be preferentially cleaved from the whole structure and to be a predominant product since site 1 lacked 6-O sulfation. The results, however, indicated that along with the expected saturated NRE disaccharide (G0S0 m/z 434.0, Supplementary Figure S6A), unexpected oligosaccharide products of dp4 and dp6 from NRE containing G0S0 were also observed in high abundances, e.g. G0S0G0S6 (site 2 cleavage, Supplementary Figure S6C) and G0S0G0S6G0S6 (site 3 cleavage, Supplementary Figure S6D). This indicated that the cleavage of the bond S0-G0 at NRE (site 1) was not prioritized over the cleavage of the bond S6-G0 (site 2 and site 3). Additionally, we observed that the abundance of dp6 from the NRE (site 3 cleavage) was substantially higher than that of dp7 from RE (site 1 cleavage), indicating that the lyase 3B activity against the bonds of S0-G0 and S6-G0 may be at a similar level in this case. These results indicate a lack of preference of lyase3B for S0-G0 and S6-G0, despite that the former contains a lower level of sulfation. All of the evidence indicates that although additional 6-O sulfation inhibits cleavage by lyase3B, the inhibition is not limited to the site bearing 6-O sulfation, but also adjacent sites not bearing 6-O sulfation.
GT16 produced a similar pattern when digested with lyase3B (Supplementary Figure S7). As the NRE GlcNS residue was 6-O sulfated, peak corresponding to G0S0 at 25.6 min was not detected. Instead, G0S6 generated from the NRE was detected, which coeluted with D0S6 at 24.3 min. Products from the NRE had one more sulfate group than the corresponding products of GT15 while products from the RE were the same as those of GT15, which were consistent with the structure.
Digestion products of GT12-16 by lyase3F were different from those by lyase3B (Supplementary Figure S8). While GT13 was completely digested, GT14 was partially digested. However, most of GT15 was digested while GT16 remained largely unchanged with minor products. More differences were observed after the extraction of the mass spectrum of each peak. For lyase3F digestion of GT14 and GT15, though the digestions were incomplete, we did not observe the oligosaccharides (>dp2) from the NRE. All of the oligosaccharides (>dp2) produced from the digestion of GT14 and GT15 were observed to be odd-numbered and to have the RE modification, e.g., D0S6G0S6G0-PNP in GT14 (Supplementary Figure S9A) and D0S6G0S6G0S6G0-PNP in GT15 (Supplementary Figure S9C). It is interesting to note that all of these large oligosaccharides contained 6-O sulfation on every GlcN residue while their cleavage counterparts did not contain 6-O sulfation. Thus, lyase3F prefers to cleave the site lacking 6-O sulfation, which is different from lyase3B. Additionally, we observed D0S6G0S6G0-PNP in GT15, which might be a secondary product from D0S6G0S6G0S6G0-PNP, indicating 6-O sulfation did not completely inhibit the activity of lyase3F. This substrate preference of lyase3F was not observed for GT16, where all GlcN bears 6-O sulfation, resulting in products from all sites and of both odd- and even-numbered degree-of-polymerization (Supplementary Figure S9B and D). However, the fully packed 6-O sulfation on the chain significantly inhibited the activity of lyase3F, resulting in predominant intact GT16.
Since oligosaccharides were observed when GT16 was digested with either lyase, we repeated the digestions using higher enzyme concentration (2 mU versus 1 mU) to quantify the effect of 6-O sulfation on kinetics of lyase III digestion. As shown in Supplementary Figure S10A, GT16 was completely digested by 2 mU of lyase3B, with no oligosaccharides larger than disaccharide detected (Supplementary Figure S10C). However, after 2 mU lyase3F digestion, GT16 still remained largely undigested as shown by the peak at 19.3 min (Supplementary Figure S10B). We observed the trisaccharide D0S6G0-PNP (Supplementary Figure S10D), indicating that lyase3B and lyase3F acted differently against 6-O sulfation containing oligosaccharides.
Influence of 2-O sulfation on lyase III substrate specificity
Three hexasaccharides, B10, 12, and 16, were employed to examine the influence of the 2-O sulfation on the substrate specificities of lyase III enzymes. Overall, these structures have the same motif, i.e. GlcN residues and uronic acid stereochemistry. Yet, they differ in degree of 2-O sulfation in that B12 and B16 have one 2-O sulfate (on different IdoA residues) and B10 lacks 2-O-sulfate.
Lyase3F acted in a similar manner on these three hexasaccharides to lyase3B and produced the same products (Chopra et al. 2021). As shown in Figure 4A, B10 was digested into 3 disaccharides. Saturated disaccharide G0S6 from NRE (m/z 256.52− and 514.0−) and internal unsaturated disaccharide D0S6 (m/z 247.52− and 496.0−) coeluted at 25.3 min, as shown in Figure 4D, while the disaccharide from RE with R modification, D0S6-R, eluted at 26.0 min (m/z 581.1), as shown in Figure 4E.
Fig. 4 .

Lyase3F digestion of hexasaccharides B10, B12 and B16. (A–C) TICs; (D) extracted mass spectrum of B10 at 25.3 min; (E) extracted mass spectrum of B10 at 26.0 min; (F) extracted mass spectrum of B12 at 22.7 min; (G) extracted mass spectrum of B16 at 23.4 min. (A) B10, G0S6I0S6I0S6-R; (B) B12, G0S6I2S6I0S6-R; (C) B16, G0S6I0S6I2S6-R. The y-axis on all panels is relative ion abundance. This figure is available in black and white in print and in colour at Glycobiology online.
However, both hexasaccharides containing a 2-O sulfate, B12 and B16, were incompletely digested (Figure 4B and C, and Supplementary Figure S11). In both cases, a substantial amount of undigested hexasaccharide was observed, indicating that presence of 2-O sulfation affects digestion. Moreover, in B12, neither internal disaccharide nor NRE disaccharide product were observed. Instead, a tetrasaccharide, G0S6I2S6, from NRE was observed (Figure 4F), indicating that no cleavage occurred at this specific site. Similarly, B16 yielded another tetrasaccharide, D0S6I2S6-R, from RE (Figure 4G), but not the combination of internal disaccharide and RE disaccharide. Both cases clearly indicated that the presence of 2-O sulfation completely blocked the digestion at the corresponding site, which is consistent with the previous report (Xiao et al. 2011).
Influence of 3-O sulfation on lyase III substrate specificity
Although 3-O sulfation is a rare modification in HS, it plays significant role in many biological processes, attracting increasing interest. Four hexamers (B1, B3, B7 and B9), each with a GlcNS3S6S (S9) residue in the mid-chain, were used to examine the influence of 3-O sulfation on substrate specificities of lyase IIIs.
As shown in Supplementary Figure S12 and Figure 5, lyase3F and lyase3B performed differently. Lyase3B produced partial but specific digestion (Chopra et al. 2021), yielding a tetrasaccharide from the NRE and a disaccharide from the RE (Supplementary Figure S12A–D and Figure 5A and B), in each case. No digestion products were observed corresponding to cleavage at the NRE site, indicating its resistance to lyase3B digestion. This type of resistance caused by 3-O sulfation is well-known for lyase II digestion (Zhao et al. 2011). However, there is no evidence to indicate whether the resistance to lyase3B is caused by 3-O sulfation, as observed for lyase II digestion, or simply caused by high density of sulfation. By contrast, all of the 4 hexasaccharide substrates remained unchanged after lyase3F treatment (Supplementary Figure S12E–H and Figure 5C). Neither tetrasaccharides nor disaccharides were observed in these treatments, indicating that these compounds are resistant to lyase3F.
Fig. 5 .

Comparison of enzymatic digestion of hexasaccharide B7 using lyase3B and lyase3F. (A) TIC of lyase3B digestion; (B) TIC of lyase3F digestion; (C) extracted mass spectrum of A at 22.7 min; (D) extracted mass spectrum of A at 26.2 min; (E) extracted mass spectrum of B at 21.8 min. Hex, intact hexasaccharide. B7, G0S6G0S9I0S6-R. The y-axis on all panels is relative ion abundance. Panels A, C, and D were modified from our previous publication (Chopra et al. 2021). This figure is available in black and white in print and in colour at Glycobiology online.
Discussion
In this study, we examined the influence of HS modifications on lyase III substrate specificity using a library of synthetic HS oligosaccharides with well-defined structures. As summarized in Figure 6, we found that N-substitution has no significant effect (A, B) while 2-O sulfation prevents the digestion at the corresponding site (E). As the number of 6-O sulfate groups increases, lyase III activity decreases (C, D), the trend observed requires further investigation. We observed that the two lyase III enzymes cleave 3-O-sulfated hexasaccharides differently (F). Therefore, it may be possible to choose lyase3B or lyase3F to digest biologically derived HS, depending on whether cleavage adjacent to the GlcNS3S6S residue is desired. Additionally, the influence of uronic acid epimerization was not revealed due to lack of appropriate standards. Lyase III activity on HS oligosaccharides containing A6 was also not examined. Efforts toward generation of extended library of HS standards are underway, and this will further advance our understanding of lyase III specificities.
While beyond the scope of current work, a detailed knowledge of lyase III functions, activities, and reaction kinetics may allow production of specific saccharides by HS digestion, by exploiting differing activities of enzymes from different sources. With the development of analytical methods and instrumentation, such kind of domains may be handled and identified using LC–MS, facilitating the study of GAGs at the domain level. A comprehensive study of the detailed activity of each enzyme on selected HS oligosaccharides and real-time product monitoring by mass spectrometry is currently in progress in our lab.
Materials and methods
Materials
GT series HS oligosaccharides were obtained from a publicly available GAG standard library, funded by NIH (https://www.bumc.bu.edu/zaia/gag-synthetic-saccharides-available/); B series HS oligosaccharides were synthesized and purified as previously described (Chopra et al. 2021). Each of these compounds has a RE aminopentane aglycone, allowing the unambiguous determination of digest products generated from either RE (containing modification), NRE (saturated), or the middle of the chain (unsaturated). The sequences of the compounds used in this study are shown in Table I.
Lyase III originating from F. heparinum (lyase 3F) was a gift from Dr. Jian Liu (University of North Carolina, Chapel Hill). Lyase III originating from B. eggerthii (lyase 3F) was purchased from New England Biolabs.
Nomenclature
All oligosaccharides and their corresponding digestion products were described using the GAG structural code introduced by Lawrence et al. (2008)). Briefly, each monosaccharide residue was named by one letter and one number. For glucosamine residue, letter A or S indicate it was either N-acetylated or N-sulfated. For uronic acid, letter G or I indicate epimers (GlcA or IdoA). Letter D was used to indicate unsaturated uronic acid. The number in each code indicated the position of sulfations, e.g. 0 for no sulfation, 2 for 2-O sulfation, 6 for 6-O sulfation, and 9 for 3, 6-di-O-sulfation.
Lyase III digestion
Each oligosaccharide (1 nanomole of B or 10 μg of GT) was dissolved in 20 μL of digestion buffer (50 mM ammonium formate, 2 mM calcium chloride, pH 6.0) (Huang et al. 2015) and digested by lyase III (1 mU, unless otherwise mentioned) at 37°C overnight. The digest was then centrifuged and subjected to LC–MS analysis.
Oligosaccharide analysis using LC–MS
LC–MS analysis of the digest was carried out on an Agilent 6520 Q-TOF instrument (Santa Clara, CA) with an Acquity UPLC BEH size exclusion chromatography (SEC) column (4.6 mm × 150 mm, Waters Corp., Milford, MA) as previous described (Wu et al. 2018). The mobile phase contained 50 mM ammonium formate (pH 6.8) in methanol/water (20:80). The constituents were eluted in 35 min at a flow rate of 75 μL/min. For all of the digest of B compounds, a chemically regenerated ion suppressor (ACRS 500, 2 mm; Thermo Fisher Scientific/Dionex, San Jose, CA) was used to increase the signals, prior to MS detector as previously reported (Zaia et al. 2016).
Data interpretation
Since it is well known that the heparinases cleave the bond between glucosamine and uronic acid, all of the potential products of each digestion were listed. For each product, the theoretical m/z values of all reasonable charge states were calculated as a reference. The result of each digestion was concluded by searching the presence or absence of each potential product after extraction of molecular ions, as shown in Scheme 1. The observed and calculated m/z values are summarized in Supplementary Table SI.
Scheme 1.

A flowchart showing the data annotation using GT1 as a representation. The products and ions detected are indicated with solid outline.
Funding
National Institutes of Health (grants P41GM104603, R21HL131554 and U01CA221234 to J.Z. and grants P41GM103390 and HLBI R01HL151617 to G.-J.B.).
Supplementary Material
Contributor Information
Jiandong Wu, Department of Biochemistry, Center for Biomedical Mass Spectrometry, Boston University School of Medicine, Boston, MA 02118, USA.
Pradeep Chopra, Department of Biochemistry, Center for Biomedical Mass Spectrometry, Boston University School of Medicine, Boston, MA 02118, USA.
Geert-Jan Boons, Complex Carbohydrate Research Center, University of Georgia, Athens, GE 30602, USA; Department of Chemistry, University of Georgia, Athens, GE 30602, USA; Department of Chemical Biology and Drug Discovery, Utrecht Institute for Pharmaceutical Sciences and Bijvoet Center for Biomolecular Research, Utrecht University, Utrecht 3584, The Netherlands.
Joseph Zaia, Department of Biochemistry, Center for Biomedical Mass Spectrometry, Boston University School of Medicine, Boston, MA 02118, USA.
References
- Chen J, Kawamura T, Sethi MK, Zaia J, Repunte-Canonigo V, Sanna PP. 2017. Heparan sulfate: Resilience factor and therapeutic target for cocaine abuse. Sci Rep. 7:13931. [DOI] [PMC free article] [PubMed] [Google Scholar]
- Chen YH, Narimatsu Y, Clausen TM, Gomes C, Karlsson R, Steentoft C, Spliid CB, Gustavsson T, Salanti A, Persson A, et al. 2018. The GAGOme: A cell-based library of displayed glycosaminoglycans. Nat Methods. 15:881–888. [DOI] [PubMed] [Google Scholar]
- Chopra P, Joshi A, Wu J, Lu W, Yadavalli T, Wolfert MA, Shukla D, Zaia J, Boons G-J. 2021. 3-O-Sulfation of heparan sulfate modulates protein binding and lyase degradation. Proc Natl Acad Sci U S A. 118:e2012935118. [DOI] [PMC free article] [PubMed] [Google Scholar]
- Desai UR, Wang HM, Linhardt RJ. 1993a. Specificity studies on the heparin lyases from Flavobacterium heparinum. Biochemistry. 32:8140–8145. [DOI] [PubMed] [Google Scholar]
- Desai UR, Wang HM, Linhardt RJ. 1993b. Substrate specificity of the heparin lyases from Flavobacterium heparinum. Arch Biochem Biophys. 306:461–468. [DOI] [PubMed] [Google Scholar]
- Dietrich CP, Silva ME, Michelacci YM. 1973. Sequential degradation of heparin in Flavobacterium heparinum. Purification and properties of five enzymes involved in heparin degradation. J Biol Chem. 248:6408–6415. [PubMed] [Google Scholar]
- Esko JD, Lindahl U. 2001. Molecular diversity of heparan sulfate. J Clin Invest. 108:169–173. [DOI] [PMC free article] [PubMed] [Google Scholar]
- Esko JD, Selleck SB. 2002. Order out of chaos: Assembly of ligand binding sites in heparan sulfate. Annu Rev Biochem. 71:435–471. [DOI] [PubMed] [Google Scholar]
- Galliher PM, Cooney CL, Langer R, Linhardt RJ. 1981. Heparinase production by Flavobacterium heparinum. Appl Environ Microbiol. 41:360–365. [DOI] [PMC free article] [PubMed] [Google Scholar]
- Gill VL, Wang Q, Shi X, Zaia J. 2012. Mass spectrometric method for determining the uronic acid epimerization in heparan sulfate disaccharides generated using nitrous acid. Anal Chem. 84:7539–7546. [DOI] [PMC free article] [PubMed] [Google Scholar]
- Guerrini M, Guglieri S, Casu B, Torri G, Mourier P, Boudier C, Viskov C. 2008. Antithrombin-binding octasaccharides and role of extensions of the active pentasaccharide sequence in the specificity and strength of interaction. Evidence for very high affinity induced by an unusual glucuronic acid residue. J Biol Chem. 283:26662–26675. [DOI] [PMC free article] [PubMed] [Google Scholar]
- Huang Y, Mao Y, Zong C, Lin C, Boons G, Zaia J. 2015. Discovery of a heparan sulfate 3-O-sulfation specific peeling reaction. Anal Chem. 81:592–600. [DOI] [PMC free article] [PubMed] [Google Scholar]
- Knelson EH, Nee JC, Blobe GC. 2014. Heparan sulfate signaling in cancer. Trends Biochem Sci. 39:277–288. [DOI] [PMC free article] [PubMed] [Google Scholar]
- Lawrence R, Lu H, Rosenberg RD, Esko JD, Zhang L. 2008. Disaccharide structure code for the easy representation of constituent oligosaccharides from glycosaminoglycans. Nat Methods. 5:291–292. [DOI] [PubMed] [Google Scholar]
- Ledin J, Staatz W, Li JP, Gotte M, Selleck S, Kjellen L, Spillmann D. 2004. Heparan sulfate structure in mice with genetically modified heparan sulfate production. J Biol Chem. 279:42732–42741. [DOI] [PubMed] [Google Scholar]
- Lindahl U, Backstrom G, Hook M, Thunberg L, Fransson LA, Linker A. 1979. Structure of the antithrombin-binding site in heparin. Proc Natl Acad Sci U S A. 76:3198–3202. [DOI] [PMC free article] [PubMed] [Google Scholar]
- Lindahl U, Kjellen L. 2013. Pathophysiology of heparan sulphate: Many diseases, few drugs. J Intern Med. 273:555–571. [DOI] [PubMed] [Google Scholar]
- Qiu H, Shi S, Yue J, Xin M, Nairn AV, Lin L, Liu X, Li G, Archer-Hartmann SA, Dela Rosa M, et al. 2018. A mutant-cell library for systematic analysis of heparan sulfate structure-function relationships. Nat Methods. 15:889–899. [DOI] [PMC free article] [PubMed] [Google Scholar]
- Raghunathan R, Hogan JD, Labadorf A, Myers RH, Zaia J. 2020. A glycomics and proteomics study of aging and Parkinson's disease in human brain. Sci Rep. 10:12804. [DOI] [PMC free article] [PubMed] [Google Scholar]
- Raghunathan R, Polinski NK, Klein JA, Hogan JD, Shao C, Khatri K, Leon D, McComb ME, Manfredsson FP, Sortwell CE, et al. 2018. Glycomic and proteomic changes in aging brain nigrostriatal pathway. Mol Cell Proteomics. 17:1778–1787. [DOI] [PMC free article] [PubMed] [Google Scholar]
- Raghunathan R, Sethi M, Zaia J. 2019. On-slide tissue digestion for mass spectrometry based glycomic and proteomic profiling. MethodsX. 6:2329–2347. [DOI] [PMC free article] [PubMed] [Google Scholar]
- Sanderson P, Stickney M, Leach FE 3rd, Xia Q, Yu Y, Zhang F, Linhardt RJ, Amster IJ. 2018. Heparin/heparan sulfate analysis by covalently modified reverse polarity capillary zone electrophoresis-mass spectrometry. J Chromatogr A. 1545:75–83. [DOI] [PMC free article] [PubMed] [Google Scholar]
- Sethi MK, Downs M, Zaia J. 2020. Serial in-solution digestion protocol for mass spectrometry-based glycomics and proteomics analysis. Mol Omics. 16:364–376. doi: 10.1039/d0mo00019a. [DOI] [PMC free article] [PubMed] [Google Scholar]
- Shi X, Zaia J. 2009. Organ-specific heparan sulfate structural phenotypes. J Biol Chem. 284:11806–11814. [DOI] [PMC free article] [PubMed] [Google Scholar]
- Shriver Z, Capila I, Venkataraman G, Sasisekharan R. 2012. Heparin and heparan sulfate: Analyzing structure and microheterogeneity. Handb Exp Pharmacol. 207:159–176. [DOI] [PMC free article] [PubMed] [Google Scholar]
- Shriver Z, Sundaram M, Venkataraman G, Fareed J, Linhardt R, Biemann K, Sasisekharan R. 2000. Cleavage of the antithrombin III binding site in heparin by heparinases and its implication in the generation of low molecular weight heparin. Proc Natl Acad Sci U S A. 97:10365–10370. [DOI] [PMC free article] [PubMed] [Google Scholar]
- Wei J, Wu J, Tang Y, Ridgeway ME, Park MA, Costello CE, Zaia J, Lin C. 2019. Characterization and quantification of highly Sulfated glycosaminoglycan isomers by gated-trapped ion mobility spectrometry negative electron transfer dissociation MS/MS. Anal Chem. 91:2994–3001. [DOI] [PMC free article] [PubMed] [Google Scholar]
- Wu J, Wei J, Chopra P, Boons GJ, Lin C, Zaia J. 2019. Sequencing heparan sulfate using HILIC LC-NETD-MS/MS. Anal Chem. 91:11738–11746. [DOI] [PMC free article] [PubMed] [Google Scholar]
- Wu J, Wei J, Hogan JD, Chopra P, Joshi A, Lu W, Klein J, Boons GJ, Lin C, Zaia J. 2018. Negative electron transfer dissociation sequencing of 3-O-sulfation-containing heparan sulfate oligosaccharides. J Am Soc Mass Spectrom. 29:1262–1272. [DOI] [PMC free article] [PubMed] [Google Scholar]
- Xiao Z, Tappen BR, Ly M, Zhao W, Canova LP, Guan H, Linhardt RJ. 2011. Heparin mapping using heparin lyases and the generation of a novel low molecular weight heparin. J Med Chem. 54:603–610. [DOI] [PMC free article] [PubMed] [Google Scholar]
- Zaia J, Khatri K, Klein J, Shao C, Sheng Y, Viner R. 2016. Complete molecular weight profiling of low-molecular weight heparins using size exclusion chromatography-ion suppressor-high-resolution mass spectrometry. Anal Chem. 88:10654–10660. [DOI] [PMC free article] [PubMed] [Google Scholar]
- Zhang T, Xie S, Wang Z, Zhang R, Sun Q, Liu X, Chi L, Li JP, Li H, Tan T. 2020. Oligosaccharides mapping of nitrous acid degraded heparin through UHPLC-HILIC/WAX-MS. Carbohydr Polym. 231:115695. [DOI] [PubMed] [Google Scholar]
- Zhao W, Garron ML, Yang B, Xiao Z, Esko JD, Cygler M, Linhardt RJ. 2011. Asparagine 405 of heparin lyase II prevents the cleavage of glycosidic linkages proximate to a 3-O-sulfoglucosamine residue. FEBS Lett. 585:2461–2466. [DOI] [PMC free article] [PubMed] [Google Scholar]
- Zhao Y, Singh A, Xu Y, Zong C, Zhang F, Boons GJ, Liu J, Linhardt RJ, Woods RJ, Amster IJ. 2017. Gas-phase analysis of the complex of fibroblast GrowthFactor 1 with heparan sulfate: A traveling wave ion mobility spectrometry (TWIMS) and molecular modeling study. J Am Soc Mass Spectrom. 28:96–109. [DOI] [PMC free article] [PubMed] [Google Scholar]
Associated Data
This section collects any data citations, data availability statements, or supplementary materials included in this article.