Abstract
Microinjection is a widely used technique employed by biologists with applications in transgenesis, cryopreservation, mutagenesis, labeling/dye injection and in-vitro fertilization. However, microinjection is an extremely laborious manual procedure, which makes it a critical bottleneck in the field and thus ripe for automation. Here, we present a computer-guided robot that automates the targeted microinjection of Drosophila melanogaster and zebrafish (Danio rerio) embryos, two important model organisms in biological research. The robot uses a series of cameras to image an agar plate containing embryos at multiple magnifications and perspectives. This imaging is combined with machine learning and computer vision algorithms to pinpoint a location on the embryo for targeted microinjection with microscale precision. We demonstrate the utility of this microinjection robot to successfully microinject Drosophila melanogaster and zebrafish embryos. Results obtained indicate that the robotic microinjection approach can significantly increase the throughput of microinjection as compared to manual microinjection while maintaining survival rates comparable to human operators. In the future, this robotic platform can be used to perform high throughput microinjection experiments and can be extended to automatically microinject a host of organisms such as roundworms (Caenorhabditis elegans), mosquito (Culicidae) embryos, sea urchins (Echinoidea) and frog (Xenopus) oocytes.
Keywords: microinjection, biorobotics, computer vision, machine learning, transgenesis
I. Introduction
Microinjection is the process of using a glass micropipette to inject small amounts of solution into biological organisms at a microscopic level [1]. Since the 1970’s microinjection has been increasingly used for transgenesis, cryopreservation, mutagenesis, labeling/dye injection, and in-vitro fertilization in various organisms such as fruit fly (Drosophila melanogaster) embryos, zebrafish (Danio rerio) embryos, roundworms (Caenorhabditis elegans), mosquito (Culicidae) embryos, sea urchins (Echinoidea) and frog (Xenopus) oocytes [1], [2].
Microinjection is however a laborious technique and remains a critical bottleneck in many experiments. While various protocols have been developed to perform manual microinjection [3]–[5], such protocols suffer from low throughput and require significant practice for mastering the technique. Consequently, the success of microinjection is highly operator-dependent. Currently, large-scale microinjection-based experiments require a significant expenditure of resources [6], [7]. The development of reliable and inexpensive tools for automated microinjection will empower large-scale experiments and will open new avenues for scientific research.
Several efforts have been made to automate microinjection to enable high-throughput experimentation. A microfluidic chip, a microelectromechanical system (MEMS), and a magnetic field actuator-based microinjection systems have been developed for zebrafish [8]. A microrobotic system has been used to automate the microinjection of human cells [9]. Researchers have also developed a microfluidic and MEMS-based injection system for high throughput experiments in Drosophila melanogaster embryos [10], [11]. Although these efforts have pushed microinjection towards more automation, complete automation is yet to be achieved, as they require significant manual sample preparation. Further, these systems involve building critical microfluidic and MEMS-based systems to automate microinjection, requiring access to sophisticated microfabrication equipment and infrastructure. A robotic microinjection platform utilizing commonly available components, that can fully automate the microinjection of dozens to hundreds of organisms would be very powerful.
In this paper, we describe a novel robotic platform for automated microinjection of Drosophila melanogaster and zebrafish embryos. The robot utilizes multi-perspective, multi-scale imaging, combined with machine learning (ML) and computer vision algorithms to automatically detect 100s of embryos on an agar plate and automatically guide each embryo on the plate to the micropipette for microinjection. This effort builds upon our recent work of using real-time analysis of images obtained from a microscope for targeted single neuron recording [12]–[14] and microinjection [15], [16]. This system is easy to build using off the shelf optomechanical components. Our experiments indicate the automated microinjection robot can provide throughput exceeding current manual microinjection methods.
II. Robot hardware
The multi-scale nature of the automation challenge is illustrated in Figure 1. The samples such as Drosophila melanogaster embryos are distributed randomly across a 9 cm diameter agar plate. Each embryo is a 3-dimensional (3-D) object no more than 500 μm in length, and microinjection needs to be carried out on a specific location within each embryo (e.g. for transgenesis in the Drosophila melanogaster embryo, the injection point is at the posterior where the germ cells are located [4]). Further, such experiments need to be performed within a very specific time window (e.g., within 1 hour of collection on the agar plate). To perform the automated microinjections, first we need to detect locations of embryos and identify the injection point on each embryo in 3-D space at microscopic resolution. Next, if the location of the tip of the micropipette is known in 3-D space, then a trajectory guiding each embryo’s injection point to the micropipette tip can be determined, followed by the delivery of a small amount of solution.
Figure 1:
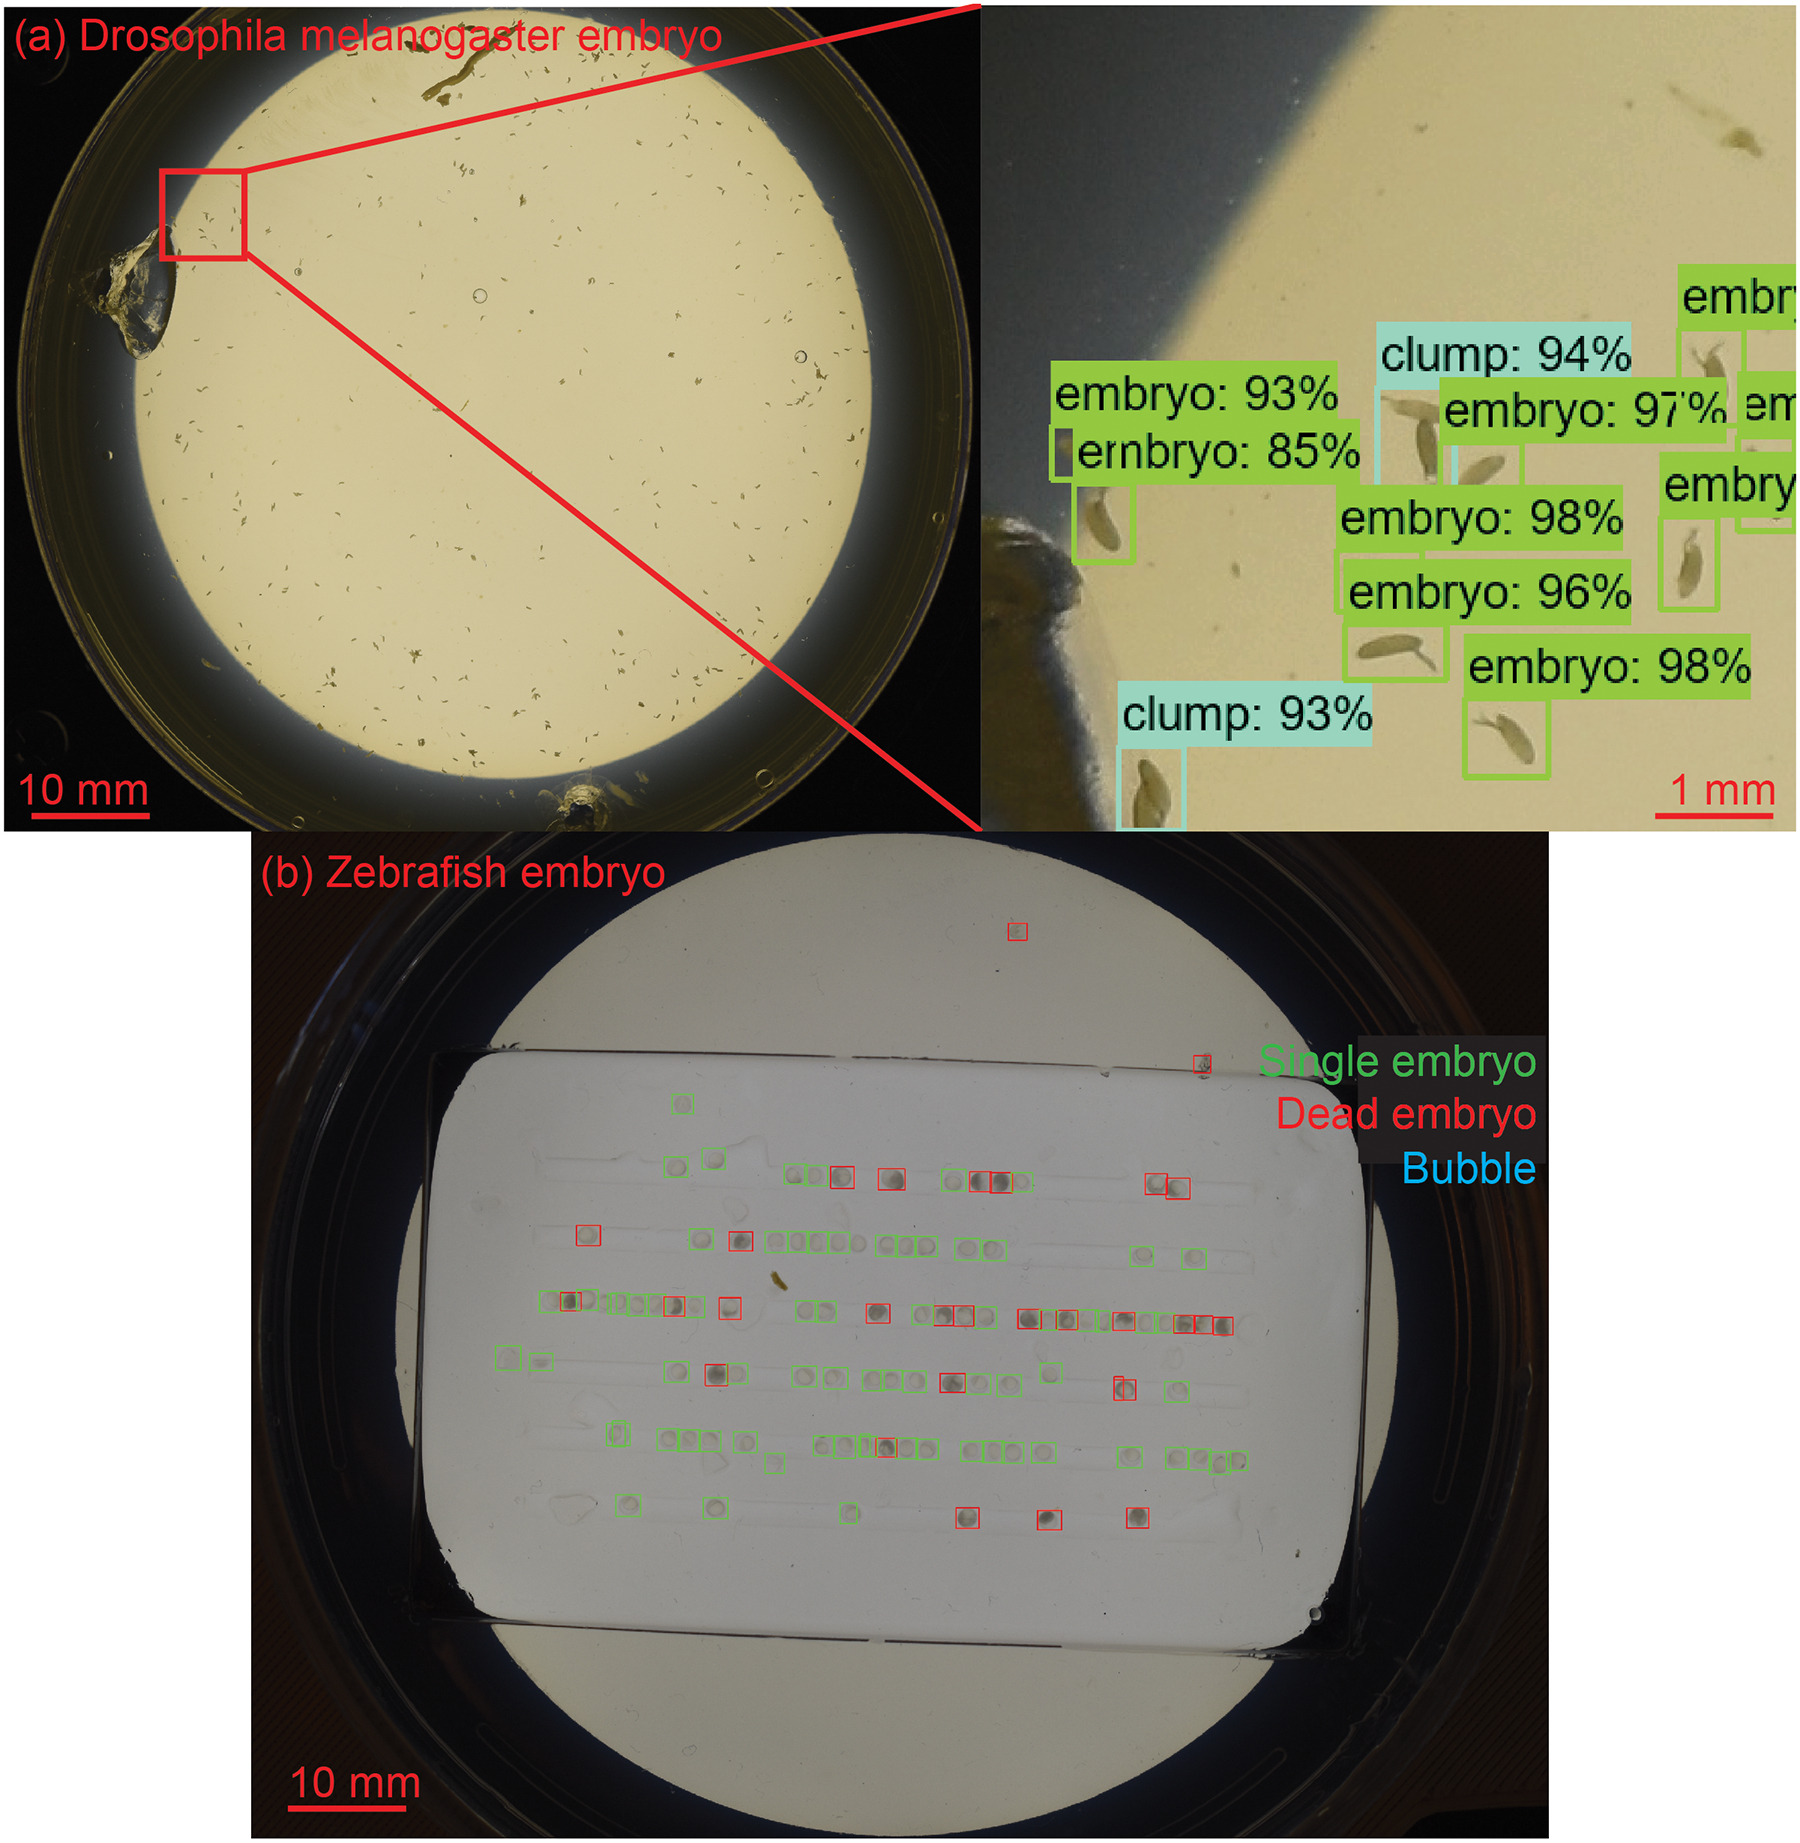
Faster R-CNN algorithm trained to detect (a) Drosophila melanogaster embryos and (b) Zebrafish embryos in macroscale image captured by a DSLR camera.
To fully automate this sequence of steps, we established a robotic platform shown in Figure 2. An XYZ stage, consisting of three stepper motors that are controlled using stepper motor controllers is the primary manipulator within the robot. An agar plate containing the embryos is installed on a custom designed holder, which is mounted on the XYZ stage. A circular light-emitting diode (LED) illuminator within the holder illuminates the agar plate from the bottom. The XYZ stage sequentially manipulates the agar plate to various locations within the robot where the agar plate can be imaged at multiple magnifications and perspectives. A digital single lens reflex (DSLR) camera is used to acquire a macroscale image of the whole agar plate. A vertical custom-built microscope can image single embryos on the agar plate at high magnification (4X). The two inclined microscopes with 2X magnification are positioned to simultaneously image a fixed micropipette and the agar plate from two perspectives. They are positioned such that the micropipette tip is always in focus in both perspectives. This two-perspective imaging system allows the robot to determine the locations of the tip of the micropipette and the injection point on each embryo where the microinjection needs to be attempted in 3-D space (Figure 2). The pressure controller is used to provide air pressure to deliver nanoliters of solution inside the embryo. Finally, all the hardware components are connected via digital links to the computer.
Figure 2:
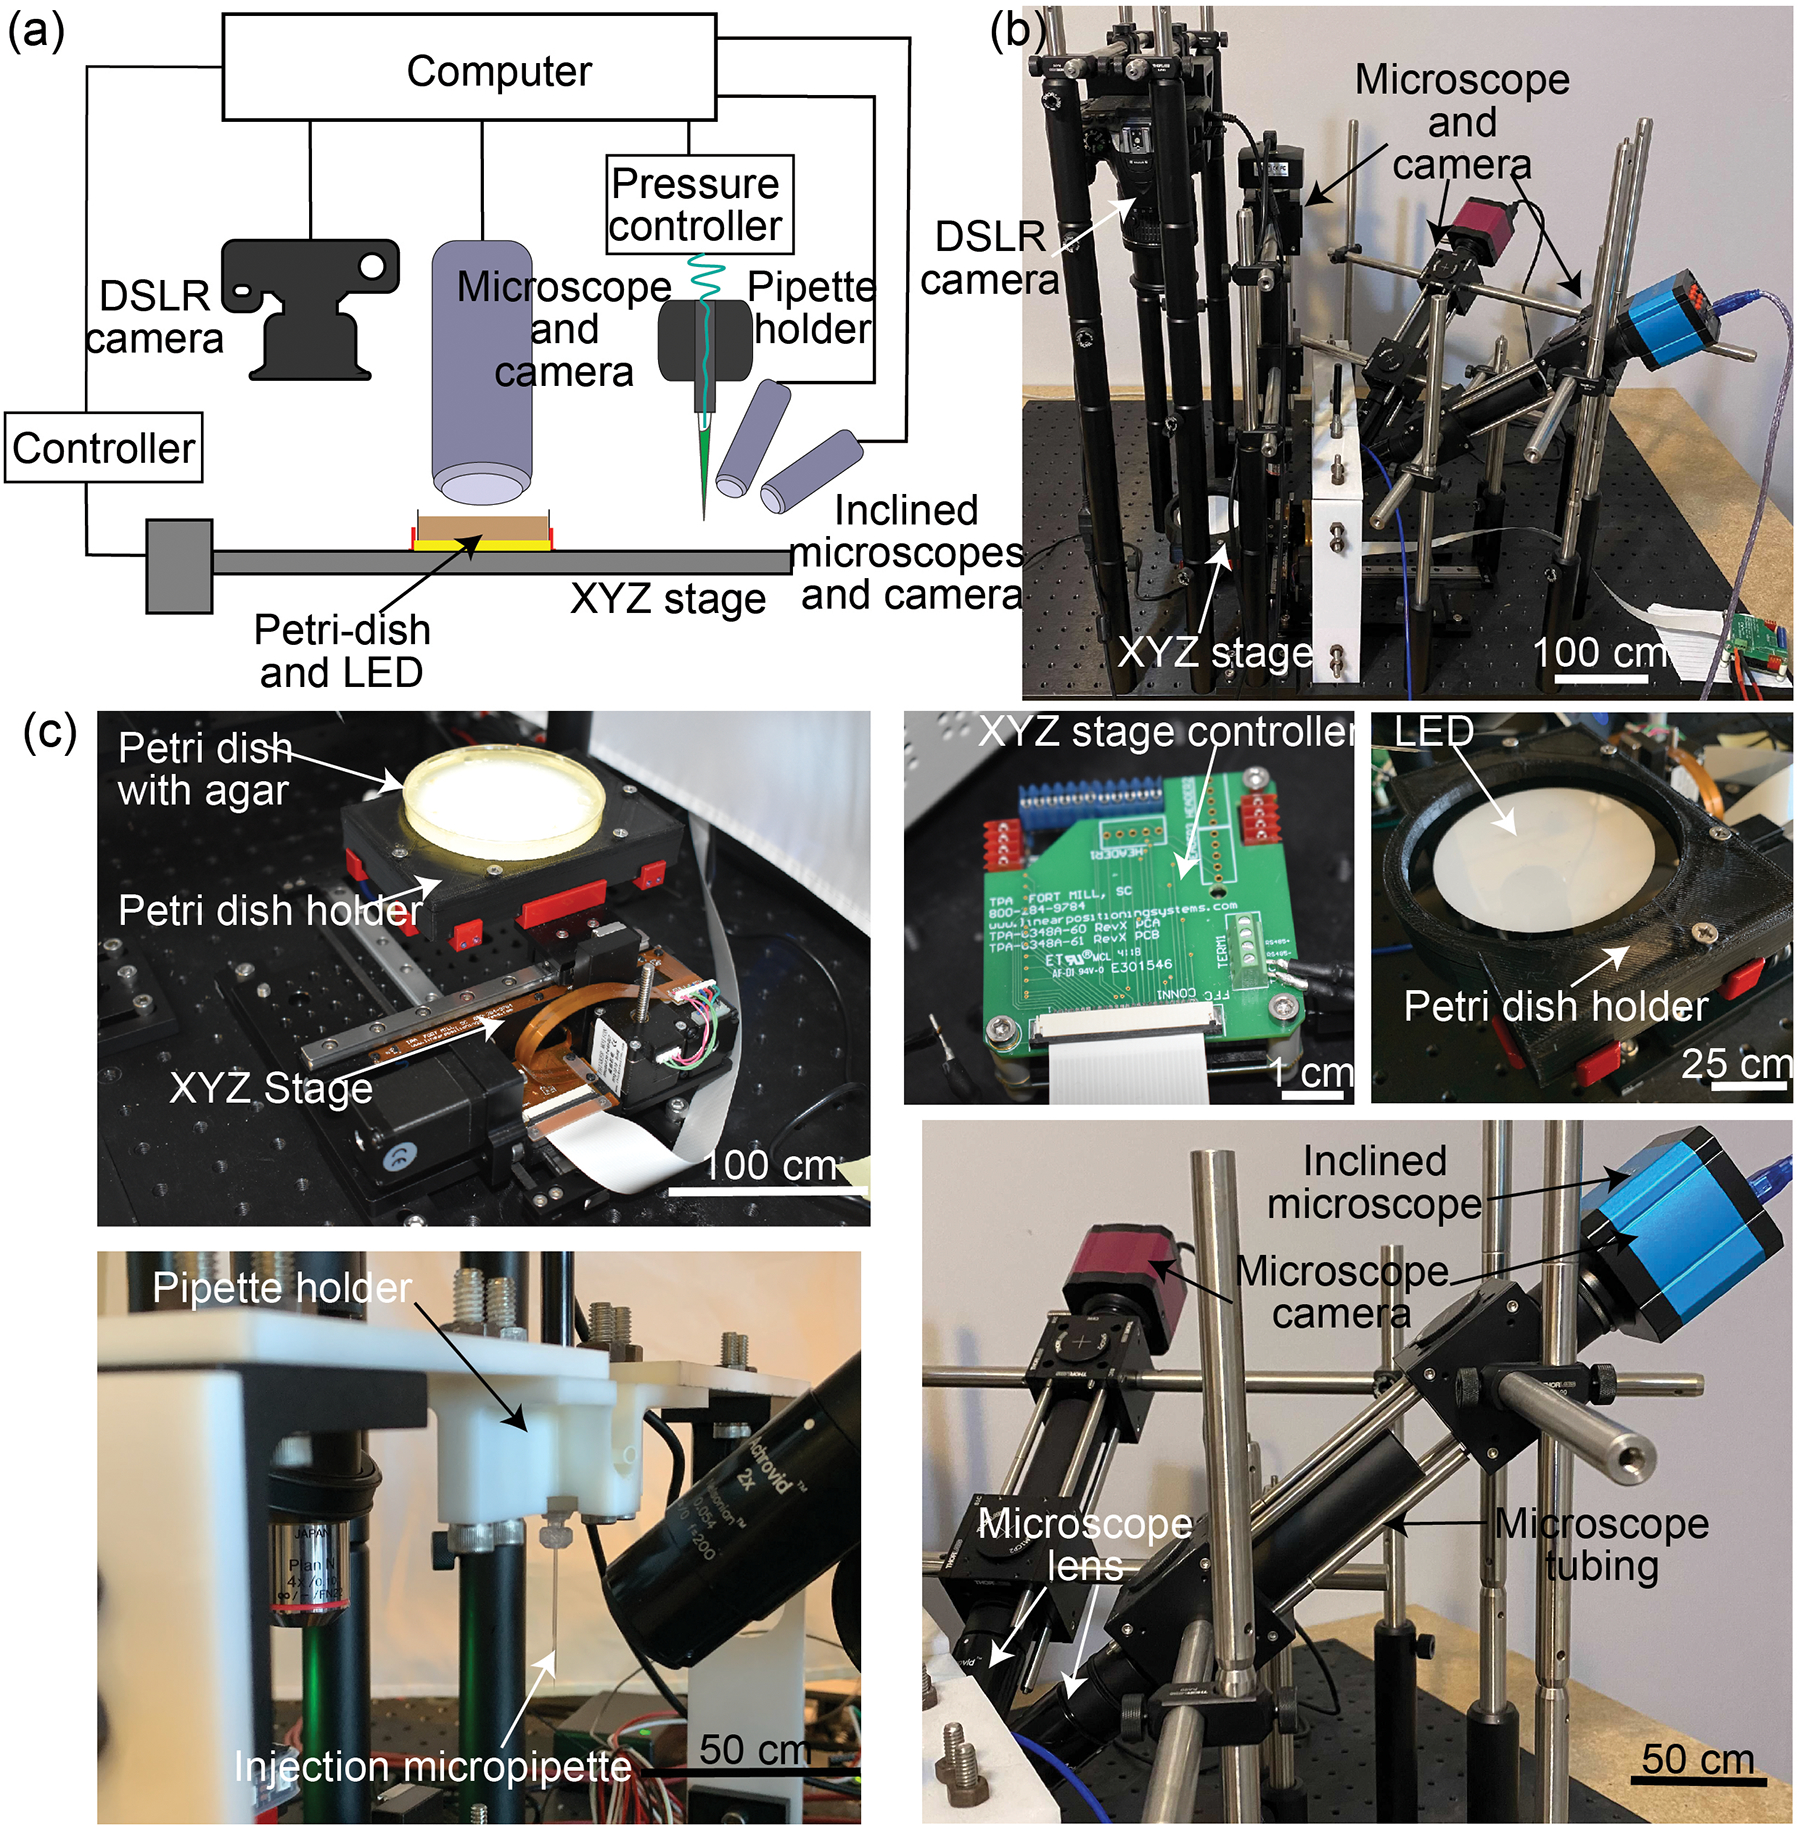
Robot hardware: (a) Hardware schematic diagram (b) Overall hardware (c) Different parts of the hardware
III. Robot operation
A. Overview
The robot executes a series of steps to automatically inject embryos (Figure 3). First, a macroscopic image of the whole agar plate is acquired using the DSLR camera (Figure 3, step 1). This image is divided into multiple sub-images and each of these sub-images is analyzed using an ML algorithm which is trained to detect features indicative of a single isolated embryo and subsequently defines a bounding box surrounding it (Figure 3, step 2). The XYZ stage moves the agar plate such that the area within each bounding box defined by the ML algorithm is imaged using the vertical microscope at multiple Z heights to compile a stack of images. An autofocus algorithm is used to analyze this image stack and determine the plane of best focus (Figure 3, step 3). The XYZ stage then moves the agar plate under the micropipette to illuminate the micropipette. The two inclined microscopes simultaneously image the micropipette tip from two perspectives and a tip detection algorithm is used to determine the location of the micropipette tip in 3-D space (Figure 3, step 4). Then, the XYZ stage moves the agar plate so that the embryo previously imaged using the vertical microscope is positioned approximately underneath the micropipette tip. The two inclined microscopes then image the embryo and an algorithm is used to analyze the morphology of the embryo to compute the location of a point on the embryo where the microinjection needs to be performed in 3-D space (Figure 3, step 5). Lastly, the robot computes a trajectory to guide this point on the embryo to the tip of the micropipette. The XYZ stage moves the agar plate such that the injection point on the embryo contacts the micropipette tip (Figure 3, step 6). Finally, the agar plate is moved up by a preset distance so that the micropipette penetrates the embryo for a set amount of time. During this time, the pressure controller applies a specific pressure to the micropipette to inject the solution into the embryo (Figure 3, step 7). Steps 5–7 in Figure 3, are repeated for each embryo detected by the ML algorithm. Each algorithm is described in detail in the following sections.
Figure 3:
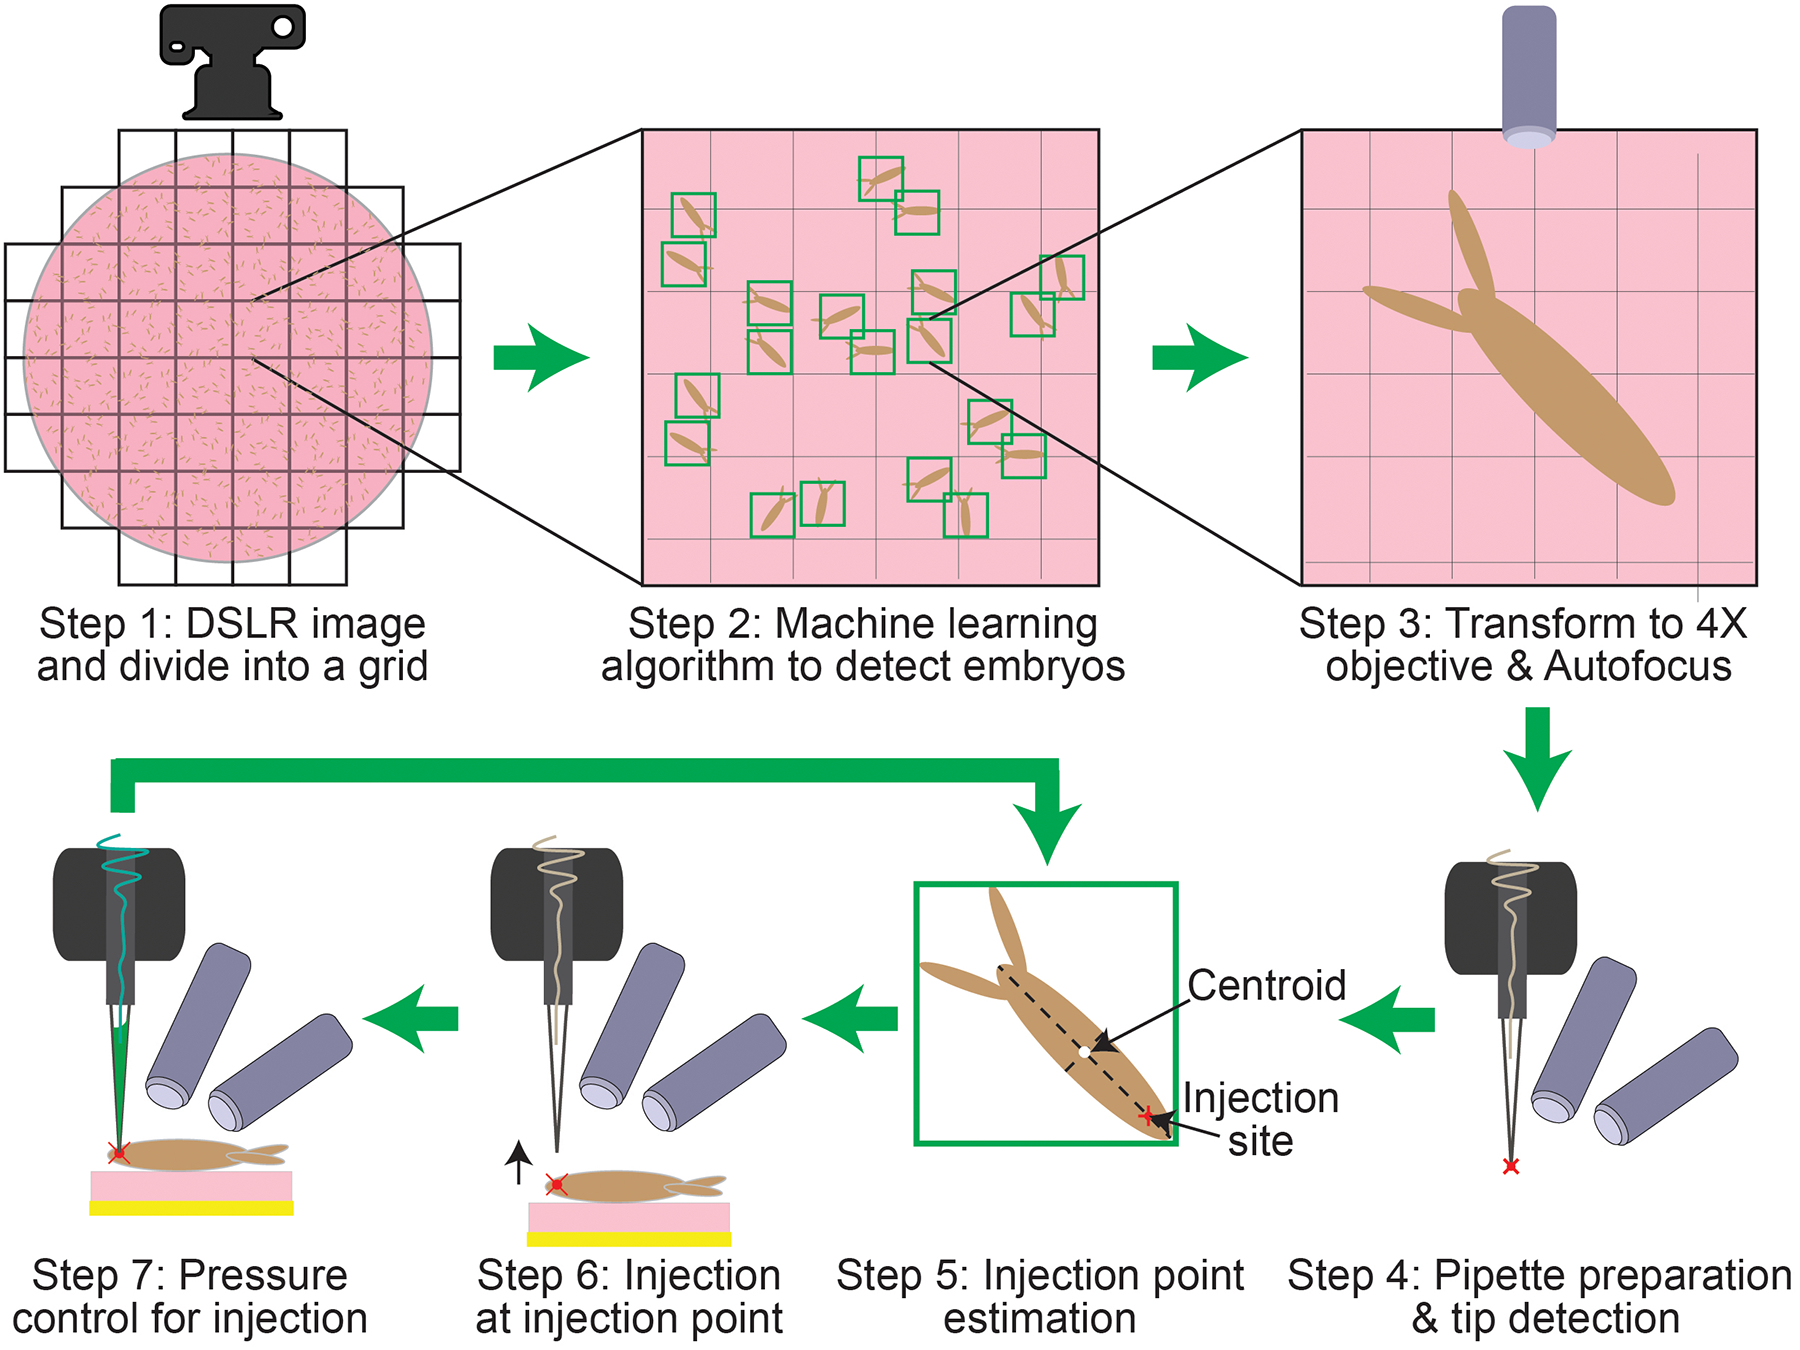
Schematic diagram of the automated microinjection procedure
B. Machine learning algorithm to detect embryos
Faster Region Convolution Neural Network (Faster R-CNN) [17], was used to detect different classes (e.g. single embryos, clumps of embryos, and bubbles for Drosophila melanogaster embryos; single embryo, dead embryo and bubbles for zebrafish embryos). Each object detected is assigned a bounding box, a class, and a prediction score (Figure 1).
To train the ML algorithm the Tensorflow framework was used and over a thousand images of each class were annotated. These images were also augmented via blurring and rotation. The clumps of embryos, dead embryos and bubbles were included to not have them detected as single embryos. Once training was complete, the performance of the ML algorithm was evaluated by analyzing the object detections made by the ML algorithm for the different agar plates that were tested (Figure 8).
Figure 8:
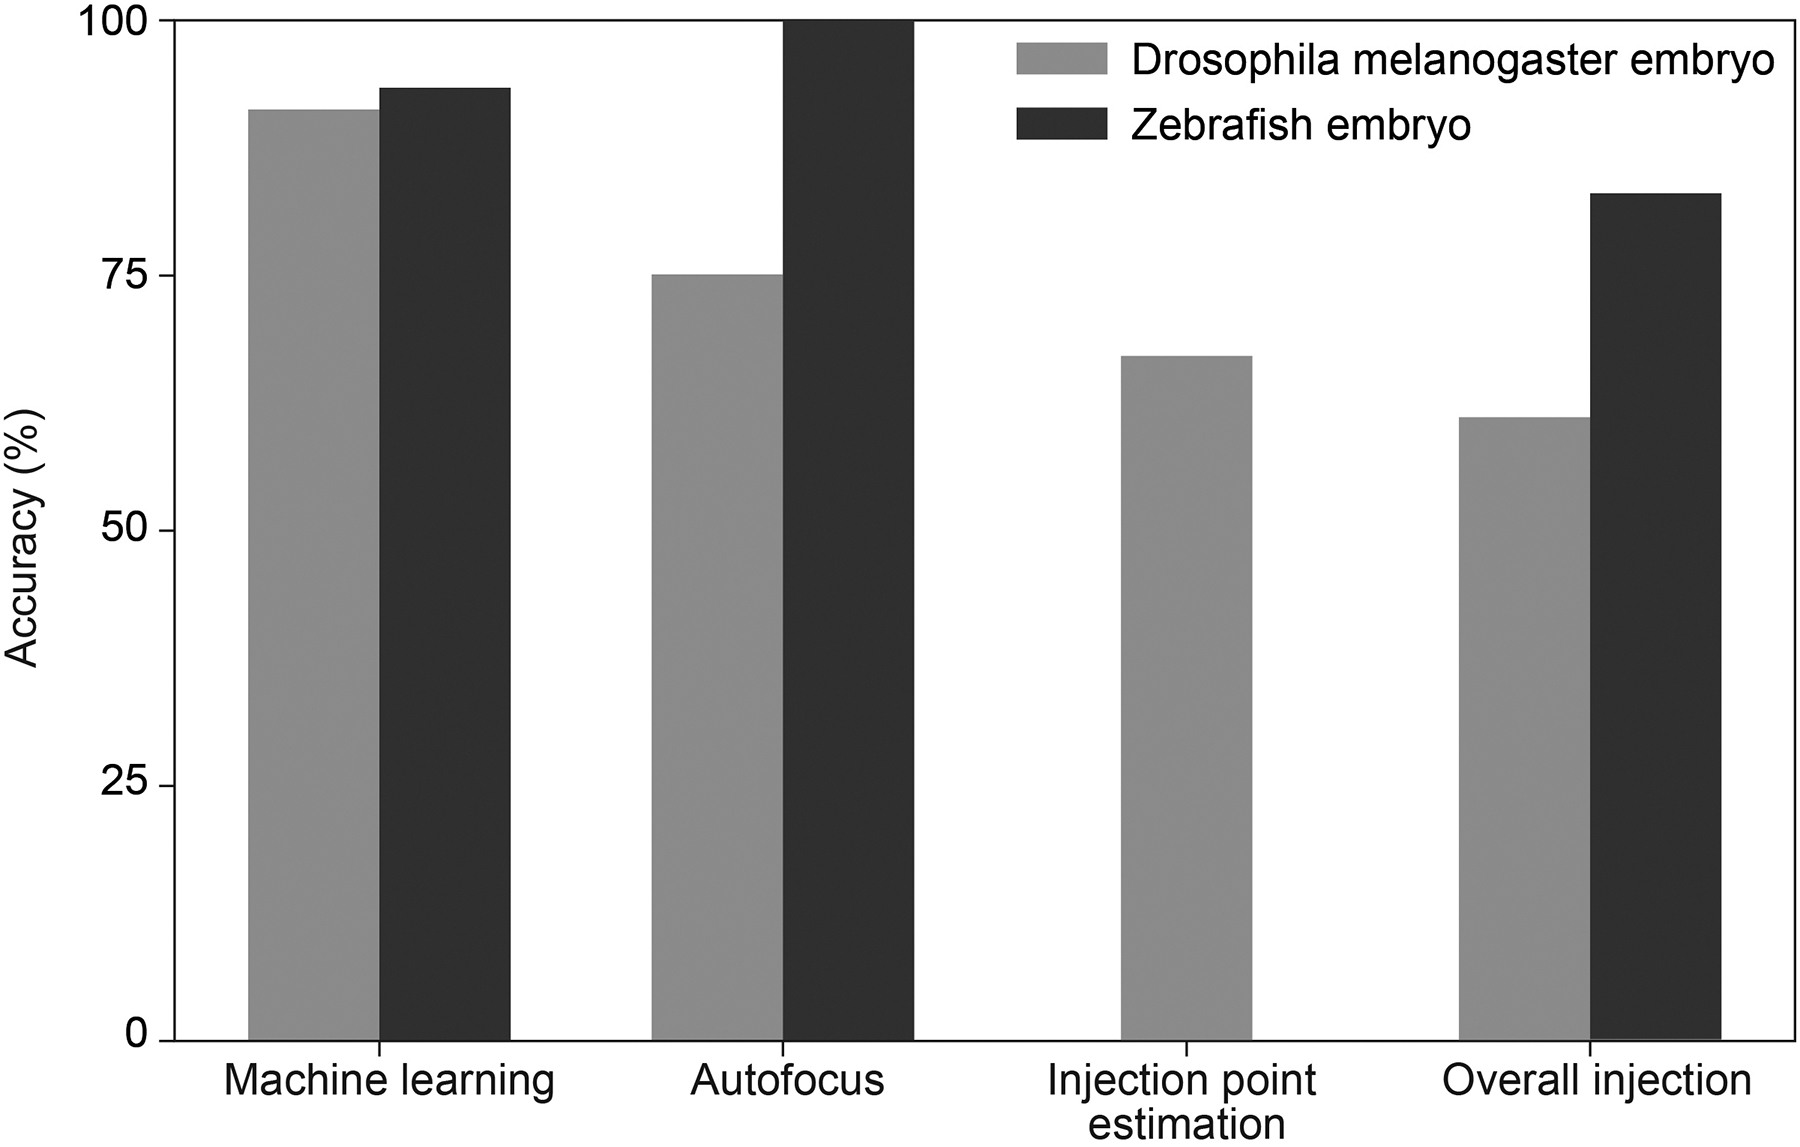
Robot performance
C. Transformation from DSLR field of view to vertical microscope field of view
The location of the DSLR camera, the vertical microscope and the two inclined microscopes are fixed with respect to the coordinate system defined by the XYZ stage. Transformation matrices need to be computed to translate any point in the field of view (FOV) of one imaging system to the FOV of other imaging systems. To determine the transformation matrix for the XYZ stage to move to any location on the agar plate, as imaged by the DSLR camera to the center of the FOV of the vertical microscope, three fiducial markers were placed on the agar plate and the whole plate was imaged using the DSLR camera. The centroid of the markers in pixel coordinates of the DSLR image were determined. The agar plate was moved using the XYZ stage so that the centroid of the fiduciary marker was coincident with the center of the FOV of the vertical microscope. The distance moved in the X and Y direction by the stage to execute this transformation was recorded. This process was repeated for each of the fiduciary markers and a transformation matrix was computed. It was observed that with each agar plate there was a constant error in the X and Y locations computed by the transformation matrix to get the embryo in the center of the FOV of the vertical microscope. To compensate for this error an offset must be calculated. To calculate the offset, the embryo centroid is detected at the vertical microscope. Then the location of the centroid of the embryo is moved to the center of the FOV of the vertical microscope by a specific X and Y amount using the XYZ stage. This offset is then applied to every X and Y location computed by the transformation matrix for every embryo detected on the plate.
D. Autofocus algorithm
The ML algorithm uses a macroscale image captured by the DSLR to define a bounding box surrounding each isolated embryo. The DSLR has a very large depth of focus and thus, only the X and Y locations for the embryos can be precisely determined. To estimate the Z location, the first embryo detected by the ML algorithm is imaged at multiple Z locations underneath the vertical microscope to capture a stack of images at high magnification (4X) and narrow depth of focus (~25 μm, Figure 4 (a)). For each image, a variance value was calculated using the Laplacian matrix [18]. Since the sharpness of an image is directly proportional to the variance, the image within the stack with the highest variance is the image captured when the embryo is putatively at the plane of focus (Figure 4 (b)). We however observed that this initial assessment was not accurate. To further refine the estimated Z location, a preliminary edge detection algorithm was used to identify the region of interest (ROI) within each image where sharp transitions in contrasts occur (Figure 4 (c)). In the second iteration, the variance within just the ROI was computed (Figure 4 (d), (e)) and the image captured with the highest variance was denoted as the best plane of focus (Figure 4 (f)).
Figure 4:
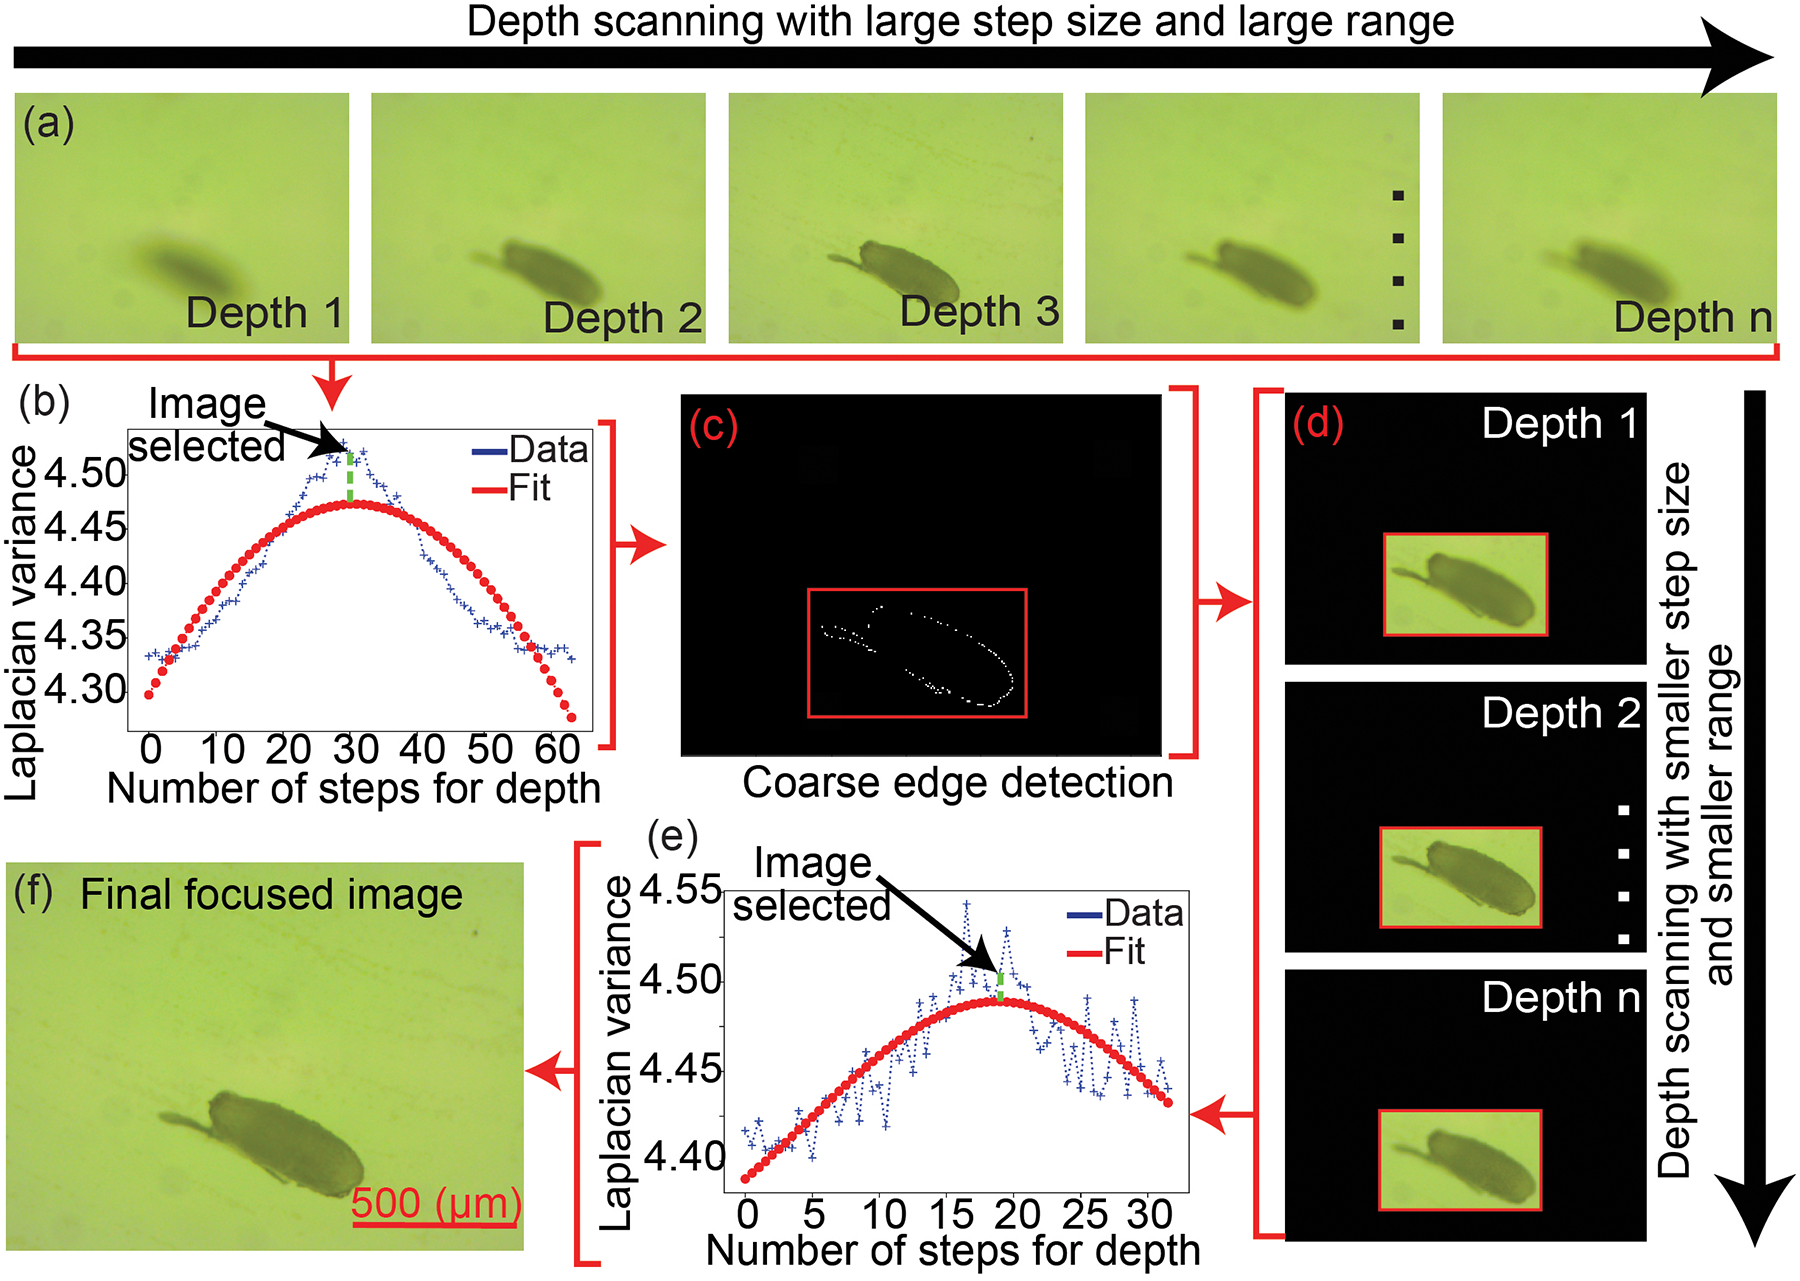
Autofocus algorithm: (a) Depth scanning and image acquisition of embryo at different z depths from the microscope objective. (b) Laplacian variance of the image stack shown in (a). (c) Region of interest (ROI). (d) Depth scanning and image acquisition
E. Micropipette preparation and tip detection
The micropipettes were prepared by first pulling glass aluminosilicate capillaries using a Flaming/Brown Micropipette Puller (P-97, Sutter Instrument co.). Once pulled, a Microelectrode Beveler (BV-10, Sutter Instrument co.) was used to bevel the micropipettes to get tip diameters ranging from 5 to 10 μm (Figure 5 (a)). The micropipette is installed in the pipette holder and images are captured using the two inclined microscopes at 2X magnification. A Faster R-CNN algorithm was trained and used to detect the tip of the micropipette (Figure 5 (b)) [17]. Tip detection, which takes 0.2 secs (Table 1), is performed after every microinjection to account for the movement of the micropipette during the microinjection.
Figure 5:
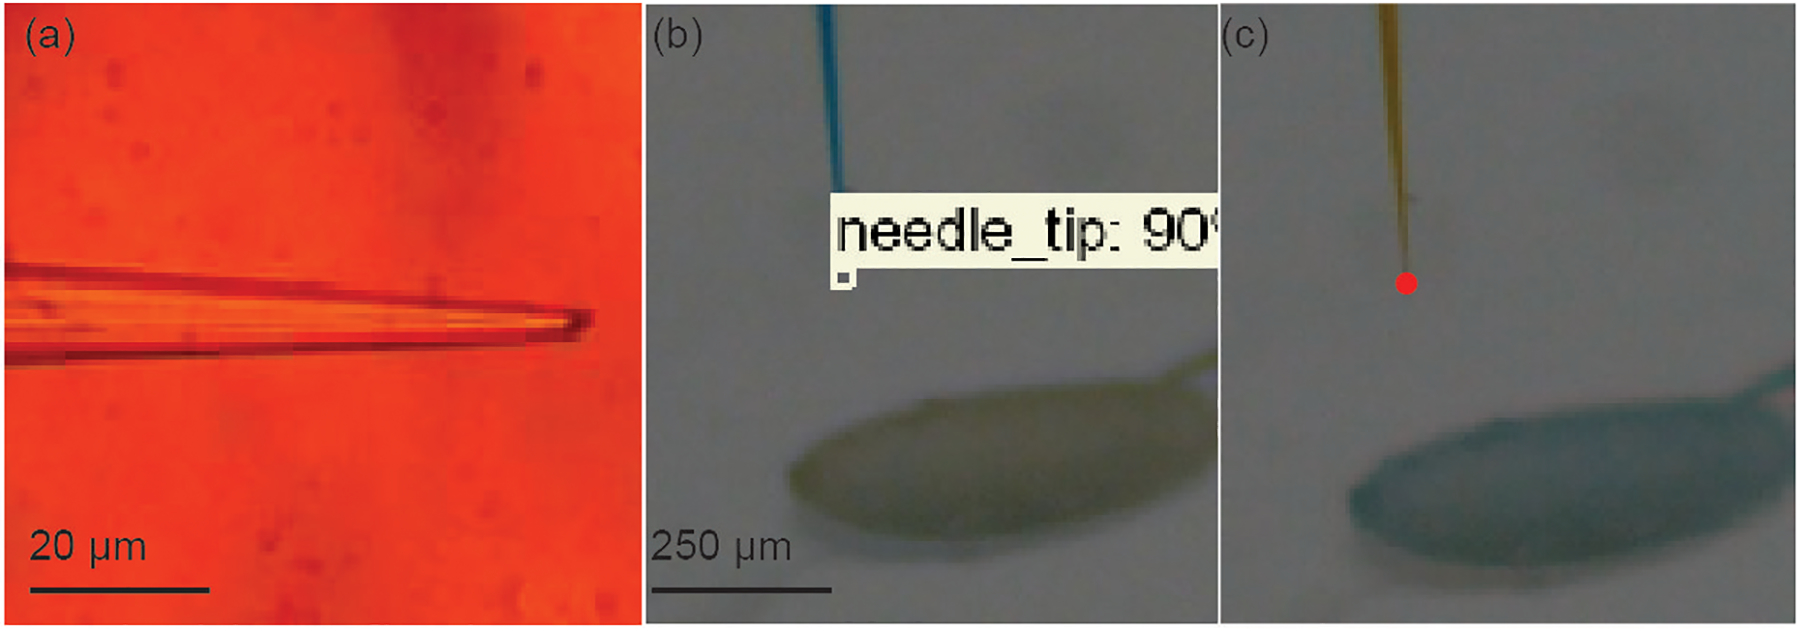
(a) Photograph of a beveled micropipette (b) The micropipette imaged using two inclined microscopes and tip detected is annotated using red dots.
Table 1.
Robot speed
| Process | Time (sec) | Repeated |
|---|---|---|
| Machine learning | 30 | No |
| DSLR to vertical microscope | 2 | No |
| Autofocus | 23 | No |
| Micropipette tip detection | 0.2 | Yes |
| Microinjection | 15 | Yes |
F. Estimating injection point and performing microinjection
Microinjections need to be carried out within specific locations in the anatomy of an embryo. In Drosophila melanogaster, microinjection is typically targeted at the posterior of an embryo [4], whereas prominent dorsal appendages are located at the anterior of an embryo. A Faster R-CNN algorithm can be used to detect these features and define an injection point [17].
To determine where the injection point is located, the XYZ stage moves the agar plate by a set X, Y and Z distance to move the embryo from the plane of focus of the vertical microscope to a location approximately beneath the micropipette tip where it can be imaged using the two inclined microscopes. The images are analyzed, and a Faster R-CNN algorithm is used to first detect the centroid of the embryo in both perspectives [17]. Then, the XYZ stage moves the agar plate such that the embryo centroid is ~200 μm underneath the micropipette tip. This allows the embryo to be imaged in focus with both inclined microscopes (Figure 6 (A, a)).
Figure 6:
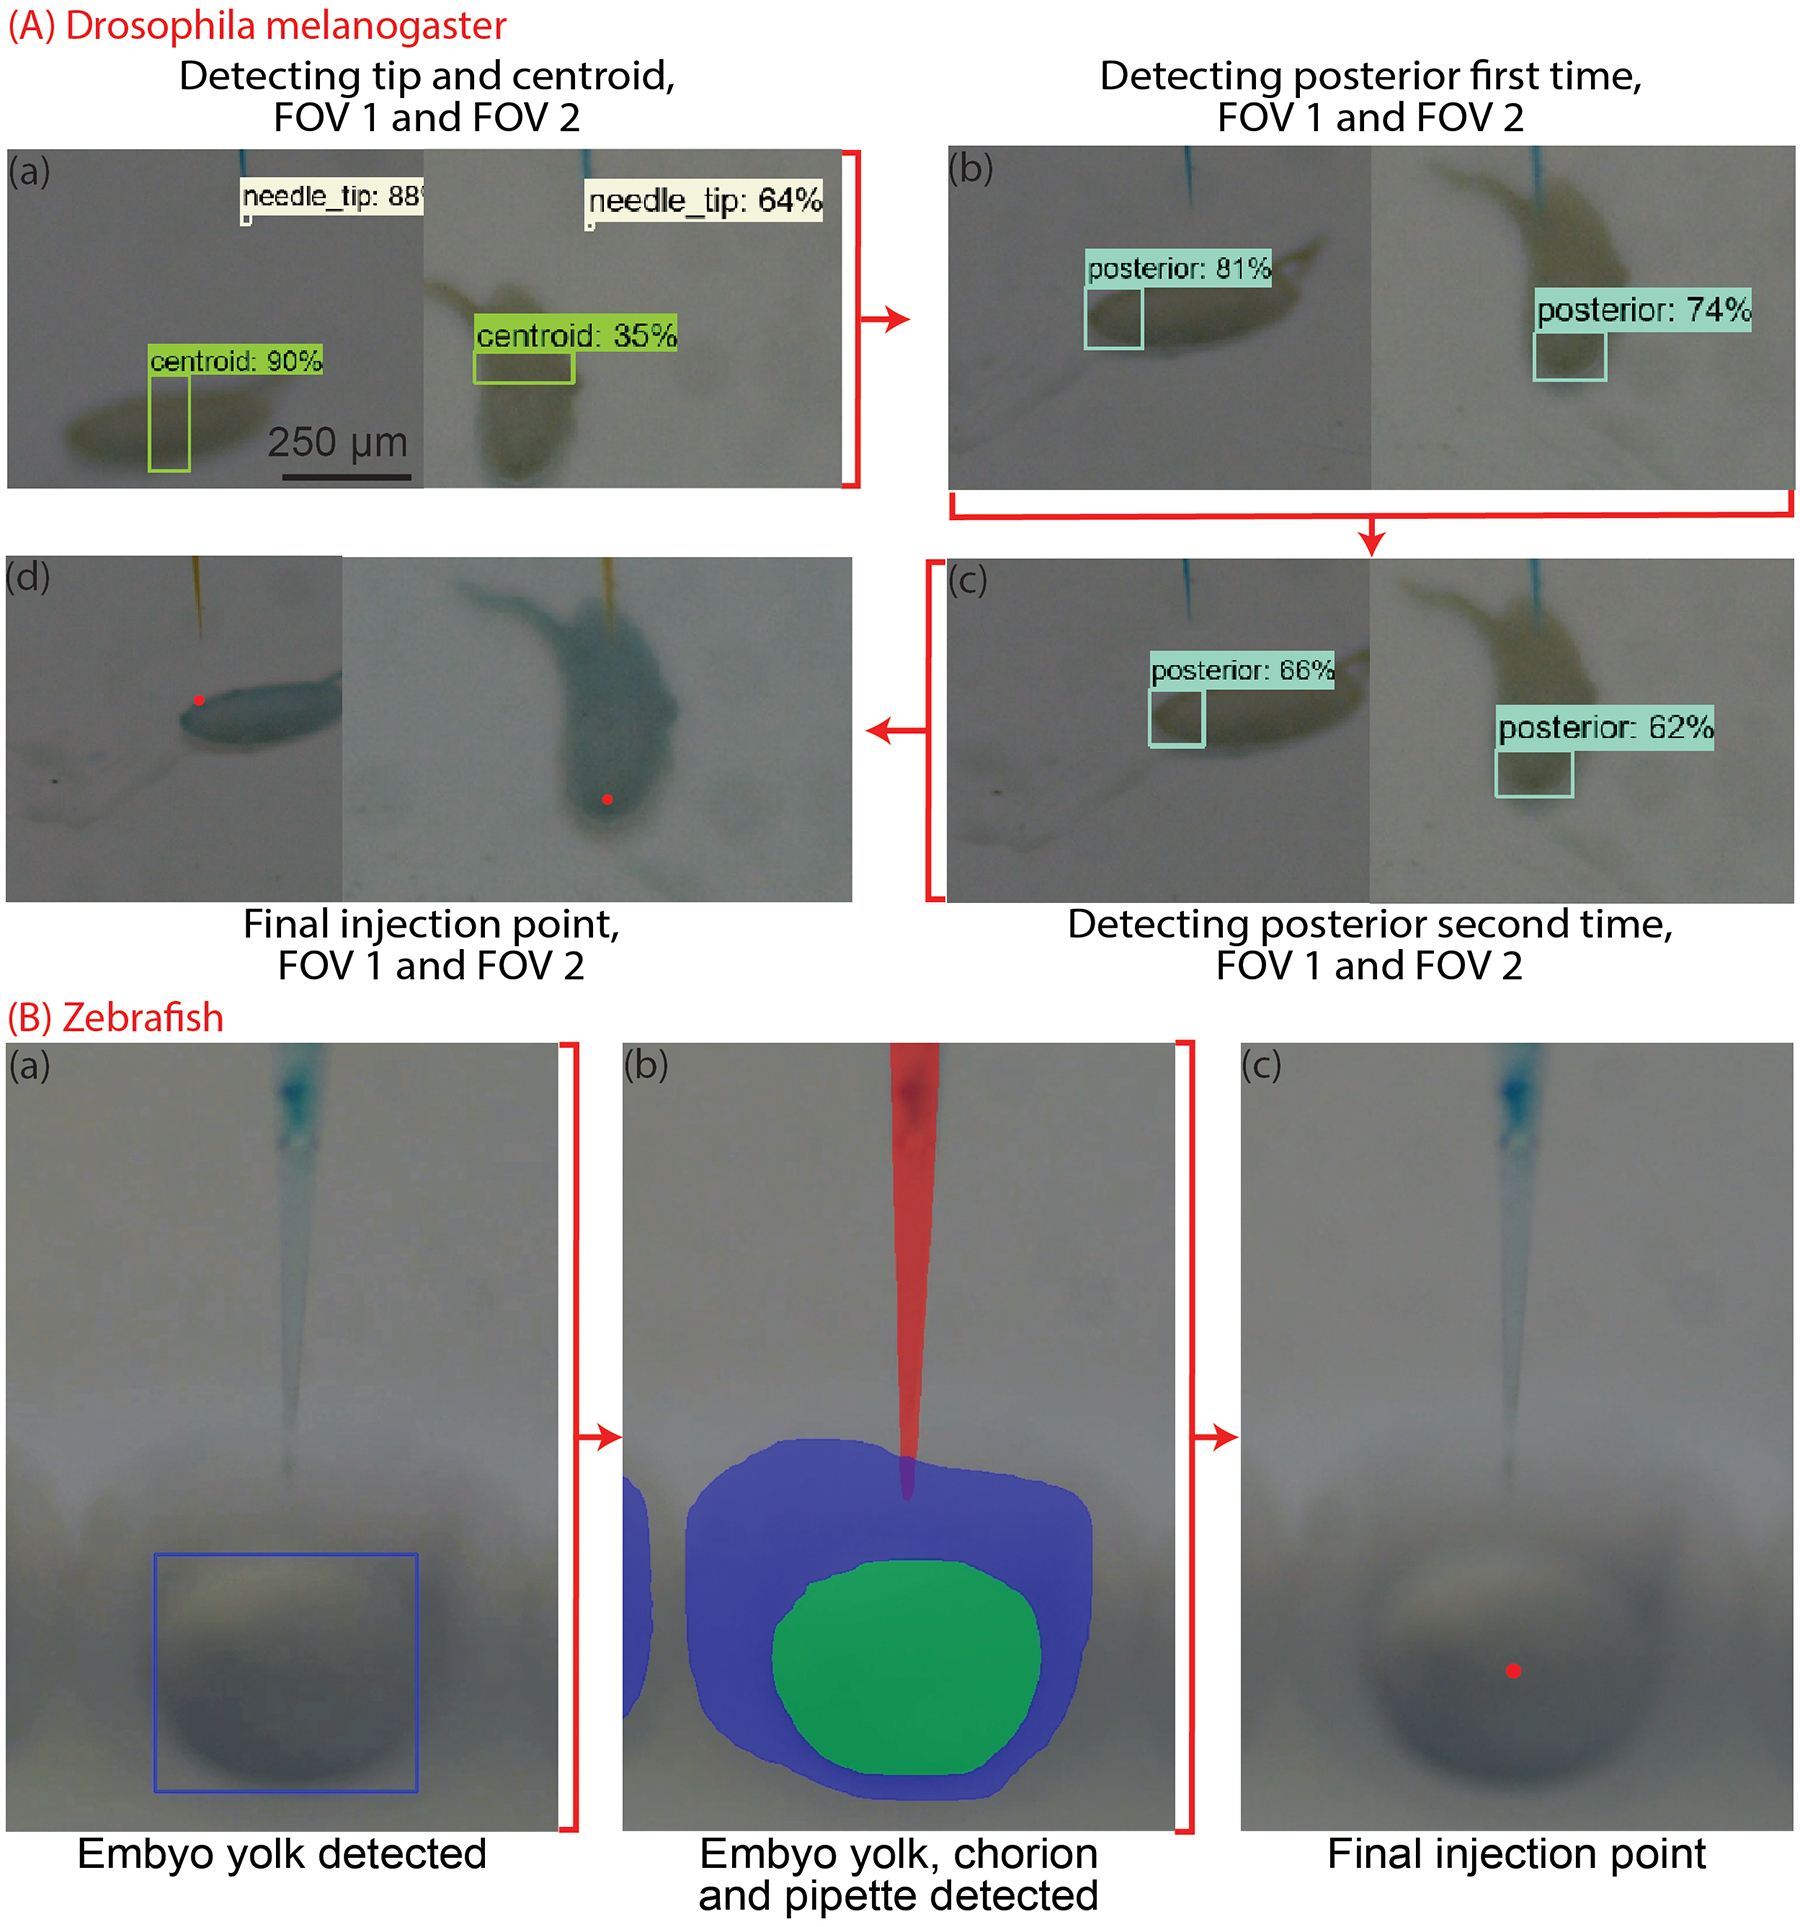
Step by step illustration of the microinjection of the injection point estimation algorithm for (A) Drosophila melanogaster embryos (B) Zebrafish embryos.
Next, the Faster R-CNN algorithm is used to detect the posterior of the embryo in both perspectives. The XYZ stage moves the plate such that the micropipette tip is underneath the posterior in both FOVs (Figure 6 (A, b)). To increase the accuracy of the injection, this step is repeated again (Figure 6 (A, c)). From this, the Xinj and Yinj coordinates are calculated to be the center of the bounding box determined by the ML algorithm (Figure 6 (A, d)). The Zinj coordinate for the embryo is determined by finding the upper left y coordinate of the bounding box of the embryo for the more horizontally aligned embryo (Figure 6 (A, d)).
Microinjections into the zebrafish embryos are typically performed within the yolk. The zebrafish embryos are circular with a concentric yolk in them [19]. A ML algorithm is used to detect the bounding box around the yolk of the zebrafish embryo (Figure 6, (B)). The center of the bounding box is considered as the injection point for the zebrafish embryo.
Once the injection point is estimated, the XYZ stage moves the agar plate such that the micropipette tip is located at the injection point (Figure 7 (a)) after which the Stage moves the plate up by 100 μm to insert the micropipette into the embryo (Figure 7 (b)). A calibrated pressure controller is used to deliver air pressure at the back of the micropipette to deliver the solution as per experiment requirements (Figure 7 (c)). Constant back pressure is applied to the micropipette throughout the experiment to avoid clogging of the micropipette.
Figure 7:
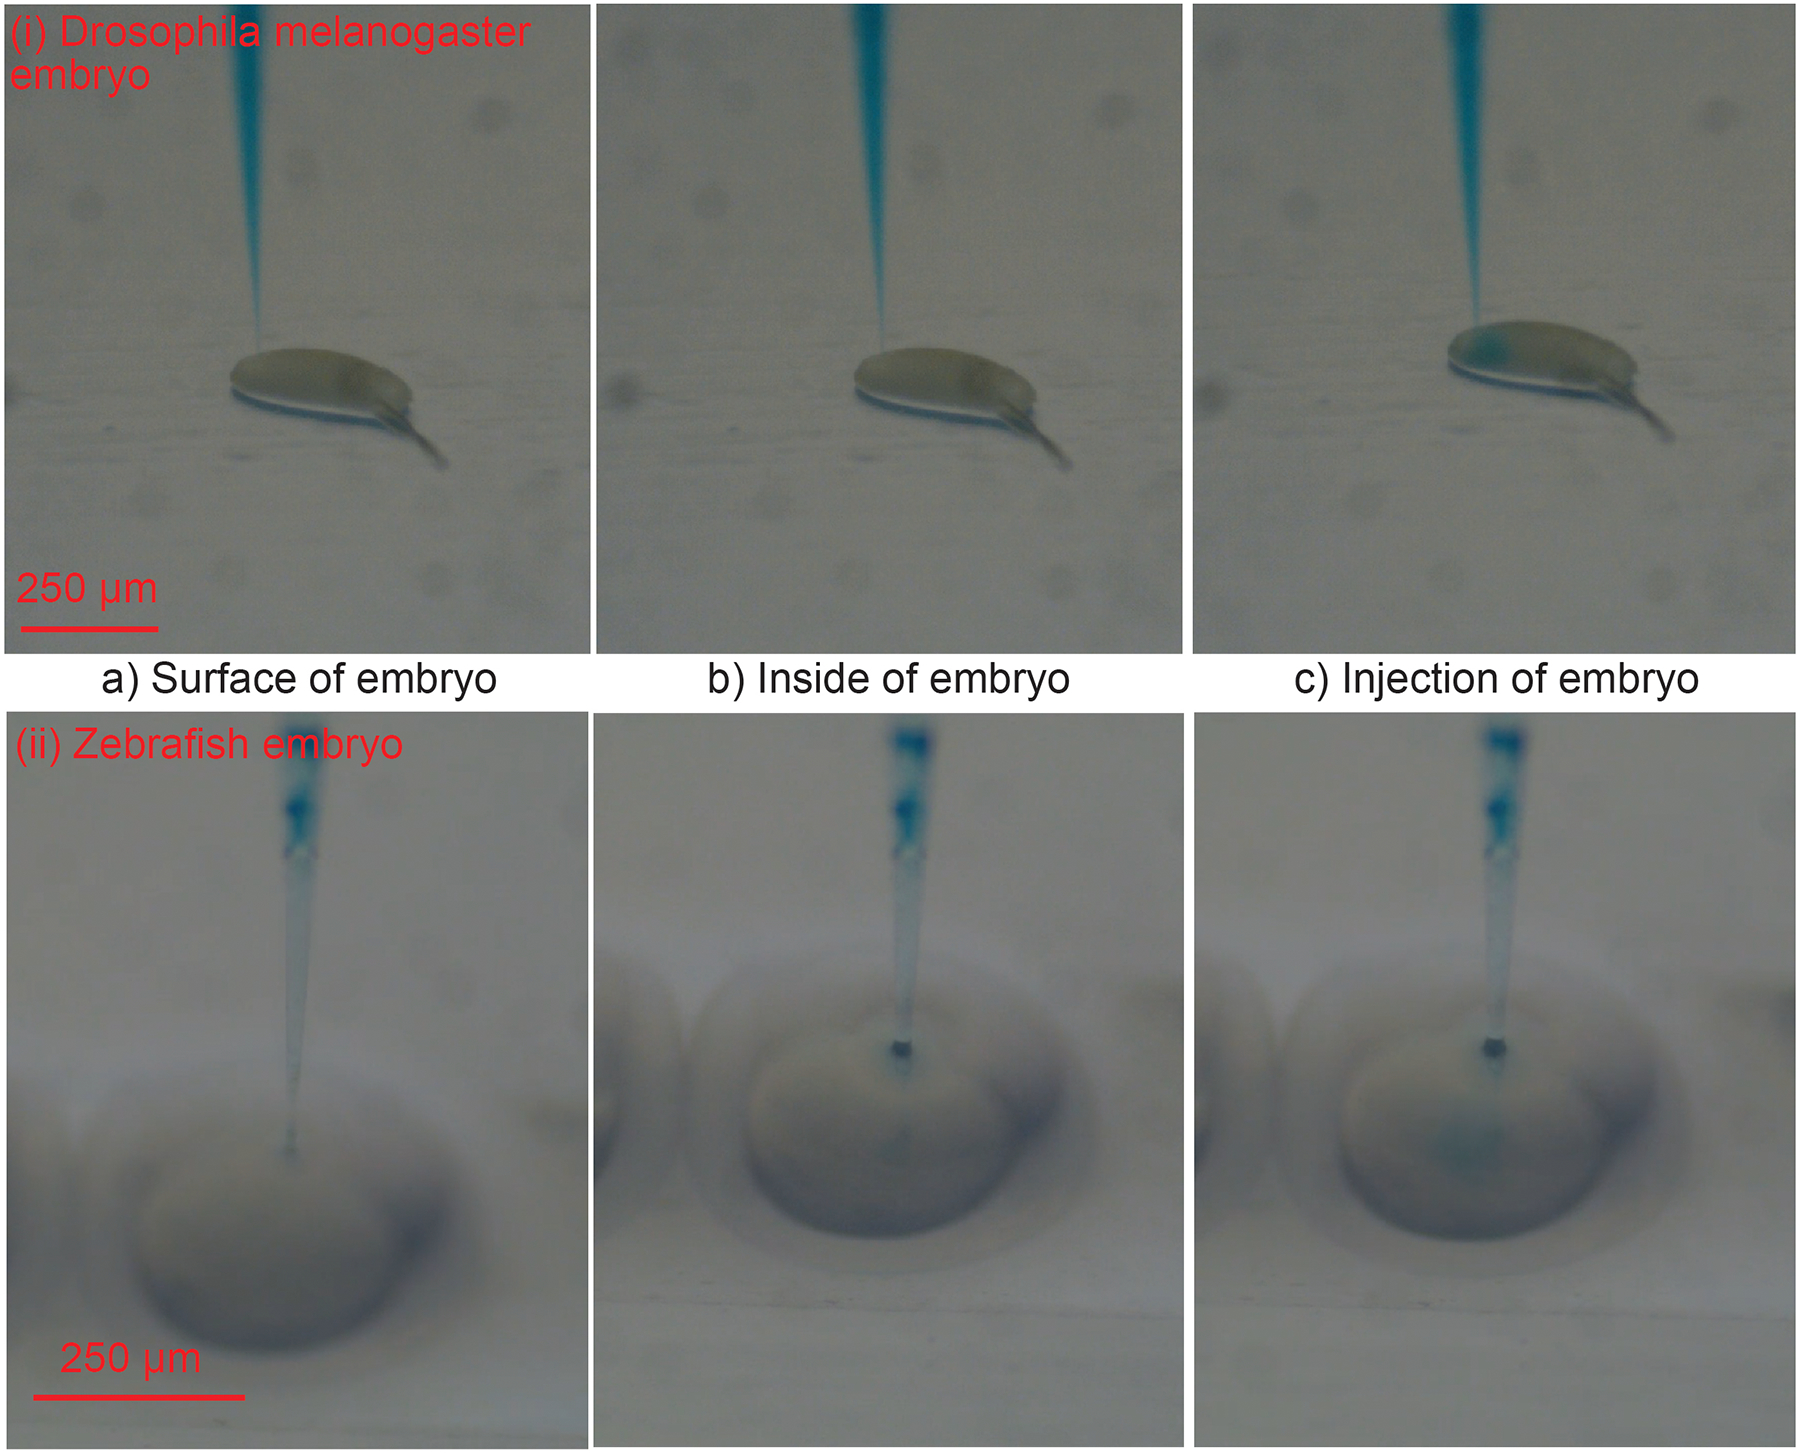
Step by step illustration of the microinjection of blue dye into (i) Drosophila melanogaster embryos (ii) Zebrafish embryos.
IV. Results
A. Machine learning algorithm accuracy and repeatability
The performance of the ML algorithm was evaluated by manually inspecting each object detected. With regards to Drosophila melanogaster, these include single isolated embryos, embryos that were clustered together into clumps, bubbles on the agar plate and other debris that have features and sizes similar to the embryos. Of note, Drosophila melanogaster embryos are ~500 μm long and ~100 μm wide. In comparison, zebrafish embryos are circular in shape, with a diameter of ~700 μm and an inner yolk of ~500 μm. Further, the zebrafish embryos that are dead and not viable for microinjection typically appear to have darker features. This can be used to train the ML algorithm to detect dead embryos and ignore these for further operations with the robot.
The ML algorithm takes 30 seconds to analyze the image taken by the DSLR camera (Table 1). We manually inspected the detections made by the ML algorithm for 17 agar plates (5 agar plates containing Drosophila melanogaster embryos, and 12 agar plates containing zebrafish embryos). On average each plate containing Drosophila melanogaster embryos had 45 embryos that were single and isolated, whereas 2 sets of embryos were clustered together into clumps (Figure 1). Only single isolated Drosophila melanogaster embryos were analyzed further by the robot and targeted for microinjection. The ML algorithm was able to detect single isolated embryos with an accuracy of 91% (n = 223) (Figure 8). Similarly, of the plates analyzed, the average number of zebrafish embryos that were single on an agar plate were 61, whereas an average of 4 embryos were dead embryos and the ML algorithm was able to detect single embryos with an accuracy of 94% (n = 775) (Figure 8).
B. Autofocus algorithm accuracy and speed
The accuracy of the autofocus algorithm was determined by visually observing if the embryo was in focus in the vertical microscope field of view. The algorithm takes 23 seconds to analyze each image stack (Table 1). The algorithm was successful 75% of the time (n = 16 stacks analyzed) for Drosophila melanogaster, whereas the success rate of the algorithm was 100% when trying to focus zebrafish embryos (n = 12 stacks analyzed). The clear contrasting features of the zebrafish embryos made it easier to use the same autofocus algorithm with higher accuracy. The approximate value of the Z-axis location is still acceptable to perform microinjection for Drosophila melanogaster embryos when the image was not in focus 25% of the time.
C. Injection point estimation algorithm accuracy
Similar to the autofocus algorithm, the accuracy of the injection point estimation algorithm was determined by visually observing if the micropipette tip successfully penetrated the embryo at the desired injection location. Of the trials analyzed, the robot was able to successfully microinject 67% (n = 89) of the Drosophila melanogaster embryos at the desired injection point, whereas the robot was successful 88% (n = 739) of the time when attempting to microinject zebrafish embryos (Figure 8). Further, in 10% of the trials, the micropipette successfully penetrated the outer membrane of the zebrafish embryo at the desired location but failed to penetrate the yolk. Microinjection into each embryo takes ~15 seconds (Table 1).
D. Overall accuracy, speed
To calculate the overall accuracy of the robot, the accuracies of the ML algorithm and injection point estimation algorithm, were considered. Since the autofocus algorithm is only used once per experiment and the approximate Z-axis location determined for the plate is acceptable for microinjection, it was found that the autofocus algorithm accuracy did not affect the overall accuracy of the robot. Thus, the overall accuracy of the robot was found to be 61% when attempting to microinject Drosophila melanogaster embryos and 83% when attempting to microinject zebrafish embryos (Figure 8). The automated microinjection robot does not require any manual sample preparation because the embryos are directly injected on the agar plate where they are collected. Based on the results shown in Table 1, we estimate that the robot can perform 240 microinjections per hour. When comparing the robot’s microinjection speed to that of a manual operator, the robot injects nearly 2.4–4.8 times as fast as that of a manual operator (50–100 embryos).
E. Post injection survival rate
We next evaluated if Drosophila melanogaster embryos automatically microinjected survived the procedures. After targeted microinjection of embryos on the plate, the plates were incubated at 66°F for 3 days to allow development from embryo to larva. Development into a larva after 3 days was categorized as a successful survival, which was found to be 26% (n = 97), as compared to 88% (n = 16) of embryos in the same plate that were not injected (Figure 9). The survival rate we achieved with the robotic microinjection method is comparable to manual microinjection (~30%) [20].
Figure 9:
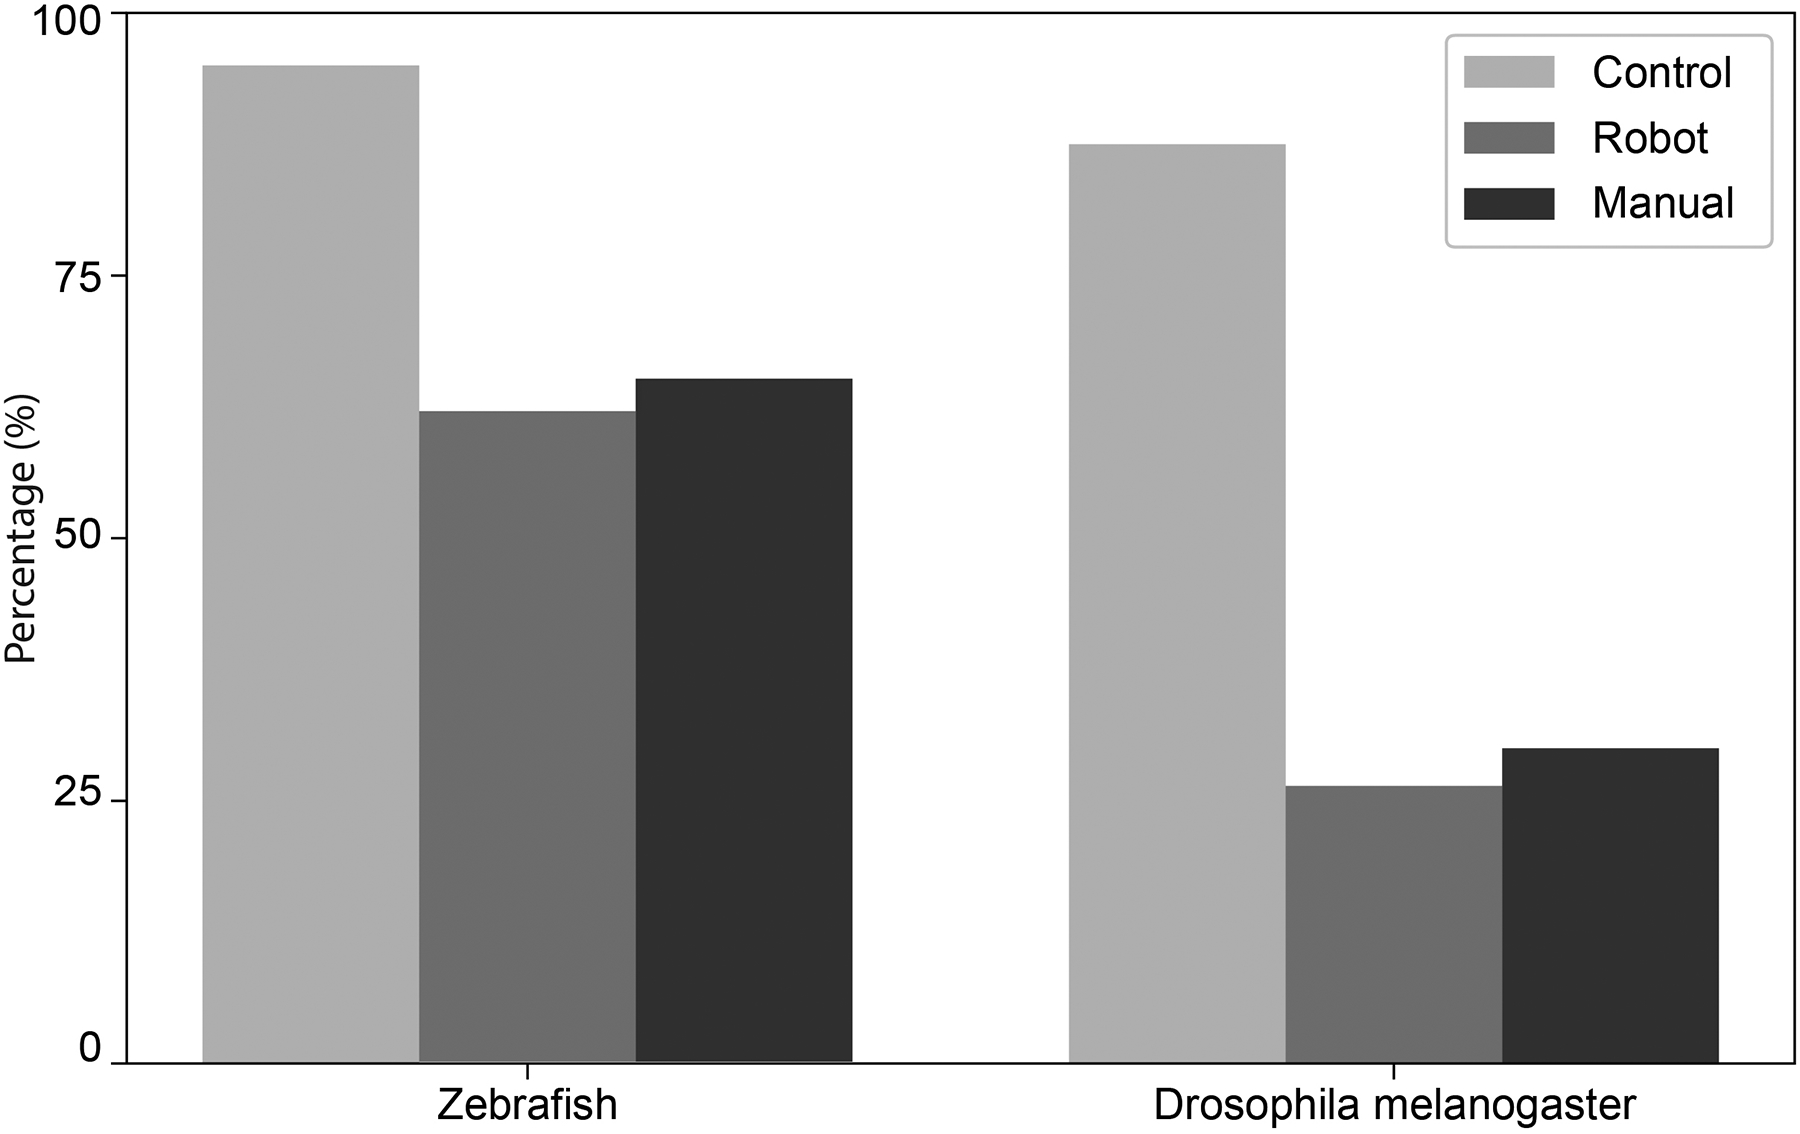
Survival rates for zebrafish and Drosophila melanogaster
Zebrafish embryos were incubated at 81°F for 5 days post injection. At the day 5 time point, an embryo was considered survived if it had hatched and was able to swim upright in the water column, had proper cardiac development, eye and tail musculature development, fins, and a functional swim bladder. Of the automatically microinjected zebrafish embryos, 63% (n = 775) of embryos survived after 5 days as compared to 95% of embryos in the same plate that were not injected (n = 99, Figure 9). This is comparable to the survival rates reported previously in manual microinjection experiments (~65%) [21].
We next performed preliminary experiments to test if the microinjection robot can be used for somatic transgenesis in zebrafish embryos [22], [23]. We injected a plasmid (a circular DNA molecule), that contains a gene encoding for the enhanced green fluorescent protein (EGFP), into 1–4 cell stage embryos. GFP expression was observed both 24 hours and 5 days post injection (Figure 10 (A, (i, ii))). These preliminary results indicate that robotic microinjection can facilitate somatic transgenesis for zebrafish embryos.
Figure 10:

(A) Zebrafish expressing green fluorescent protein: (i) Embryonic stage, day 1, (ii) Larval stage, day 5, post microinjection. (B) Drosophila melanogaster expressing the green fluorescent protein in the second generation
For Drosophila melanogaster embryos, experiments were run to test if the microinjection robot can be used for germline transgenesis. We injected the plasmid pigA3GFP into preblastoderm embryos and searched for transgenic flies in the second generation after injection [24]. The plasmid pigA3GFP contains the GFP gene under the control of eye-specific regulatory DNA sequences and hence the transgenic flies are easily recognizable by their fluorescent eyes (Figure 10 (B)). These preliminary results show that robotic microinjection produced germline transgenesis for Drosophila melanogaster embryos.
V. Conclusions and future work
This robotic platform allows us to successfully target the Drosophila melanogaster and zebrafish embryos in 3-D space with a micropipette for automated microinjection. The robot performs microinjections at an estimated rate of 240 microinjections per hour (Table 1) with an overall success rate of 61% for Drosophila melanogaster and 83% for zebrafish embryos (Figure 8). Survivability rates post automated microinjections by the robot are comparable to manual microinjection (Figure 9) [20], [21]. Further, the ML, autofocus and injection point estimation algorithms can be used for other organisms with respective datasets. As a result, we think this platform can also be used for other model organisms like roundworms (Caenorhabditis elegans), mosquito embryos (Culicidae), sea urchins (Echinoidea) and frog (Xenopus) oocytes to perform microinjection experiments.
Acknowledgment
This work was supported by grants 1R21OD028214 and 1R24OD028444 from the National Institutes of Health (NIH) Office of the Director. This work was also partially funded by Minnesota Sea Grant Program. We would also like to thank Samuel Erickson and Nicholas Jacob at the University of Minnesota for demonstrating the manual microinjection procedure and providing useful inputs and insights for this automation project. The UMN graduate school Diversity of Views and Experiences (DOVE) fellowship supported Andrew Alegria.
References
- [1].Dean DA, “Microinjection,” pp. 409–410, 2013, doi: 10.1016/B978-0-12-374984-0.00945-1. [DOI]
- [2].Fitzharris G, Carroll J, and Swann K, Electrical-assisted microinjection for analysis of fertilization and cell division in mammalian oocytes and early embryos, 1st ed., vol. 144. Elsevier Inc., 2018. [DOI] [PubMed] [Google Scholar]
- [3].Rubin G and Spradling A, “Genetic transformation of Drosophila with transposable element vectors,” Science (80-.)., vol. 218, no. 4570, pp. 348–353, Oct. 1982, doi: 10.1126/science.6289436. [DOI] [PubMed] [Google Scholar]
- [4].Spradling A and Rubin G, “Transposition of cloned P elements into Drosophila germ line chromosomes,” Science (80-.)., vol. 218, no. 4570, pp. 341–347, Oct. 1982, doi: 10.1126/science.6289435. [DOI] [PubMed] [Google Scholar]
- [5].Rosen JN, Sweeney MF, and Mably JD, “Microinjection of Zebrafish Embryos to Analyze Gene Function Part 3 : Injection,” no. March, pp. 1–5, 2009, doi: 10.3791/1115. [DOI] [PMC free article] [PubMed] [Google Scholar]
- [6].Dietzl G et al. , “A genome-wide transgenic RNAi library for conditional gene inactivation in Drosophila.,” Nature, vol. 448, no. 7150, pp. 151–6, Jul. 2007, doi: 10.1038/nature05954. [DOI] [PubMed] [Google Scholar]
- [7].Schubert S, Keddig N, Hanel R, and Kammann U, “Microinjection into zebrafish embryos (Danio rerio) - a useful tool in aquatic toxicity testing ?,” 2014, doi: 10.1186/s12302-014-0032-3. [DOI]
- [8].Zhao Y, Sun H, Sha X, Gu L, Zhan Z, and Li WJ, “A Review of Automated Microinjection of Zebrafish Embryos,” 2018, doi: 10.3390/mi10010007. [DOI] [PMC free article] [PubMed]
- [9].Chow YT et al. , “A High-Throughput Automated Microinjection System for Human Cells With Small Size,” vol. 21, no. 2, pp. 838–850, 2016. [Google Scholar]
- [10].Delubac D et al. , “Lab on a Chip Microfluidic system with integrated microinjector for automated Drosophila embryo injection {,” pp. 4911–4919, 2012, doi: 10.1039/c2lc40104e. [DOI] [PubMed] [Google Scholar]
- [11].Zappe S, Fish M, Scott P, and Solgaard O, “Automated MEMS-based Drosophila embryo injection system for high-throughput RNAi screens,” pp. 1012–1019, 2006, doi: 10.1039/b600238b. [DOI] [PubMed] [Google Scholar]
- [12].Wu Q et al. , “Integration of autopatching with automated pipette and cell detection in vitro,” J. Neurophysiol, vol. 116, no. 4, pp. 1564–1578, 2016, doi: 10.1152/jn.00386.2016. [DOI] [PMC free article] [PubMed] [Google Scholar]
- [13].Suk H-J, van Welie I, Kodandaramaiah SB, Allen B, Forest CR, and Boyden ES, “Closed-Loop Real-Time Imaging Enables Fully Automated Cell-Targeted Patch-Clamp Neural Recording In Vivo,” Neuron, vol. 95, no. 5, pp. 1037–1047.e11, Aug. 2017, doi: 10.1016/j.neuron.2017.08.011. [DOI] [PMC free article] [PubMed] [Google Scholar]
- [14].Alegria A, Joshi A, O’Brien J, and Kodandaramaiah SB, “Single neuron recording: progress towards high-throughput analysis,” Bioelectron. Med, pp. 3–6, 2020, doi: 10.2217/bem-2020-0011. [DOI] [PMC free article] [PubMed] [Google Scholar]
- [15].Shull G, Haffner C, Huttner WB, Kodandaramaiah SB, and Taverna E, “Robotic platform for microinjection into single cells in brain tissue,” EMBO Rep, vol. 20, no. 10, pp. 1–16, 2019, doi: 10.15252/embr.201947880. [DOI] [PMC free article] [PubMed] [Google Scholar]
- [16].Shull G, Haffner C, Huttner WB, Taverna E, and Kodandaramaiah SB, “Manipulation of Single Neural Stem Cells and Neurons in Brain Slices using Robotic Microinjection | Protocol,” JoVE, 2020. https://www.jove.com/t/61599/manipulation-single-neural-stem-cells-neurons-brain-slices-using (accessed Oct. 30, 2020). [DOI] [PubMed] [Google Scholar]
- [17].Ren S, He K, Girshick R, and Sun J, “Faster R-CNN: Towards Real-Time Object Detection with Region Proposal Networks,” Jun. 2015, Accessed: Sep. 10, 2019. [Online]. Available: http://arxiv.org/abs/1506.01497. [DOI] [PubMed] [Google Scholar]
- [18].Pech-Pacheco JL, Cristobal G, Chamorro-Martinez J, and Fernandez-Valdivia J, “Diatom autofocusing in brightfield microscopy: a comparative study,” in Proceedings 15th International Conference on Pattern Recognition. ICPR-2000, vol. 3, pp. 314–317, doi: 10.1109/ICPR.2000.903548. [DOI] [Google Scholar]
- [19].Kimmel CB, Ballard WW, Kimmel SR, Ullmann B, and Schilling TF, “Stages of embryonic development of the zebrafish,” Dev. Dyn, vol. 203, no. 3, pp. 253–310, 1995, doi: 10.1002/aja.1002030302. [DOI] [PubMed] [Google Scholar]
- [20].Ringrose L, “Chapter 1 Transgenesis in Drosophila melanogaster,” vol. 561, pp. 3–19, doi: 10.1007/978-1-60327-019-9. [DOI] [PubMed] [Google Scholar]
- [21].Khosla K, Wang Y, Hagedorn M, Qin Z, and Bischof J, “Gold Nanorod Induced Warming of Embryos from the Cryogenic State Enhances Viability,” ACS Nano, vol. 11, no. 8, pp. 7869–7878, 2017, doi: 10.1021/acsnano.7b02216. [DOI] [PubMed] [Google Scholar]
- [22].Lawson ND and Weinstein BM, “In vivo imaging of embryonic vascular development using transgenic zebrafish,” Dev. Biol, vol. 248, no. 2, pp. 307–318, 2002, doi: 10.1006/dbio.2002.0711. [DOI] [PubMed] [Google Scholar]
- [23].Lee O, Tyler CR, and Kudoh T, “Development of a transient expression assay for detecting environmental oestrogens in zebrafish and medaka embryos,” BMC Biotechnol, vol. 12, 2012, doi: 10.1186/1472-6750-12-32. [DOI] [PMC free article] [PubMed] [Google Scholar]
- [24].Zhao Y, Li X, Cao GL, Xue RY, and Gong CL, “Expression of hIGF-I in the silk glands of transgenic silkworms and in transformed silkworm cells,” Sci. China, Ser. C Life Sci, vol. 52, no. 12, pp. 1131–1139, Dec. 2009, doi: 10.1007/s11427-009-0148-7. [DOI] [PubMed] [Google Scholar]


