

PURPOSE
Few studies have explored the biomarkers for predicting the heterogeneous outcomes of patients with advanced pancreatic adenocarcinoma showing stable disease (SD) on the initial postchemotherapy computed tomography. We aimed to devise a radiomics signature (RS) to predict these outcomes for further risk stratification.
MATERIALS AND METHODS
Patients with advanced pancreatic adenocarcinoma and SD after chemotherapy were included. Pancreatic lesions on initial postchemotherapy computed tomography images were evaluated by radiomics analysis for predicting early death (≤ 1 year). RS was then internally and externally tested. The progression-free survival and objective response rate were compared between the low-risk and high-risk group of patients classified following RS.
RESULTS
Approximately 62.7% of patients receiving chemotherapy showed SD at first response evaluation in the primary cohort, which were 59.6% and 57.9% in internal and external testing cohorts, respectively. The RS predicted 1-year overall survival well, with areas under the receiver operating characteristic curve of 0.91 in the training cohort, 0.90 in the validation cohort, 0.84 in the internal testing cohort, and 0.87 in the external testing cohort. The high-risk group had a shorter median progression-free survival (7.3 months v 9.0 months, P = .016, in the training cohort; 5.9 months v 9.2 months, P = .026, in the internal testing cohort) and a lower objective response rate (2.2% v 24.0% in the training cohort) than the low-risk group. In addition, RS was not related to the clinical characteristics and chemotherapy regimens.
CONCLUSION
RS independently predicts the outcomes of patients with SD after chemotherapy well and can help to improve treatment decisions by identifying patients for whom current treatment may not be suitable.
INTRODUCTION
Advanced pancreatic adenocarcinoma (PAC) is associated with poor outcomes,1 with a median overall survival (OS) of 11.1 months.2 Recent developments in precision oncology have improved PAC treatment; for example, a PARP inhibitor can be used for PACs with a BRCA1 mutation.3 However, 4%-7% of patients with PAC have BRCA1 mutation.3 Thus, traditional chemotherapy using FOLFIRINOX or adopting a gemcitabine-based regimen remains the main treatment for PAC.4 The majority of patients (range 53%-80%) show stable disease (SD) on the initial postchemotherapy computed tomography (CT), according to the RECIST 1.1.5-8 Thus, improving outcomes in patients showing SD using precision oncology methods is important.
CONTEXT
Key Objective
To devise a radiomics signature (RS) to predict the heterogeneous outcomes of patients with advanced pancreatic adenocarcinoma showing stable disease (SD) on the initial postchemotherapy computed tomography for further risk stratification.
Knowledge Generated
Our data showed that the majority (57.9% to 62.7%) of patients with advanced pancreatic adenocarcinoma receiving chemotherapy showed SD at first response evaluation, whereas the outcomes of such patients were various (overall survival, range: 1.9-75.7 months). The RS predicted 1-year overall survival well, with high areas under the receiver operating characteristic curve (0.84-0.91, in four cohorts). The high-risk group had a shorter median progression-free survival and lower objective response rate than the low-risk group. Furthermore, the RS was independent of the clinical characteristics and chemotherapy regimens.
Relevance
RS independently predicts the outcomes of patients with SD after chemotherapy well and can help to improve treatment decisions.
In clinical practice, we observed that the outcomes of patients with PAC with SD were heterogeneous. Some patients survive longer than 12 months, whereas the disease progresses rapidly in some (survival period, not more than 6 months).9,10 Disappointingly, under current circumstances, all patients diagnosed with SD still continue the primary chemotherapy regimen until the tumor progresses, regardless of these widely varying outcomes. These findings indicate that the RECIST is not the optimal biomarker for assessing whether the current chemotherapy regimen should be continued or discontinued in patients with SD. Therefore, it is urgent to explore a new model for further risk stratification to distinguish a subgroup of patients with SD who could potentially benefit from treatment.
To date, there has been no comprehensive study of biomarkers that can predict the outcomes in patients with PAC with SD early after first-line chemotherapy. Various biohumoral markers (eg, carbohydrate antigen [CA] 19-9,11,12 circulating ribonucleic acids,13,14 circulating tumor cell DNA,15,16 or gene signatures)17-19 have been associated with the outcomes of PAC. However, they are insufficient to stratify patients with SD accurately (eg, CA 19-9) or they are impractical in actual clinical settings (eg, circulating tumor DNA and gene signatures), because of their exorbitant cost, long turnaround time, reliance on bioinformatics expertise, or requirement of more than the limited specimen obtained by biopsy.
Radiomics analysis on the basis of tumor heterogeneity has great potential in efficacy evaluation and prognosis prediction in patients with PAC20-26 and many other malignancies.27-29 Radiomics captures heterogeneity across the entire tumor volume. However, previously published prognostic models on PAC have focused on the pretreatment CT texture features,23,25 as known treatment options for patients with advanced PAC are scarce, and the current first-line treatment cannot be changed, even if the baseline imaging findings suggest a worse outcome. By contrast, if survival can be predicted by the early CT features after standard chemotherapy, it will be helpful to determine whether high-risk patients need a more aggressive regimen or could participate in exploratory research. Therefore, the prognostic model using the initial CT radiomics features after chemotherapy may perform better. Furthermore, the basic radiomics workflow and radiomics features are well defined. CT data acquisition is a simpler approach for the management of PAC because of its lower cost and widespread availability.30 Moreover, it does not incur additional costs for patients. Thus, CT-based radiomics analysis can be readily translated into the clinic.
Therefore, this retrospective study aimed to use radiomics analysis to predict the outcomes in patients with advanced PAC and SD on initial CT images after first-line chemotherapy for further risk stratification to assist clinicians with decision making.
MATERIALS AND METHODS
Patients
Patients with pathologically proven advanced PAC who received chemotherapy at our center during August 2010 to March 2020 and showed SD at first response evaluation were reviewed. The Data Supplement presents the detailed inclusion and exclusion criteria, and the CONSORT diagram of patient selection is shown in Appendix Figure A1. Eligible patients were randomly divided into a training and a validation cohort by a computer algorithm in a ratio of 7:3. According to the above criteria, eligible patients in our center during April 2020 to April 2021 and those patients in center 2 during January 2013 to December 2020 were enrolled as independent internal and external testing cohorts, respectively (Fig 1A).
FIG 1.

(A) Flowchart of study population and (B) the study workflow. CT, computed tomography; DCA, decision curve analysis; GLCM, gray-level concurrence matrix; IEC, inclusion/exclusion criteria; LASSO, least absolute shrinkage and selection operator; OS, overall survival; PFS, progression-free survival; ROC, receiver operating characteristic; RS, radiomics signature; SYSMH, Sun Yat-sen Memorial Hospital; SYSUCC, Sun Yat-sen University Cancer Center.
Clinical data (eg, sex, age, tumor location, size, T stage, American Joint Committee on Cancer stage, and multiple organ metastasis [yes/no]) at baseline, CA 19-9 levels at baseline and after chemotherapy (the same period as the first follow-up CT), and chemotherapy regimens were obtained from medical records. The change ratio of CA 19-9 was calculated using the following formula: (CA 19-9 level at baseline – CA199 level after chemotherapy)/CA 19-9 level at baseline, and recorded as the CA19-9 ratio.
Treatment and Follow-up
The treatment regimens and follow-ups are shown in the Data Supplement. Patients were followed up for survival duration until November 2021. The OS was defined as the time from the start of chemotherapy to the date of death because of any cause or date of the last follow-up.
Assessment of Chemotherapy Efficacy
For all patients, the efficacy assessment was performed on all continuous follow-up CT examinations after chemotherapy, according to RECIST 1.1.31 Two experienced radiologists (one with >10 years of subspecialty experience in pancreatic cancer and one with 5 years of experience) independently reviewed the CT images of each patient. The readers were blinded to the patient's details, including regimen and outcomes. Decisions were reached by consensus.
Radiomics Signature: Construction and Validation
Patients were grouped according to outcomes into better (OS ≥ 1 year) and worse outcome groups (OS < 1 year).
In the training cohort, we developed a prediction model using the radiomics features of the first follow-up CT after chemotherapy to distinguish between the two groups. The Data Supplement describes CT image acquisition, region of interest segmentation, radiomics feature extraction and selection, and contributing weight coefficients of parameters in the radiomics signature (RS). The rad-score was then calculated for each patient. Next, the performance of the radiomics model was tested in a validation cohort and independent internal and external testing cohorts.
Survival prediction models were also established using single clinical features (eg, the T stage, CA 19-9 level at baseline, CA 19-9 ratio, and tumor size). The discrimination performance of established models was quantified by receiver operating characteristic (ROC) curve analysis and area under the curve (AUC) value. The corresponding cutoff value of the rad-score was calculated.
Clinical Use of Decision Curve Analysis
To evaluate the added value of the RS to individual clinical features in predicting a < 1-year OS for patients with advanced PAC with SD, we developed four decision curves, on the basis of the radiomics model: T stage, CA 19-9 level at baseline, CA 19-9 ratio, and tumor size models. The clinical utility could be demonstrated by calculating the net benefits for a range of threshold probabilities.
Comparison of the Serial Tumor Response Between the High-Risk and Low-Risk Groups
On the basis of the rad-score cutoff value, we classified patients into two groups: low-risk and high-risk groups. To compare the difference in tumor progression, the progression-free survival (PFS) in the two groups was statistically compared. The PFS end point was defined as the time from the start of chemotherapy to the date of tumor progression or death because of any cause. The chemotherapy regimens were also compared between the two groups.
To compare the tumor response in the high-risk and low-risk groups, the complete response (CR) or partial response (PR) from patients in the follow-up duration and intervals was recorded. The ORRs (proportion of patients with a PR or CR as the best response) in the two groups were calculated and compared. The maximal percentage reduction in the size of pancreatic lesions was calculated.
Statistical Analyses
Clinical characteristics between the four cohorts and between the high-risk and low-risk groups were compared using the chi-squared test. Univariate logistic analysis was used to assess the possible association of each predictor of the outcome variable. The difference in the objective response rate (ORR) between the high-risk and low-risk groups was analyzed using the chi-squared test. The ROC curve and AUC were applied to evaluate the predictive power of each model. The Data Supplement describes the software for statistical analysis.
RESULTS
Patient Characteristics
In the primary cohort in our center, 62.7% (324 of 517 patients) of patients showed SD at the first response evaluation (Appendix Fig A1A). As per the inclusion criteria, 101 patients (median, 57 years; range, 34-78 years; 58 women) with SD were included and divided into a training and a validation cohort (Fig 1A). In addition, two testing cohorts were enrolled as follows: 33 patients from our center were used as the independent internal testing cohort and 25 patients from center 2 as the external testing cohort (Fig 1A). In total, 59.6% and 57.9% of patients in the internal (Appendix Fig A1B) and external testing cohorts (Appendix Fig A1C) showed SD at the first response evaluation, respectively. The baseline characteristics of all patients are summarized in Table 1. There were no differences in clinical characteristics between the training and validation cohorts.
TABLE 1.
Clinical Characteristics of the Patients

The median follow-up durations of OS were 11.6 (95% CI, 10.1 to 14.3) months, 13.1 (95% CI, 9.5 to 15.5) months, 10.0 (95% CI, 6.5 to 12.9) months, and 9.4 (95% CI, 6.4 to 11.4) months in the training, validation, internal testing, and external testing cohorts, respectively. After univariate analysis, the clinical features showed no correlation with OS in the training cohort (Data Supplement).
RS Construction
The study workflow is shown in Figure 1B. Of the 1,540 extracted radiomics features, after five selection processes (Data Supplement and Appendix Fig A2), six texture features were selected to build the RS. The rad-score was calculated for each patient using the formula described in the Data Supplement.
Among the six features, three were features of the gray-level cooccurrence matrix and the other three were features of the gray-level run-length matrix. The features were distributed in each phase, and three (50%) of them were found in the venous phase. The contributing weight of each feature in the formula is shown in Appendix Fig A3. The features of the RS are described in the Data Supplement.
Validation of RS
The ROC curves of the clinical features and radiomics model are presented in Figure 2. The RS yielded higher AUCs of 0.91 (95% CI, 0.83 to 0.97) and 0.90 (95% CI, 0.79 to 0.99) in the training and validation cohorts, respectively, compared with those of the T-stage model (AUCs = 0.53 and 0.58 in the training and validation cohorts, respectively), the CA 19-9 model (AUCs = 0.51 and 0.52, respectively), the CA19-9 ratio model (AUCs = 0.65 and 0.63, respectively), or the tumor size model (AUCs = 0.55 and 0.42, respectively), showing favorable predictive efficacy. Two testing cohorts obtained similar results; the RS yielded higher AUCs of 0.84 (95% CI, 0.68 to 0.99) and 0.87 (95% CI, 0.71 to 1.0) in the internal and external testing cohorts, respectively. The RS achieved a sensitivity and specificity of 82% and 86%, respectively, for predicting a < 1-year OS, at an optimal rad-score cutoff value of 0.46.
FIG 2.
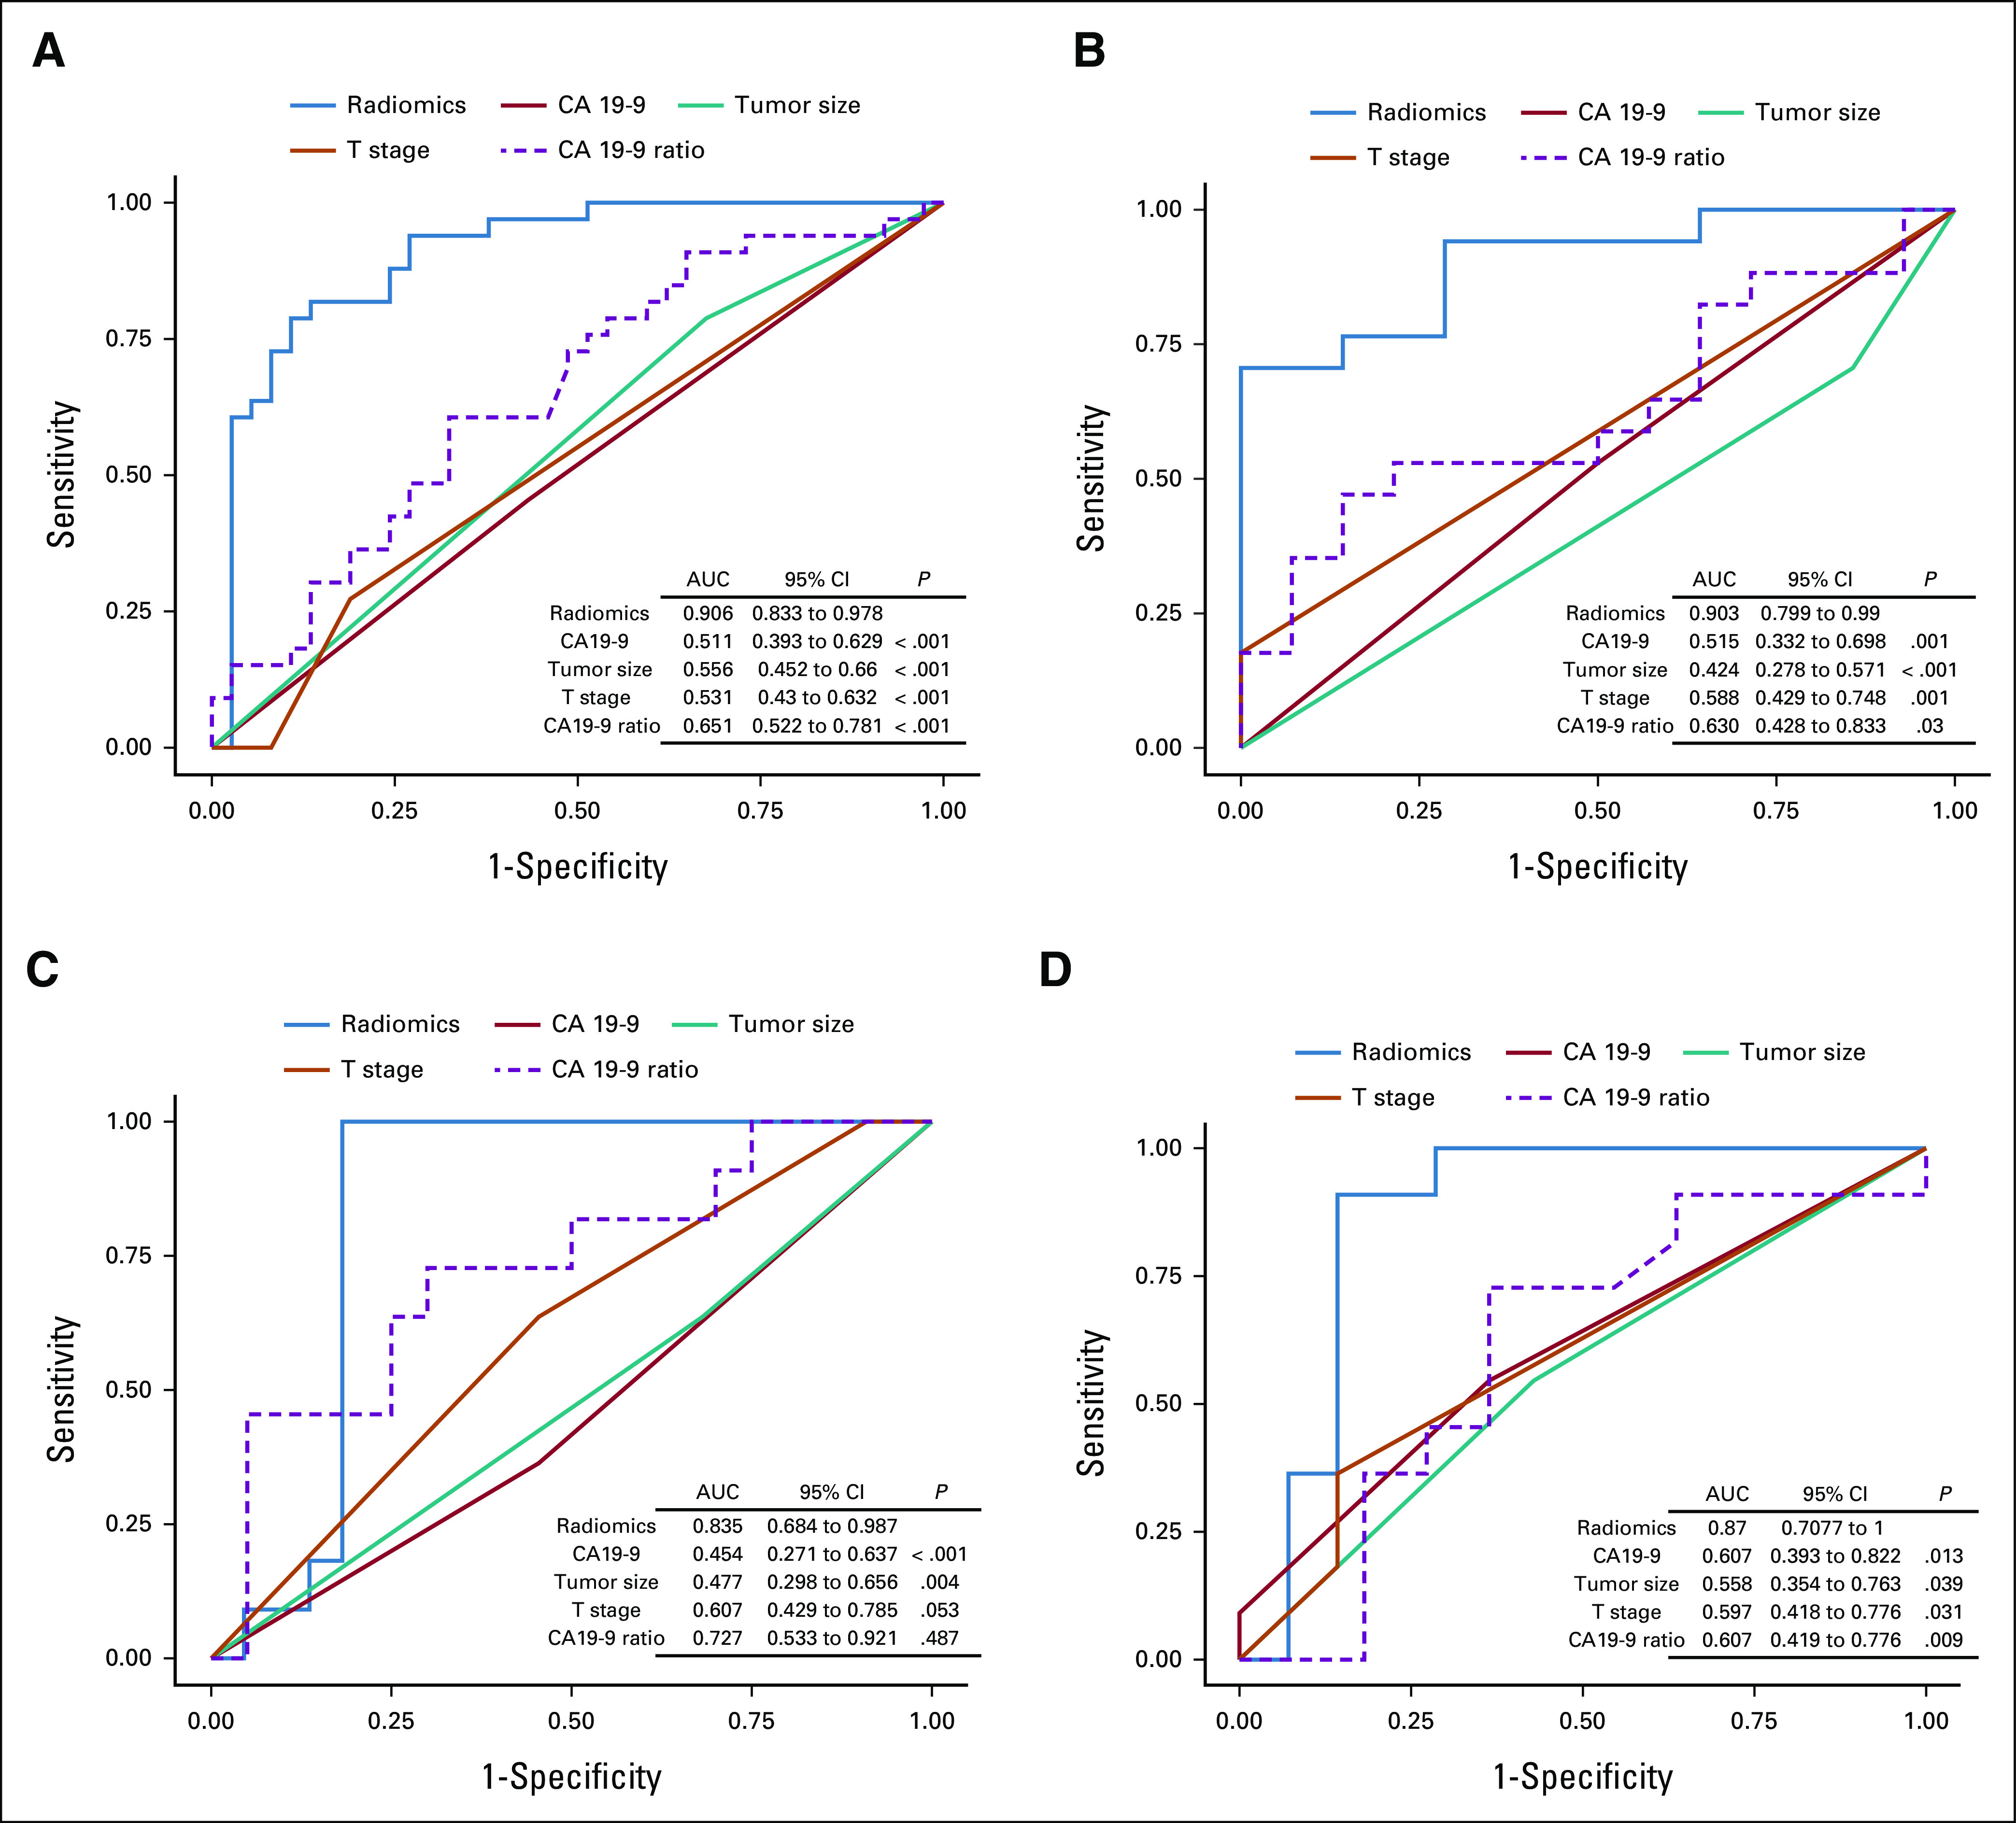
The ROC curves of the radiomics model and clinical features in the (A) training, (B) validation, (C) internal testing, and (D) external testing cohorts. AUC, area under the curve; CA 19-9, cancer antigen 19-9; ROC curves, receiver operating characteristic curves.
Clinical Use of Decision Curve Analysis
The decision curve analysis (DCA) for the radiomics model and that for the models with a single clinical predictor (T stage, CA 19-9 level at baseline, CA19-9 ratio, and tumor size) are presented in Appendix Fig A4. The final DCA showed that the radiomics model provided a better net benefit for predicting a < 1-year OS than the other four models for threshold probabilities of more than 10%, indicating that, within this range, the rad-score outperformed the clinical features with more accuracy in a < 1-year OS prediction.
Comparison of PFS
According to the rad-score cutoff value (0.46), we classified the patients into a low-risk (rad-score > 0.46) and a high-risk group (rad-score ≤ 0.46). The median PFSs were 9.0 (95% CI, 5.5 to 18.5) months versus 7.3 (95% CI, 6.1 to 8.8) months (P = .016; training cohort, Fig 3A), 13.5 (5.9 to 16.7) months versus 6.7 (4.8 to 11.3) months (P = .42; validation cohort, Fig 3B), 9.2 (4.7 to 18.4) months versus 5.9 (4.2 to 7.3) months (P = .026; internal testing cohort, Fig 3C), and 7.3 (5.1 to 13.3) months versus 6.0 (4.7 to 6.7) months (P = .15; external testing cohort, Fig 3D) in the low-risk and high-risk groups, respectively.
FIG 3.

PFS of patients stratified by risk classification according to the rad-score (cutoff value, 0.46) in the four cohorts: (A) training, (B) validation, (C) internal testing, and (D) external testing cohorts. PFS, progression-free survival.
There was no significant difference in the first-line chemotherapy regimens between the high-risk and low-risk groups in the training (P = .81), validation (P = .65), internal testing (P = .14), and external testing cohorts (P = .08; Table 2 and Data Supplement). Other clinical features showed no difference between the two groups (Data Supplement).
TABLE 2.
Comparison of the Tumor Response Between the High-Risk and Low-Risk Groups in the Primary Cohort

Serial Tumor Response After Chemotherapy in the Primary Cohort
As shown in Figures 4 and 5 and Appendix Figure A5, six and one patient(s) in the low-risk and high-risk groups in the training cohort achieved the best response of PR after chemotherapy, respectively; furthermore, four and one patient(s) in the low-risk and high-risk groups in the testing cohort achieved the same, respectively. No patients achieved a PR at > 9 months or a CR in both groups. The ORRs were 24.0% (6 of 25 patients) and 2.2% (1 of 45 patients) in the low-risk and high-risk groups in the training cohort (P = .007) and 26.7% (4 of 15 patients) and 6.3% (1 of 16 patients) in the corresponding groups in the validation cohort, respectively (P = .172; Table 2). For all 12 patients with PR, the median maximal percentage reduction in the size of primary pancreatic lesions was 39.2% (range, 19.5%-47.9%).
FIG 4.

Serial tumor response after chemotherapy according to risk stratification in the training cohort. The objective response rates were 24.0% (6 of 25 pts) and 2.2% (1 of 45 pts) in the low-risk and high-risk groups in the training cohort (P = .007), respectively. For a tumor response beyond 9 months, only the final outcomes were recorded in the diagram. CT, computed tomography; PD, progressive disease; PR, partial response; pts, patients; SD, stable disease.
FIG 5.

The tumor response after chemotherapy in patients in the (A) low-risk and (B) high-risk groups. The detailed legends of each image are described in the Data Supplement.
DISCUSSION
To the best of our knowledge, no previous study has used radiomics analysis to predict the outcomes in patients with advanced PAC with SD on the basis of initial CT after first-line chemotherapy for further risk stratification. In this study, the majority (62.7%) of patients with advanced PAC showed SD on the initial CT after chemotherapy, which agreed with previously reported results.5,6,8 The high-risk group had a shorter PFS in the training and internal testing cohorts and a lower ORR than the low-risk group in the training cohort; consequently, the high-risk group had shorter OS than the low-risk group, with marked differences in the outcomes among patients with SD. The present RS demonstrated favorable predictive efficacy and can help oncologists to devise individualized therapy in patients with SD.
The lack of specific biomarkers for predicting the outcomes of patients with advanced PAC who underwent chemotherapy remains one of the biggest barriers to improve the outcomes of advanced PAC. In these patients with SD, we found that the tumor size, age, sex, and CA19-9 levels at baseline were not related to the OS. In contrast to the above parameters, the RS was strongly and significantly prognostic: the high-risk group had shorter survival outcomes than the low-risk group. Recent studies have shown that higher tumor heterogeneity was positively correlated with a poor response to chemotherapy or chemoradiotherapy in patients with PAC.21,22
In this study, the parameters in the RS were part of the gray-level co-occurrence matrix and gray-level run-length matrix; these are also known as second-order texture features. The superiority of these features can be explained by the fact that they capture the spatial arrangement and distribution of intensities within the target lesions. Moreover, half of the six parameters were present in the venous phase, and the first two parameters with the largest weight coefficient were also in the venous phase. This may be associated with the abundant interstitial fibrosis and delayed enhancement of pancreatic cancer. The heterogeneity of density in the venous phase leads to differences in tumor heterogeneity. This group of features was also the most frequently observed significant radiomics features in PAC in previous studies.23,24,32 The above data could partially explain why the RS could predict the outcome after chemotherapy well. Taken together, the RS could help oncologists to improve treatment decisions by identifying patients who will not benefit from current chemotherapy, but who may benefit from a more aggressive treatment approach or enrollment in a clinical trial.
Furthermore, one of the major merits of the widely used efficacy evaluation method, the RECIST, was independence of the types of chemotherapy regimens. Our analysis showed that the RS was not related to the clinical characteristics and chemotherapy regimens, suggesting that the RS could also be clinically useful for further efficacy evaluation and prediction in patients with advanced PAC and SD after chemotherapy.
Moreover, after continuous efficacy evaluation, we found that the ORR in the high-risk group was markedly lower than that in the low-risk group (2.2% v 24.0% in the training cohort). These findings indicated that the patients in the high-risk group have a significantly lower probability of achieving PR than those in the low-risk group. More specifically, as only a few patients (1 of 45 patients, training cohort) in the high-risk group achieved PR, it may suggest that when patients with SD are classified into the high-risk group at first evaluation, they may need a more aggressive treatment approach rather than continuing the current treatment to improve the outcomes. Moreover, considering the difference in ORR in the low-risk and high-risk groups, it is worth exploring the application of radiomics analysis in the neoadjuvant chemotherapy of PAC in the future.
Our study has some limitations. First, it was a retrospective study. Prospective studies with more patients are necessary to verify and to improve this RS. Second, CT radiomics analysis was manually performed on a single section of the largest cross-section of the tumor although the potential heterogeneity within tumors might influence the results. In the future, automatic delineation of the whole tumor region of interest, supplemented by manual correction, should be used, which would efficiently promote the translation of radiomics biomarkers into daily practice and clinical trials. Furthermore, the prognostic value of a RS on the basis of the baseline CT scans was not evaluated. Future studies are warranted to determine the performance of a baseline CT signature versus the post-treatment signature and the delta RS (using delta radiomics analysis on the basis of the baseline and initial post-therapy CT data) in predicting the outcomes of patients after chemotherapy. It is also worth exploring the prognostic significance of the radiomics analysis in PR and PD subgroups in the future.
In conclusion, in this study, we generated a RS in patients with advanced PAC and SD disease after first-line chemotherapy. The RS demonstrated favorable predictive efficacy to allow further risk stratification, which would assist oncologists in individualized treatment decision making.
ACKNOWLEDGMENT
We would like to thank Editage (www.editage.com) for English language editing.
APPENDIX
FIG A1.

CONSORT diagram of patients' recruitment in the (A) primary cohort, (B) internal testing cohort, and (C) external testing cohort. APC, advanced pancreatic adenocarcinoma; CT, computed tomography; MRI, magnetic resonance imaging; PD, progressive disease; PR, partial response; SD, stable disease.
FIG A2.

Selection of radiomic features using the least absolute shrinkage and selection operator regression model. (A) LASSO feature selection, (B) Logistic regression model.
FIG A3.

The contributing weight bar chart of parameters in the RS. The features with the top-two weights were Inertia_angle45_offset7 (23.7%) and ShortRunHighGreyLevelEmphasis_AllDirection_offset1_SD (19.6%) in the venous phase. The x-axis represents the value of each patient's contributing weight Fij for each parameter, according to the formula described in the Data Supplement. The percentage in the figure is Fi described in the Data Supplement. SD, stable disease.
FIG A4.

The DCA for the radiomics model and clinical features in the four cohorts: (A) training, (B) validation, (C) internal testing, and (D) external testing cohorts. CA 19-9, cancer antigen 19-9; DCA, decision curve analysis.
FIG A5.

Serial tumor response after chemotherapy according to risk stratification in the validation cohort. For a tumor response beyond 9 months, only the final outcomes are recorded in the diagram. CT, computed tomography; PD, progressive disease; PR, partial response; pts, patients; SD, stable disease.
DISCLAIMER
This manuscript has not been published or presented elsewhere in part or in entirety and is not under consideration by another journal.
Q.Y., Y.M., and H.X. contributed equally to this work.
DATA SHARING STATEMENT
The data sets generated during and/or analyzed during the current study are available from the corresponding author on reasonable request.
AUTHOR CONTRIBUTIONS
Conception and design: Qiuxia Yang, Yize Mao, Tao Qin, Hailin Wen, Yong Li, Rong Zhang, Lizhi Liu
Provision of study materials or patients: Yong Li
Collection and assembly of data: Qiuxia Yang, Tao Qin, Zhijun Mai, Qian Cai, Hailin Wen, Yong Li, Rong Zhang
Data analysis and interpretation: Qiuxia Yang, Yize Mao, Hui Xie, Tao Qin, Hailin Wen, Yong Li, Rong Zhang
Manuscript writing: All authors
Final approval of manuscript: All authors
Accountable for all aspects of the work: All authors
AUTHORS' DISCLOSURES OF POTENTIAL CONFLICTS OF INTEREST
The following represents disclosure information provided by authors of this manuscript. All relationships are considered compensated unless otherwise noted. Relationships are self-held unless noted. I = Immediate Family Member, Inst = My Institution. Relationships may not relate to the subject matter of this manuscript. For more information about ASCO's conflict of interest policy, please refer to www.asco.org/rwc or ascopubs.org/po/author-center.
Open Payments is a public database containing information reported by companies about payments made to US-licensed physicians (Open Payments).
No potential conflicts of interest were reported.
REFERENCES
- 1. Grossberg AJ, Chu LC, Deig CR, et al. Multidisciplinary standards of care and recent progress in pancreatic ductal adenocarcinoma. CA Cancer J Clin. 2020;70:375–403. doi: 10.3322/caac.21626. [DOI] [PMC free article] [PubMed] [Google Scholar]
- 2. Conroy T, Desseigne F, Ychou M, et al. FOLFIRINOX versus gemcitabine for metastatic pancreatic cancer. N Engl J Med. 2011;364:1817–1825. doi: 10.1056/NEJMoa1011923. [DOI] [PubMed] [Google Scholar]
- 3. Golan T, Hammel P, Reni M, et al. Maintenance olaparib for germline BRCA-mutated metastatic pancreatic cancer. N Engl J Med. 2019;381:317–327. doi: 10.1056/NEJMoa1903387. [DOI] [PMC free article] [PubMed] [Google Scholar]
- 4. Tempero MA. NCCN guidelines updates: Pancreatic cancer. J Natl Compr Canc Netw. 2019;17:603–605. doi: 10.6004/jnccn.2019.5007. [DOI] [PubMed] [Google Scholar]
- 5. Perri G, Prakash L, Qiao W, et al. Response and survival associated with first-line FOLFIRINOX vs gemcitabine and nab-paclitaxel chemotherapy for localized pancreatic ductal adenocarcinoma. JAMA Surg. 2020;155:832–839. doi: 10.1001/jamasurg.2020.2286. [DOI] [PMC free article] [PubMed] [Google Scholar]
- 6. Cai Q, Mao Y, Yang Q, et al. Are left ventricular muscle area and radiation attenuation associated with overall survival in advanced pancreatic cancer patients treated with chemotherapy? Clin Radiol. 2020;75:238.e1–238.e9. doi: 10.1016/j.crad.2019.11.003. [DOI] [PubMed] [Google Scholar]
- 7. Barreto SG, Loveday B, Windsor JA, et al. Detecting tumour response and predicting resectability after neoadjuvant therapy for borderline resectable and locally advanced pancreatic cancer. ANZ J Surg. 2019;89:481–487. doi: 10.1111/ans.14764. [DOI] [PubMed] [Google Scholar]
- 8. Dhir M, Malhotra GK, Sohal DPS, et al. Neoadjuvant treatment of pancreatic adenocarcinoma: a systematic review and meta-analysis of 5520 patients. World J Surg Oncol. 2017;15:183. doi: 10.1186/s12957-017-1240-2. [DOI] [PMC free article] [PubMed] [Google Scholar]
- 9. Haas M, Waldschmidt DT, Stahl M, et al. Afatinib plus gemcitabine versus gemcitabine alone as first-line treatment of metastatic pancreatic cancer: The randomised, open-label phase II ACCEPT study of the Arbeitsgemeinschaft Internistische Onkologie with an integrated analysis of the ‘burden of therapy’ method. Eur J Cancer. 2021;146:95–106. doi: 10.1016/j.ejca.2020.12.029. [DOI] [PubMed] [Google Scholar]
- 10. Philip PA, Lacy J, Portales F, et al. Nab-paclitaxel plus gemcitabine in patients with locally advanced pancreatic cancer (LAPACT): A multicentre, open-label phase 2 study. Lancet Gastroenterol Hepatol. 2020;5:285–294. doi: 10.1016/S2468-1253(19)30327-9. [DOI] [PubMed] [Google Scholar]
- 11. Fernández A, Salgado M, García A, et al. Prognostic factors for survival with nab-paclitaxel plus gemcitabine in metastatic pancreatic cancer in real-life practice: The ANICE-PaC study. BMC Cancer. 2018;18:1185. doi: 10.1186/s12885-018-5101-3. [DOI] [PMC free article] [PubMed] [Google Scholar]
- 12. Robert M, Jarlier M, Gourgou S, et al. Retrospective analysis of CA19-9 decrease in patients with metastatic pancreatic carcinoma treated with FOLFIRINOX or gemcitabine in a randomized phase III study (ACCORD11/PRODIGE4) Oncology. 2017;93:367–376. doi: 10.1159/000477850. [DOI] [PubMed] [Google Scholar]
- 13. Meijer LL, Garajová I, Caparello C, et al. Plasma miR-181a-5p downregulation predicts response and improved survival after FOLFIRINOX in pancreatic ductal adenocarcinoma. Ann Surg. 2020;271:1137–1147. doi: 10.1097/SLA.0000000000003084. [DOI] [PubMed] [Google Scholar]
- 14. Shi XH, Li X, Zhang H, et al. A five-microRNA signature for survival prognosis in pancreatic adenocarcinoma based on TCGA data. Sci Rep. 2018;8:7638. doi: 10.1038/s41598-018-22493-5. [DOI] [PMC free article] [PubMed] [Google Scholar]
- 15. Strijker M, Soer EC, de Pastena M, et al. Circulating tumor DNA quantity is related to tumor volume and both predict survival in metastatic pancreatic ductal adenocarcinoma. Int J Cancer. 2020;146:1445–1456. doi: 10.1002/ijc.32586. [DOI] [PMC free article] [PubMed] [Google Scholar]
- 16. Creemers A, Krausz S, Strijker M, et al. Clinical value of ctDNA in upper-GI cancers: A systematic review and meta-analysis. Biochim Biophys Acta Rev Cancer. 2017;1868:394–403. doi: 10.1016/j.bbcan.2017.08.002. [DOI] [PubMed] [Google Scholar]
- 17. Zhang Y, Zhu L, Wang X. A network-based approach for identification of subtype-specific master regulators in pancreatic ductal adenocarcinoma. Genes (Basel) 2020;11:155. doi: 10.3390/genes11020155. [DOI] [PMC free article] [PubMed] [Google Scholar]
- 18. Kandimalla R, Tomihara H, Banwait JK, et al. A 15-gene immune, stromal, and proliferation gene signature that significantly associates with poor survival in patients with pancreatic ductal adenocarcinoma. Clin Cancer Res. 2020;26:3641–3648. doi: 10.1158/1078-0432.CCR-19-4044. [DOI] [PMC free article] [PubMed] [Google Scholar]
- 19. Guo JC, Zhang P, Zhou L, et al. Prognostic and predictive value of a five-molecule panel in resected pancreatic ductal adenocarcinoma: A multicentre study. EBioMedicine. 2020;55:102767. doi: 10.1016/j.ebiom.2020.102767. [DOI] [PMC free article] [PubMed] [Google Scholar]
- 20. Xie T, Wang X, Li M, et al. Pancreatic ductal adenocarcinoma: A radiomics nomogram outperforms clinical model and TNM staging for survival estimation after curative resection. Eur Radiol. 2020;30:2513–2524. doi: 10.1007/s00330-019-06600-2. [DOI] [PubMed] [Google Scholar]
- 21. Nasief H, Zheng C, Schott D, et al. A machine learning based delta-radiomics process for early prediction of treatment response of pancreatic cancer. NPJ Precis Oncol. 2019;3:25. doi: 10.1038/s41698-019-0096-z. [DOI] [PMC free article] [PubMed] [Google Scholar]
- 22. Borhani AA, Dewan R, Furlan A, et al. Assessment of response to neoadjuvant therapy using CT texture analysis in patients with resectable and borderline resectable pancreatic ductal adenocarcinoma. AJR Am J Roentgenol. 2020;214:362–369. doi: 10.2214/AJR.19.21152. [DOI] [PMC free article] [PubMed] [Google Scholar]
- 23. Sandrasegaran K, Lin Y, Asare-Sawiri M, et al. CT texture analysis of pancreatic cancer. Eur Radiol. 2019;29:1067–1073. doi: 10.1007/s00330-018-5662-1. [DOI] [PubMed] [Google Scholar]
- 24. Kim BR, Kim JH, Ahn SJ, et al. CT prediction of resectability and prognosis in patients with pancreatic ductal adenocarcinoma after neoadjuvant treatment using image findings and texture analysis. Eur Radiol. 2019;29:362–372. doi: 10.1007/s00330-018-5574-0. [DOI] [PubMed] [Google Scholar]
- 25. Cheng SH, Cheng YJ, Jin ZY, et al. Unresectable pancreatic ductal adenocarcinoma: Role of CT quantitative imaging biomarkers for predicting outcomes of patients treated with chemotherapy. Eur J Radiol. 2019;113:188–197. doi: 10.1016/j.ejrad.2019.02.009. [DOI] [PubMed] [Google Scholar]
- 26. Cassinotto C, Chong J, Zogopoulos G, et al. Resectable pancreatic adenocarcinoma: Role of CT quantitative imaging biomarkers for predicting pathology and patient outcomes. Eur J Radiol. 2017;90:152–158. doi: 10.1016/j.ejrad.2017.02.033. [DOI] [PubMed] [Google Scholar]
- 27. Ng F, Ganeshan B, Kozarski R, et al. Assessment of primary colorectal cancer heterogeneity by using whole-tumor texture analysis: Contrast-enhanced CT texture as a biomarker of 5-year survival. Radiology. 2013;266:177–184. doi: 10.1148/radiol.12120254. [DOI] [PubMed] [Google Scholar]
- 28. Ganeshan B, Goh V, Mandeville HC, et al. Non-small cell lung cancer: Histopathologic correlates for texture parameters at CT. Radiology. 2013;266:326–336. doi: 10.1148/radiol.12112428. [DOI] [PubMed] [Google Scholar]
- 29. Ganeshan B, Skogen K, Pressney I, et al. Tumour heterogeneity in oesophageal cancer assessed by CT texture analysis: Preliminary evidence of an association with tumour metabolism, stage, and survival. Clin Radiol. 2012;67:157–64. doi: 10.1016/j.crad.2011.08.012. [DOI] [PubMed] [Google Scholar]
- 30. Tempero MA, Malafa MP, Al-Hawary M, et al. Pancreatic adenocarcinoma, version 2.2021, NCCN clinical practice guidelines in oncology. J Natl Compr Canc Netw. 2021;19:439–457. doi: 10.6004/jnccn.2021.0017. [DOI] [PubMed] [Google Scholar]
- 31. Eisenhauer EA, Therasse P, Bogaerts J, et al. New response evaluation criteria in solid tumours: Revised RECIST guideline (version 1.1) Eur J Cancer. 2009;45:228–247. doi: 10.1016/j.ejca.2008.10.026. [DOI] [PubMed] [Google Scholar]
- 32. Abunahel BM, Pontre B, Kumar H, et al. Pancreas image mining: A systematic review of radiomics. Eur Radiol. 2021;31:3447–3467. doi: 10.1007/s00330-020-07376-6. [DOI] [PubMed] [Google Scholar]
Associated Data
This section collects any data citations, data availability statements, or supplementary materials included in this article.
Data Availability Statement
The data sets generated during and/or analyzed during the current study are available from the corresponding author on reasonable request.