

Abstract
The measles, mumps, and rubella (MMR) vaccine is a vaccine used to prevent measles, mumps, and rubella (German measles). The vaccine is mandated for children to attend public school in nearly all US states. However, measles cases have been increasing in the past decade, and quality problems have recently been noted by the US Food and Drug Administration (FDA) with the vaccine manufacturer.
Intra-lot and inter-lot variability in the spectra of MMR (measles, mumps, and rubella) vaccine was detected in the Drug Quality Study (DQS) using Fourier transform near-infrared spectrometry (FTNIR). Six vials of 12 (50%) sampled from Merck lot U006488 appeared 14.5 SDs from the other vials on a subcluster detection test, suggesting that they represent different material.
Spectra of 198 vials from 12 lots in the spectral library contained 140 vials in one tight ellipsoidal group, and 58 vials (30%) were outside that group (39.7 SDs using a subcluster detection test), suggesting that the library vials also contain differing materials.
Introduction
The University of Kentucky’s (UK) Drug Quality Study was established in August of 2019 to engage in consumer-level quality assurance testing for drugs used within UK HealthCare’s pharmacies. DQS currently screens medications, using FTNIR and Raman spectroscopy, for potential quality defects indicated by variability in absorbance peak intensities and locations. Through years of continuous monitoring, DQS has assembled a spectral library containing medications typically used in a health system setting. Statistical analyses using DQS’ spectral library can now be performed to identify potential intra-lot and inter-lot variability in medications under review. Using MedWatch, DQS reports its findings in an effort to hold manufacturers accountable for GMP requirements and to improve patient outcomes by exerting positive pressure on the pharmaceutical supply chain. At all levels, DQS staff are committed to achieving service excellence by pursuing compliance with the standards set forth by our patients and broad GxP requirements.
Drug Product
The MMR vaccine is a vaccine used to prevent measles, mumps, and rubella. The first dose is generally given to children around 12 months to 15 months of age, with a second dose at 4 to 6 years of age. The MMR vaccine is required for children in nearly all US states (Deliso, 2021). The MMR vaccine is currently our best defense against measles, mumps, and rubella. The US Centers for Disease Control (CDC) currently cites first-dose efficacies of 93% for measles, 78% for mumps, and 97% for rubella along with second-dose efficacies of 97% for measles and 88% for mumps (CDC Measles, Mumps, and Rubella (MMR) Vaccination, 2022).
The vaccine is furnished as a sterile lyophilized preparation. The only US source is Merck Sharp & Dohme Corp., which manufactures the vaccine at a large facility in Durham, NC under the brand M-M-R®II. Lot U006488 was originally the lot under test. The lots comprising the spectral library were S032826, S037501, S039310, T001213, T001214, T012807, T013725, T022310, T031436, T034389, U006488, and U011149.
Related Reports
Increasing Trend in Measles Outbreaks
Measles is more likely to spread and lead to outbreaks in U.S. communities where groups of people are unvaccinated (CDC Measles Cases and Outbreaks, 2022). But measles outbreaks sometimes occur even in highly vaccinated populations. An outbreak of measles was reported in a high school with a documented vaccination level of 98% (Nkowane, 1987). In this school, 70% of the measles cases were in students who had histories of measles vaccination at 12 months of age or older. For this reason, the cases were classified as vaccine failures. Vaccine failures in vaccinated individuals were the origin of infection in over 47% of the total cases in the outbreak. There was no evidence that waning immunity was a contributing factor in the vaccine failures.
In a 2014 report, a measles outbreak that occurred in 2011 was traced to a fully vaccinated person (Akpan, 2014). This person transmitted the measles to 4 others, two of whom were fully vaccinated.
Over the past decade, measles cases in the US have been increasing (see Figure 1) (CDC Measles Cases and Outbreaks, 2022). The blue line in Figure 1 depicts actual annual case numbers, while the red line shows the 4-year moving average.
Figure 1.

Measles cases have been increasing in the US for the past decade. The blue line depicts actual annual case numbers, while the red line is the moving average.
According to the CDC, in 2019 there were 1,282 individual cases of measles confirmed in 31 states. This is the largest number of cases reported in the U.S. since 1992. Most of these cases were among people who were not vaccinated against measles, but some cases were among people who experienced vaccine failures. It should be noted that the CDC states that the US declared measles eliminated in 2000 (CDC Questions About Measles, 2022). In theory, once measles is eliminated in the US, vaccine quality matters less because ineffective vaccine doses will not be readily noticed.
There is little data on US vaccine quality vs. measles incidence (Cutts, 1994). It could be hypothesized that reducing vaccine quality would result in increasing numbers of vaccine failures, but this remains to be tested.
News Reports and FDA Whistleblower
In 2018, Arie Menachem, a former FDA safety officer, inspected Merck’s Durham facility. A confidential informant told him that a biohazard bin was used in the facility to collect employee uniforms that were soiled with blood, urine and feces because it took too long to go on bathroom breaks (Eanes, 2021). This newspaper report stated:
But after gathering evidence that there were “significant breaches” of good manufacturing practice, the whistleblower said, “the FDA … did absolutely nothing to assure that the Merck facility produces quality products.”
The complaint, which originally was filed in 2018, resurfaced Wednesday after the Office of Special Counsel, a federal investigative agency, wrote a letter to the White House about the concerns. “I am troubled by many aspects of this matter,” Special Counsel Henry Kerner wrote in the letter dated March 31, [2021].
The letter was written after the federal government pledged to spend $105.4 million to reconstruct Merck’s Durham facility in order to produce Johnson & Johnson’s COVID-19 vaccine. The newspaper report continues:
Menachem contends that Merck was hiding evidence of violations. He said he met with the on-site whistleblower, who showed him photos of a trash bin with a sign for workers to dispose of gowns that contained feces, urine or blood. The confidential informant told him that trash bins were put out after their gown supplier complained about receiving garments containing urine, blood and feces over the course of a month, he said.
In Menachem’s inspection report, he marked his concerns as “Official Action Indicated,” a critical warning that would have forced the company to work with the FDA to mitigate the findings. But the findings were downgraded to “Voluntary Action Indicated” by officials that lowered the level of response required (Haviland, 2021).
FDA Inspection Results From April 2021
The Form 483 from the FDA inspection of the Durham facility (conducted 4/7/2021 – 4/16/2021) (FEI number 3006525584) listed the following observations:
There was a failure to handle and store closures at all times in a manner to prevent contamination.
Buildings used in the manufacturing of a drug product are not maintained in a good state of repair.
The quality control unit lacks authority to fully investigate errors that have occurred.
Batch production and control records do not include complete information relating to the production and control of each batch. These records contained no clear explanation for why the batch was aborted.
Routine checking of equipment is not performed according to a written program designed to assure proper performance.
There are no written procedures for production and process controls designed to assure that the drug products have the identity, strength, quality, and purity they purport or are represented to possess.
FDA Medwatch
An FDA Form 3500 Medwatch describing the findings of this Rapid Communication was filed on February 4, 2022. (druginfo @ fda.hhs.gov, personal communication, February 4th, 2022)
Methods
FTNIR (Fourier Transform Near-Infrared) Spectrometry
Using nondestructive analytical techniques, FTNIR spectra were collected for inventory belonging to lot U006488 as part of routine medication quality screening. A representative sample of 12 individual vials were selected for screening from lot U006488 and noted to be stored under the conditions required by the manufacturer in their original packaging. FTNIR spectra were collected noninvasively and nondestructively through the bottom of the vials using a Thermo Scientific Antaris II FTNIR Analyzer (Waltham, MA, USA).
Multiplicative Scatter Correction (MSC)
Multiplicative scatter correction (MSC) is a widely used spectrometric normalization technique. Its purpose is to correct spectra in such a way that they are as close as possible to a reference spectrum, generally the mean of the data set, by changing the scale and the offset of the spectra (Isaksson, 1988).
BEST (Bootstrap Error-Adjusted Single-sample Technique)
The BEST calculates distances in multidimensional, asymmetric, nonparametric central 68% confidence intervals in spectral hyperspace (roughly equivalent to standard deviations)(Dempsey, 1996). The BEST metric can be thought of as a “rubber yardstick” with a nail at the center (the mean). The stretch of the yardstick in one direction is therefore independent of the stretch in the other direction. This independence enables the BEST metric to describe odd shapes in spectral hyperspace (spectral point clusters that are not multivariate normal, such as the calibration spectra of many biological systems). BEST distances can be correlated to sample composition to produce a quantitative calibration, or simply used to identify similar regions in a spectral image. The BEST automatically detects samples and situations unlike any encountered in the original calibration, making it more accurate in chemical investigation than typical regression approaches to near-IR analysis. The BEST produces accurate distances even when the number of calibration samples is less than the number of wavelengths used in calibration, in contrast to other metrics that require matrix factorization. The BEST is much faster to calculate as well (O(n) instead of the O(n3) required by matrix factorization.)
Principal Components (PCs)
Principal component analysis is the process of computing the principal components of a dataset and using them to execute a change of basis (change of coordinate system) on the data, usually employing only the first few principal components and disregarding the rest (Joliffe, 2016). PCA is used in exploratory data analysis and in constructing predictive models. PCA is commonly utilized for dimensionality reduction by projecting each data point onto only the first few principal components to obtain lower-dimensional data while preserving as much of the original variation in the data as possible. The first principal component is the direction that maximizes the variance of the projected data. The second principal component is the direction of the largest variance orthogonal to the first principal component. Decomposition of the variance typically continues orthogonally in this manner until some residual variance criterion is met. Plots of PC scores help reveal underlying structure in data.
Subcluster Detection
In typical near-infrared multivariate statistical analyses, samples with similar spectra produce points that cluster in a certain region of spectral hyperspace. These dusters can vary significantly in shape and size due to variation in sample packings, particle-size distributions, component concentrations, and drift with time. These factors, when combined with discriminant analysis using simple distance metrics, produce a test in which a result that places a particular point inside a particular cluster does not necessarily mean that the point is actually a member of the cluster. Instead, the point may be a member of a new, slightly different cluster that overlaps the first. A new cluster can be created by factors like low-level contamination, moisture uptake, or instrumental drift. An extension added to part of the BEST, called FSOB (Fast Son of BEST) can be used to set nonparametric probability-density contours inside spectral clusters as well as outside (Lodder, 1988), and when multiple points begin to appear in a certain region of cluster-hyperspace the perturbation of these density contours can be detected at an assigned significance level using r values, and visualized using quantile-quantile (QQ) plots. The detection of unusual samples both within and beyond 3 SDs of the center of the training set is possible with this method. Within the ordinary 3 SD limit, however, multiple instances are needed to detect unusual samples with statistical significance.
Results and Discussion
Intralot Analysis
It is not unusual for different lots of a drug to cluster in slightly different regions of near-IR spectral hyperspace. There can be a little drift in the manufacturing process from batch to batch that slightly alters the composition of the drug yet still represents the approved product. This drift is consequently reflected in the spectra.
However, it is unusual for spectra of drugs from the same lot number to vary dramatically. A process that is in control generally produces the same drug over and over again, and as a result, the spectra are very similar.
In the case of lot U006488, 50% of the sampled vials have one spectrum, and the other 50% have another. FTNIR spectra of the 12 vials sampled from lot U006488 are shown in Figures 2 and 3. Figure 2 shows a group of six spectra with one major peak that varies from around 4592 cm−1 to 4610 cm−1. The other group of six spectra seem to share the same underlying major peak, but in addition there are peaks at 4580, 4632, and 4687 cm−1 on top of the major peak. This second group of spectra has a small peak at 4490 cm−1 that is in a valley of the first group of spectra. Figure 3 shows the same behavior in a different region of the NIR spectrum. Again, there are two groups of six spectra each. The groups share two major peaks, but one group adds peaks at 5863, 5973, and 6020 cm−1. The six spectra with peaks at 6020 cm−1 actually appear in a valley in the spectra of the vials in the other group. This group of spectra is actually more variable than the other group, as revealed by its larger volume in the PC plot in Figure 4. These sorts of variations in spectra inside one single lot of a drug are not usually observed.
Figure 2.

Spectra of 12 vaccine doses from the same lot, U006488, vary. In general, drugs in the same lot have similar spectra. However, in this figure two distinct groups of spectra are found, with 6 in each group. One group of spectra has peaks at 4490, 4580, 4832, and 4687 cm−1 that the other group does not have. In the other group, the location of the major peak varies, appearing sometimes at 4592 cm−1 and other times at 4604 cm−1.
Figure 3.

Spectra of 12 vaccine doses from the same lot, U006488, in a different spectral region from Figure 2. Again, 2 distinct groups of spectra are found, with 6 spectra in each group. Peaks at 5863, 5973, and 6020 cm−1 are present in one group of spectra, but absent in the other.
Figure 4.

Principal component (PC) plot of the spectra of the 12 vials sampled from lot U006488. Group membership is indicated by the superimposed ellipses. The group of spectra with the extra peaks in Figures 2 and 3 is the group on the right.
The numbers in Figure 4 and Figure 5 (as well as later figures) reveal the order in which the vials were scanned, so the group membership is unlikely due to instrumental drift.
Figure 5.

PC plot of the spectra of the 12 vials sampled from lot U006488. These are the same groups as Figure 4 but the ellipses are not shown, and the plot shows PC 1 and 3 instead of 1 and 2.
The first 3 PCs of marketed drugs often contain all of the most interesting variations because there is typically not much variability in drug content. However, this was not the case with lot U006488, which had complex spectra with different variations at many levels. The variation described by each PC of the lot is given in Table 1 (the table lists only the top half of the PCs).
Table 1.
Percentage of total spectral variation explained by each PC for lot U006488.
| PC1 | 41.2% | PC4 | 7.7% |
| PC2 | 28.7% | PC5 | 4.1% |
| PC3 | 11.0% | PC6 | 1.8% |
Figure 6 is a 3-D PC plot of PCs 4, 5, and 6 of the spectra of lot U006488. In these PCs only vial 1 appears to be an outlier. PC 4 is the axis on which the spectrum of vial 1 is most strongly displaced, as seen in Figure 7 and Figure 8.
Figure 6.

3-D PC plot of components of lot U006488 lower than Figures 4 and 5. In these PCs only vial 1 seems an outlier.
Figure 7.

PC plot of components of lot U006488 on PCs 4 and 5. Only vial 1 seems an outlier.
Figure 8.

PC plot of components of lot U006488 on PCs 4 and 6. Only vial 1 seems an outlier.
Figure 9 is a plot of the loadings spectrum for PC 1 of lot U006488 (41.2% of the total spectral variation). Spectral features are marked at 4463, 6024, and 8847 cm−1.
Figure 9.

Plot of the loadings spectrum for PC 1 of lot U006488. In NIR spectra PC1 usually reflects some kind of baseline variation, even in scatter-corrected spectra.
Figure 10, Figure 11, and Figure 12 are the loadings spectra of PCs 2, 3, and 4 of lot U006488, respectively.
Figure 10.

Plot of the loadings spectrum for PC 2 of lot U006488.
Figure 11.

Plot of the loadings spectrum for PC 3 of lot U006488.
Figure 12.

Plot of the loadings spectrum for PC 4 of lot U006488.
The subcluster detection test (Lodder, 1988) was run on PCs 1 and 2 of the spectra of lot U006488 and the results appear as Figure 13. The training vials were 1, 2, 4, 6, 9 and 11. The test vials were 3, 5, 7, 8, 10 and 12. (rlim=0.95, rtst=0.88, p=0.02) The clusters are 14.5 SDs apart by the subcluster detection metric. If the clusters were statistically the same in terms of group location and scale, rtst would be greater than rlim and the QQ plot in Figure 13 would be a straight line with a slope of 1 and an intercept of zero.
Figure 13.

QQ plot from the subcluster detection test on PCs 1 and 2 of the spectra of lot U006488. (rlim=0.95, rtst=0.88, p=0.02) The clusters are 14.5 SDs apart by the subcluster detection metric.
Interlot Analysis
Spectra of the 198 library vials were collected between September 2020 and January 2022. The lots comprising the library were S032826, S037501, S039310, T001213, T001214, T012807, T013725, T022310, T031436, T034389, U006488, and U011149. A representative photograph of the vials appears in Figure 14 (these vials were from lot U006488, which was analyzed in the Intra-lot Analysis section above).
Figure 14.

Photograph of MMR vials. Spectra were collected using diffuse reflectance from the lyophilized cake through the bottom of the vials.
Figure 15 is a 3-D PC plot of all 198 vials from 12 lots of the spectral library of MMR vaccine. The blue lines connecting the vials in the order in which they were scanned keep cutting back and forth between the main ellipsoidal cluster and the outliers, indicating that the outliers are scattered through all of the lots. Figure 16 is a 2-D PC plot of the spectral library without the blue line, so the vial numbers are easier to read.
Figure 15.

3-D PC plot of the spectral library of MMR vaccine. A total of 198 vials were scanned from 12 different lots.The tight ellipsoidal group on the right contains 140 of the 198 vials.
Figure 16.

A 2-D PC plot of the spectral library without the blue line connecting the vials in the order in which they were scanned.
Figure 17 and Figure 18 are additional orthogonal views of the 3-D space plotted in Figure 15. In each view there are a few different vials that appear to be outliers.
Figure 17.

PC plot of PCs 1 and 3 of the spectral library. Some of the outliers are different in this view.
Figure 18.

PC plot of PCs 2 and 3 of the spectral library. Some of the outliers are different in this view.
The S/N is usually adequate in pharmaceutical FTNIR to support analysis of PCs higher than 1–3. These PCs each contain progressively less spectral variation (see Table 2).
Table 2.
Percentage of total spectral variation explained by each PC for 198 vials in 12 lots in the spectral library. By the 18th PC, 80.42% of the total spectral variation had been captured.
| PC1 | 27.54% | PC10 | 0.81% |
| PC2 | 25.22% | PC11 | 0.74% |
| PC3 | 6.84% | PC12 | 0.69% |
| PC4 | 5.41% | PC13 | 0.54% |
| PC5 | 3.95% | PC14 | 0.50% |
| PC6 | 2.77% | PC15 | 0.46% |
| PC7 | 1.59% | PC16 | 0.35% |
| PC8 | 1.28% | PC17 | 0.32% |
| PC9 | 1.09% | PC18 | 0.31% |
Figure 19 shows that PCs accounting for smaller proportions of the total variation in the spectra have outliers, too. In the 3-D space defined by PCs 4, 5, and 6, vial 135 is 7.2 SDs from the center of the cluster of library spectra. PCs 4, 5, and 6 together account for 12.13% of the total spectral variation in the library.
Figure 19.

3-D PC plot of PCs 4, 5, and 6 of the spectral library. Some of the outliers are different in this view, with vial 135 being farthest from the cluster (7.2 SDs).
Significant outliers continue to appear in PCs 7, 8, and 9 (see Figure 20). Five vials are measured as outliers in this subset of PCs. Vials 144 (6.1 SDs) and 145 (4.9 SDs) are farthest from the cluster. Vial 134 is 3.7 SDs away, vial 13 is 4.0 SDs away, and vial 154 is 3.4 SDs away from the center of the cluster. PCs 7, 8, and 9 together account for 3.96% of the total spectral variation.
Figure 20.

3-D PC plot of PCs 7, 8, and 9 of the spectral library. Some of the outliers are different in this view, with vials 144 (6.1 SDs) and 145 (4.9 SDs) being farthest from the cluster. Vial 134 is 3.7 SDs away, vial 13 is 4.0 SDs away, and vial 154 is 3.4 SDs away from the center of the cluster.
While PC 10, 11, and 12 only account for 2.24% of the total spectral variation, they still contain information on outliers (see Figure 21). Some of the outliers are different in this view, with vials 154 (5.9 SDs) and 76 (6.0 SDs) being farthest from the cluster. Vial 33 is 3.5 SDs away, vial 135 is 5.3 SDs away, vial 147 is 4.0 SDs away, and vial 151 is 3.0 SDs away.
Figure 21.
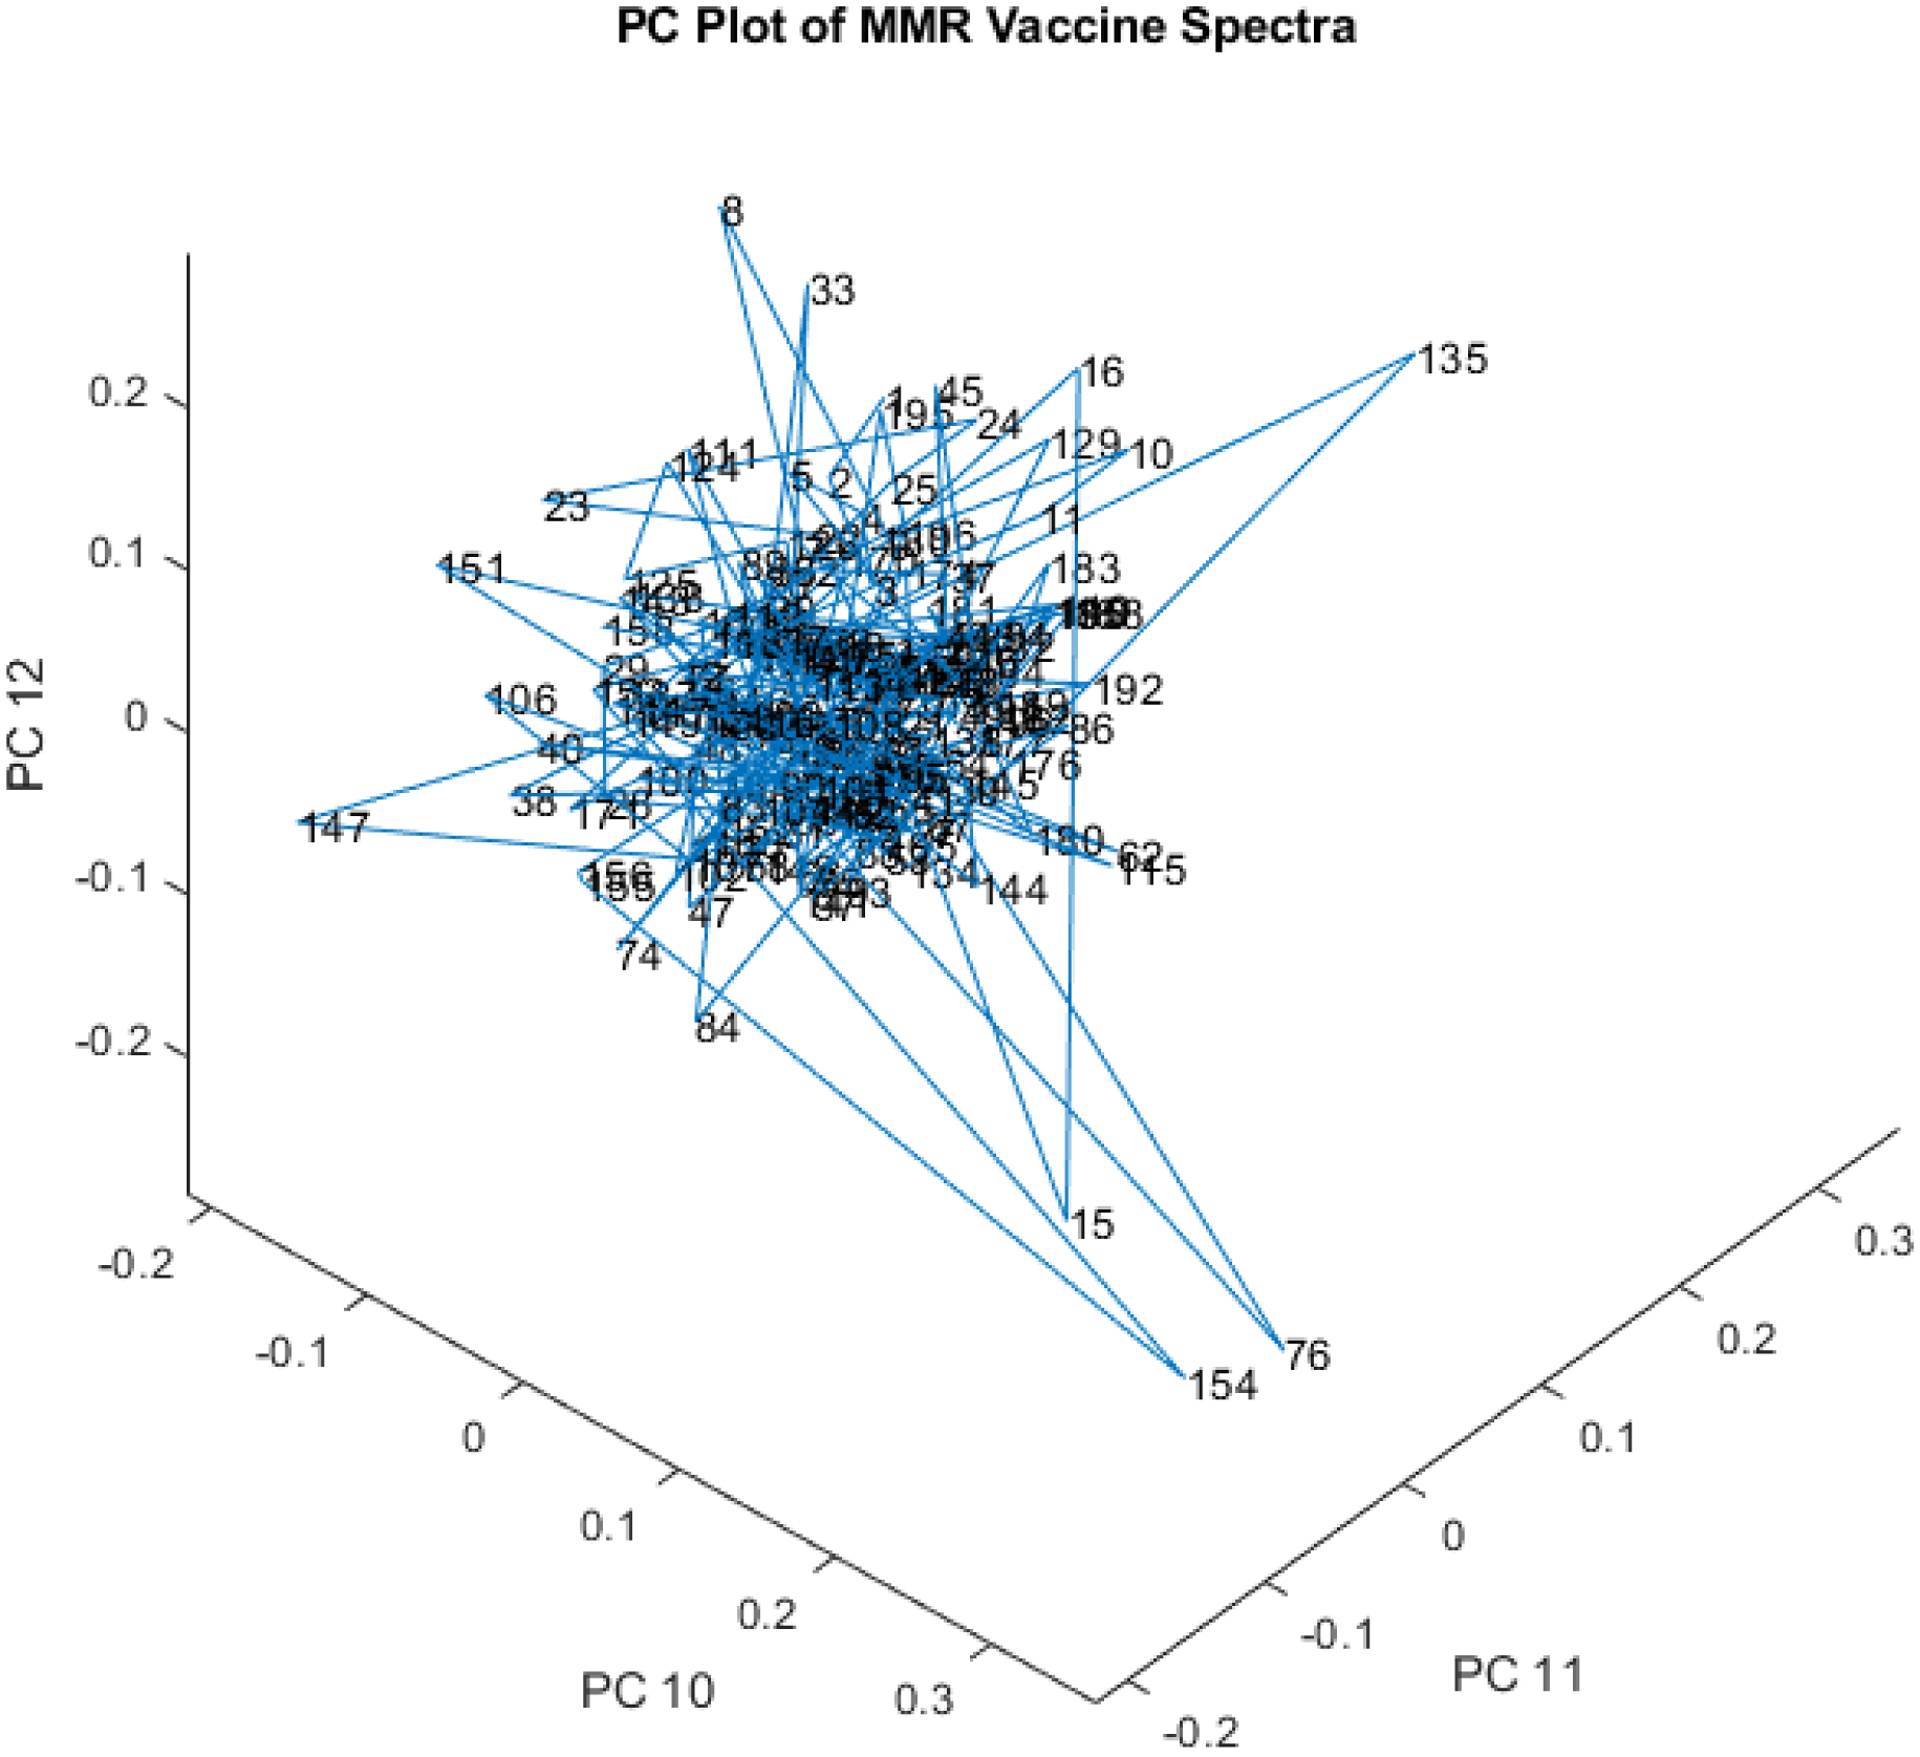
3-D PC plot of PCs 10, 11, and 12 of the spectral library. Some of the outliers are different in this view, with vials 154 (5.9 SDs) and 76 (6.0 SDs) being farthest from the cluster. Vial 33 is 3.5 SDs away, vial 135 is 5.3 SDs away, vial 147 is 4.0 SDs away, and vial 151 is 3.0 SDs away.
In Figure 22 outliers are seen to persist. Vials 15 (7.0 SDs) and 154 (5.5 SDs) are farthest from the cluster center. Vial 145 is 4.3 SDs, vial 147 is 3.7 SDs, vial 144 is 3.4 SDs, and vial 62 is 3.6 SDs away from the center of the cluster. PCs 13, 14, and 15 together account for 1.5% of the total spectral variation in the library.
Figure 22.

3-D PC plot of PCs 13, 14, and 15 of the spectral library. Vials 15 (7.0 SDs) and 154 (5.5 SDs) are farthest from the cluster center. Vial 145 is 4.3 SDs, vial 147 is 3.7 SDs, vial 144 is 3.4 SDs, and vial 62 is 3.6 SDs away from the center of the cluster.
In Figure 23, PCs 16, 17, and 18 account for 0.98% of the total spectral variation. Vials 134 (6.3 SDs) and 171 (6.3 SDs) are the farthest away from the center of the cluster. Other outlier vials include vial 102 at 3.4 SDs, vial 133 at 4.0 SDs, vial 135 at 4.4 SDs, vial 147 at 5.1 SDs, vial 151 at 3.8 SDs, and vial 174 at 4.4 SDs.
Figure 23.

3-D PC plot of PCs 16, 17, and 18 of the spectral library. Vials 134 (6.3 SDs) and 171 (6.3 SDs) are the farthest away from the center of the cluster. Other outlier vials include vial 102 at 3.4 SDs, vial 133 at 4.0 SDs, vial 135 at 4.4 SDs, vial 147 at 5.1 SDs, vial 151 at 3.8 SDs, and vial 174 at 4.4 SDs.
All of the vials are within the 3 SD limit in Figure 24. The variation in the spectral library at this level (PCs 100, 101, and 102) is just noise. Spectra of a drug with a well-controlled composition will also be dominated by noise and contain few outliers.
Figure 24.

3-D PC plot with no outliers. Drugs normally project into hyperspace with shapes like this.
Figure 25 is the QQ plot from the subcluster detection test on PCs 1 and 2 of the spectra of the library of 198 vials. (rlim=0.98, rtst=0.86, p=0.02) If the test set of 58 outliers in Figure 16 were from the same distribution of vials as the 140 in hyperspace, the line in Figure 25 would be straight and have a slope of one and an intercept of zero. The clusters are 39.7 SDs apart by the subcluster detection metric.
Figure 25.

QQ plot from the subcluster detection test on PCs 1 and 2 of the spectra of the library of 198 vials. (rlim=0.98, rtst=0.86, p=0.02) The clusters are 39.7 SDs apart by the subcluster detection metric.
Conclusions
The MMR vaccine is designed to protect against measles, mumps, and rubella and is mandated for children to attend public school in nearly all US states. Nevertheless, measles cases have been increasing in the past decade. In addition, quality problems have been noted by the FDA recently with the vaccine manufacturer (Merck, Durham, NC). Currently Merck is the sole manufacturer of FDA-approved formulations of the Measles, Mumps, and Rubella vaccines, which are presented in two formulations M-M-R®II and ProQuad®. ProQuad®, which also contains a fourth vaccine in its formulation, Varicella, has part of its manufacturing process completed at the same plant. Per CDC only 3% of people who have received two doses of the vaccine will still get measles if exposed to the virus, so it is important to receive both of the vaccinations (CDC Questions About Measles, 2022).
Intra-lot and inter-lot variability in the spectra of MMR (measles, mumps, and rubella) vaccine was detected in the Drug Quality Study (DQS) using Fourier transform near-infrared spectrometry (FTNIR). Six vials of 12 (50%) sampled from Merck lot U006488 appeared 14.5 SDs from the other vials on a subcluster detection test, suggesting that they represent different material.
Spectra of 198 vials from 12 lots in the spectral library contained 140 vials in one tight ellipsoidal group, and 58 vials (30%) were outside that group (39.7 SDs using a subcluster detection test), also suggesting that the library vials contain differing materials.
Quality control is important in drug manufacturing. Good drugs lead to good patient outcomes. Measles is one of the most contagious diseases. As a general rule, outbreaks of disease can occur when patients are not protected by an effective vaccine. Vaccine hesitancy can increase when vaccine quality decreases. These FTNIR results do not prove an excess level of impurities or adulteration. However, they suggest that the manufacturing process may have been operating outside of a state of process control. Additional investigation is needed.
Despite the initial findings in this communication from nondestructive testing, the authors support vaccination recommendations given by the Advisory Committee on Immunization Practices of the Center for Disease Control. Given immunizations are the safest and most cost-effective way of preventing disease, disability, and death, the authors support immunizations as one the greatest public health achievements.
Supplementary Material
Acknowledgements
The project described was supported in part by NSF ACI-1053575 allocation number BIO170011 and the National Center for Research Resources and the National Center for Advancing Translational Sciences, National Institutes of Health, through Grant UL1TR001998. The content is solely the responsibility of the authors and does not necessarily represent the official views of the NIH.
References
- Akpan Nsikan. “Measles Outbreak Traced to Fully Vaccinated Patient for First Time.” Science, Apr 11, 2014, https://www.science.org/content/article/measles-outbreak-traced-fully-vaccinated-patient-first-time, retrieved Feb 13, 2022. [Google Scholar]
- CDC Measles Cases and Outbreaks, https://www.cdc.gov/measles/cases-outbreaks.html, retrieved Feb 13 2022.
- CDC Measles, Mumps, and Rubella (MMR) Vaccination: What Everyone Should Know, https://www.cdc.gov/vaccines/vpd/mmr/public/index.html#:~:text=One%20dose%20of%20MMR%20vaccine%20is%2093%25%20effective%20against%20measles,(weakened)%20live%20virus%20vaccine, retrieved Feb 21 2022.
- CDC Questions About Measles, https://www.cdc.gov/measles/about/faqs.html, retrieved Feb 13 2022
- Cutts Felicity T., Markowitz Lauri E. Successes And Failures In Measles Control, The Journal of Infectious Diseases, Volume 170, Issue Supplement_1, November 1994, Pages S32–S41 [DOI] [PubMed] [Google Scholar]
- Deliso Meredith. These vaccine mandates are already in place to attend school in the US. September 17, 2021, 5:09 AM. Retrieved Feb. 11, 2022. https://abcnews.go.com/US/vaccine-mandates-place-attend-school-us/story?id=80046650. [Google Scholar]
- Dempsey RJ, Davis DG, Buice RG Jr, & Lodder RA (1996). Biological and medical applications of near-infrared spectrometry. Applied Spectroscopy, 50(2), 18A–34A. [Google Scholar]
- Druginfo@fda.hhs.gov (personal communication, February 4th, 2022) Receipt of FDA Form 3500. [Google Scholar]
- Eanes Zachery. Whistleblower raises hygiene concerns from 2018 FDA inspection of Merck’s Durham plant. The News & Observer. April 02 2021. 3:06 PM. https://www.newsobserver.com/news/business/article250349946.html, retrieved Feb 14 2022. [Google Scholar]
- Haviland Jane T., Havana Joanne S. FDA’s Biologics Inspections in the (Negative) Limelight: Will Congress or Executive Leadership Take Action? https://www.mintz.com/insights-center/viewpoints/2146/2021-04-08-fdas-biologics-inspections-negative-limelight-will, retrieved Feb 14 2022. [Google Scholar]
- Isaksson T, & Næs T (1988). The effect of multiplicative scatter correction (MSC) and linearity improvement in NIR spectroscopy. Applied Spectroscopy, 42(7), 1273–1284. [Google Scholar]
- Jolliffe IT, & Cadima J (2016). Principal component analysis: a review and recent developments. Philosophical Transactions of the Royal Society A: Mathematical, Physical and Engineering Sciences, 374(2065), 20150202. [DOI] [PMC free article] [PubMed] [Google Scholar]
- Lodder RA, & Hieftje GM (1988). Detection of subpopulations in near-infrared reflectance analysis. Applied spectroscopy, 42(8), 1500–1512. [Google Scholar]
- Nkowane BM, Bart SW, Orenstein WA, & Baltier M (1987). Measles outbreak in a vaccinated school population: epidemiology, chains of transmission and the role of vaccine failures. American journal of public health, 77(4), 434–438. [DOI] [PMC free article] [PubMed] [Google Scholar]
Associated Data
This section collects any data citations, data availability statements, or supplementary materials included in this article.