Abstract
The objectives of this study were to (i) construct a population pharmacokinetic (PK) model able to describe vancomycin (VAN) concentrations in serum in pediatric patients, (ii) determine VAN PK parameters in this population, and (iii) validate the predictive ability of this model in a naive pediatric population. Data used in this study were obtained from 78 pediatric patients (under 18 years old). PK analyses were performed using compartmental methods. The most appropriate model was chosen based on the evaluation of pertinent graphics and calculation of the Akaike information criterion test. The population PK analysis was performed using an iterative two-stage method. A two-compartment PK model using age, sex, weight, and serum creatinine as covariates was determined to be the most appropriate one to describe serum VAN concentrations. The quality of fit was very good, and the distribution of weighted residuals was found to be homoscedastic (Wilcoxon signed rank test). Fitted population PK parameters (mean ± standard deviation) were as follows: central clearance (0.1 ± 0.05 liter/h/kg), central volume of distribution (0.27 ± 0.07 liter/kg), peripheral volume of distribution (0.16 ± 0.07 liter/kg), and distributional clearance (0.16 ± 0.07 liter/kg). The predictive ability of the developed model (including the above-mentioned covariates) was evaluated in a naive population of 19 pediatric patients. The predictability was very good. Precision (±95% confidence interval [CI]) (peak, 4.1 [±1.4], and trough, 2.2 [±0.7]) and bias (±95% CI) (peak, −0.58 [±2.2], and trough, 0.63 [±1.1] mg/liter) were significantly (P < 0.05) superior to those obtained using a conventional method (precision [±95% CI]: peak, 8.03 [±2.46], and trough, 2.7 [±0.74]; bias: peak, −7.1 [±2.9], and trough, −1.35 [±1.2] mg/liter). We propose the use of this population PK model to optimize VAN clinical therapies in our institution and others with similar patient population characteristics.
There has been a major increase in the clinical use of vancomycin (VAN) in the last 20 years. This may be partly due to the increased and prolonged use of intravenous lines (Hickman catheters, etc.) and to the development of aggressive immunosuppressive therapies. This increase in the utilization of VAN may be responsible for the clinical emergence of enterococcal (3) and staphylococcal (8) strains resistant to this drug (1). It is therefore crucial for clinicians to use this antibiotic in a more rational manner.
Monitoring serum VAN concentrations is still a subject of controversy. Administration of doses to pediatric patients that are based only on body weight have frequently been associated with inappropriate concentrations (10, 14). Some authors have therefore suggested utilizing demographic data (such as age, sex, and height) as well as the patient's estimated renal function in order to attain desired concentrations in serum in the majority of their treated patients (2).
Little is known about the pharmacokinetics (PK) of VAN in children and adolescents. In fact, only one detailed PK study involving 18 patients in that age group has been published (16). We propose to improve the PK knowledge of VAN in pediatric patients. The objectives of this study are (i) to construct a population PK model able to describe serum VAN concentrations, (ii) to determine VAN PK parameters in a pediatric population, and (iii) to validate the predictive ability of this PK model in a naive pediatric population, using Bayesian adaptive control.
MATERIALS AND METHODS
We used, retrospectively, a data bank consisting of 98 patients who received VAN therapy. This bank was compiled by the clinical pharmacists of our center, between January 1994 and July 1996. Patients with at least one available serum creatinine value and one set of peak and trough VAN serum concentrations were included in the study (78 out of 98 patients). Age, weight, sex, and serum creatinine data were available for each subject and are summarized in Table 1. Data collected concerning VAN therapy included the dose given during the 1-h infusion, the therapeutic interval, and the results of the measured peaks and troughs. During the creation of each patient's PK data files, the troughs were assumed to be drawn 15 min before the fourth infusion of VAN and the peak concentrations occurred 1 h after. These are the standard times at which these levels are drawn at Hôpital St-Justine, Montréal, Canada. Every patient had at least one set of a measured peak and trough available. In total, the data bank included 256 VAN serum concentrations.
TABLE 1.
Demographic data and laboratory values
| Characteristic | Primary population | Naive population |
|---|---|---|
| No. of patients (no. of serum concns) | 78 (256) | 19 (84) |
| No. male/no. female | 40/38 | 11/8 |
| Median age in yr (range) | 7 (0.01–18) | 8.5 (0.3–18) |
| Median wt in kg (range) | 25 (0.93–74) | 32 (5.5–84.9) |
| Serum creatinine level ± SD (μmol/ml) | 47.8 ± 24.4 | 37.8 ± 15.7 |
| Creatinine clearance ± SD (ml/min adjusted for 1.73 m2)a | 138.6 ± 49.3 | 160.7 ± 28.4 |
Calculated using Schwartz's formula (13).
Analytical assay.
VAN serum concentrations were determined using a validated fluorescence polarization immunoassay (TDx; Abbott Diagnostics, Chicago, Ill.). Interday and intraday coefficients of variation of the analytical method were less than 5%, and the limit of detection was 2 mg/liter.
Statistics.
Statistical analyses were performed using SYSTAT Version 8 for Windows (SPSS Inc., 1998) and Lotus 1-2-3 Release 9 for windows (Lotus Development Corporation, 1998) when appropriate. Statistical significance was set a priori at P < 0.05.
PK analyses.
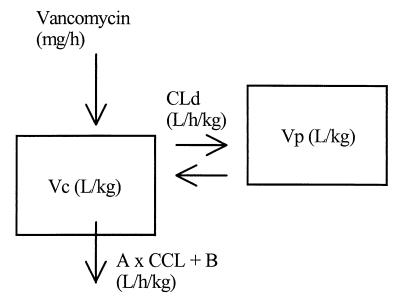
PK analyses were performed using compartmental methods (7). Several models were investigated during the model discrimination process, and the most appropriate one was chosen based on the law of parsimony (simplest model), the value of the Akaike information criterion test, and upon inspection of important graphics (weighted residuals versus observed concentrations and fitted and observed VAN concentrations versus time). A classical linear two-compartment model using body weight and creatinine clearance as covariates was chosen for this population analysis. The graphic representation of the model is presented in Fig. 1. The differential equations describing this model are
 |
 |
where R(1) represents the infusion rate of VAN (milligrams per hour) and Vc and Vp are the volumes of distribution of the central and the peripheral compartments, respectively (liters), while CLc and CLd are the central and distributional clearances, respectively (liters per hour). Creatinine clearance was used as a covariate of central clearance in the following equation:
 |
where A and B are the slope and intercept of the relationship between creatinine clearance (CCL) and CLc, respectively. CCL was calculated for each patient using an equation converting creatinine clearance values obtained from the Schwartz formula (CLCreatSW in liters per hour adjusted to 1.73 m2) (13) to a value in liters per hour:
 |
where BSA represents the value of the body surface area for each patient calculated with the following equation (4):
 |
The actual body weight (BW) is expressed in kilograms. The volumes of distribution of VAN (Vc and Vp) were modeled using body weight (BW) as a surrogate marker.
FIG. 1.
Final population PK model. Vc, volume of the central compartment; Vp, volume of the peripheral compartment; A, slope of the relationship between VAN central clearance and creatinine clearance (CCL); B, intercept of the relationship between VAN central clearance and creatinine clearance; Cld, distributional clearance.
Population analysis.
Initial values for PK parameters were obtained using maximum likelihood analysis with ADAPT-II (D. Z. D'Argenio and A. Schumitzky, 1997, ADAPT-II user's guide). These were used as prior values for the population PK analysis which was performed using an iterative two-stage method (D. Collins and A. Forest, 1995, IT2S user's guide). Parameters were fitted to 30 kg (i.e., liters per 30 kg and liters per hour per 30 kg), which was the average population body weight. Observed VAN concentrations were fitted using a weighting factor of Wi = 1/Si2 where the variance Si2 was calculated for each observation using the following equation:
 |
In this equation, a, Y(1), and b are the residual variability, the observed VAN concentrations, and standard deviation related to the limit of detection of the analytical assay, respectively. These parameters were first estimated using maximum likelihood (ADAPT-II) and were updated iteratively during the population analysis until they were estimated with robustness (VARUP, iterative two-stage method).
Validation of the PK model.
The final population PK model was validated using a naive pediatric population from our institution. Patients in this population were not part of the first data bank and were chosen prospectively in a random manner among patients receiving VAN therapies. In order to be included in this population, a minimum of four serum VAN concentrations (two peaks and two troughs) was needed per patient in addition to a serum creatinine value. Nineteen patients were included in this new population.
The predictive ability of the population PK model was evaluated in terms of bias and precision using the method proposed by Sheiner and Beal (15). The predictive value of the model was first evaluated when it was used only as a nomogram, before any VAN serum concentrations were available. The PK model was then reevaluated using collected serum VAN concentrations (first set of peak and trough) and fitting them with the maximum a posteriori probability algorithm of ADAPT-II using the population mean PK parameters and the full covariance matrix. Bias and precision of the PK model were then compared, with or without this a priori information, with results obtained using our hospital conventional nomogram. This latter method consisted in giving standard doses of VAN (10 mg/kg of body weight per dose at a 6-h interval) (16), in order to reach targeted peaks and troughs of 25 and 7.5 mg/liter, respectively.
RESULTS
During the PK model discrimination process, body weights and patient creatinine clearances were found to be important covariates explaining the observed concentrations of VAN in serum. Their inclusion in the model reduced significantly the interindividual variability of the PK parameters and the residual variability observed in VAN serum concentrations. This latter, which includes the intraindividual variability and all experimental errors, decreased from an initial value of 25% to 6.5%. A value of 25% would not have permitted accurate prediction of VAN serum concentrations in a naive population, because each concentration would then have been associated with a normal error or variability of 25%. Average VAN population PK parameters in the pediatric population of 78 patients are presented in Table 2, along with their associated interindividual variability. Average mean calculated PK parameters and their associated interindividual variability are presented in Table 3.
TABLE 2.
Average population PK parameters of VAN and their associated interindividual variabilitya
| Type of value | Vc
|
Vp
|
A |
B
|
Cld
|
||||
|---|---|---|---|---|---|---|---|---|---|
| Liters/30 kg | Liters/kg | Liters/30 kg | Liters/kg | ml/min/30 kg | ml/min/kg | Liters/h/30 kg | Liters/h/kg | ||
| Mean | 8.3 | 0.27 | 4.8 | 0.16 | 0.46 | 9 | 0.3 | 4.9 | 0.16 |
| Range | 0.9–18.5 | 0.03–0.62 | 0.3–10.1 | 0.01–0.37 | 0.06–1.08 | 0.3–10.1 | 0.01–0.34 | ||
| CV (%) | 42 | 43 | 45 | ND | 43 | ||||
Residual variability in VAN serum concentrations (includes the intraindividual variability and all experimental errors) was 6.5%. Values shown per kilogram rather than per 30 kg are adjusted per kilogram of body weight. Vc, volume of the central compartment; Vp, volume of the peripheral compartment; A (no unit), slope of the relationship between VAN central clearance and creatinine clearance; B, intercept of the relationship between VAN central clearance and creatinine clearance; Cld, VAN distributional clearance; CV, coefficient of variation; ND, not determined.
TABLE 3.
Average calculated population PK parameters of VAN and their associated interindividual variabilitya
| Type of value | Vss | CL | t1/2 |
|---|---|---|---|
| Mean | 0.43 liter/kg | 0.103 liter/h/kg | 3.9 h |
| CV | 43% | 45% | 57% |
Vss, total volume of distribution; CL, total plasma clearance; t1/2, terminal elimination half-life; CV, coefficient of variation.
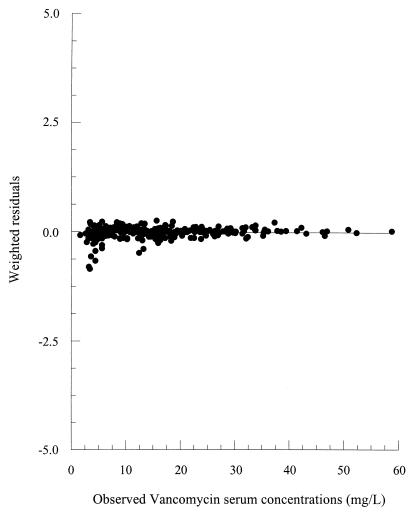
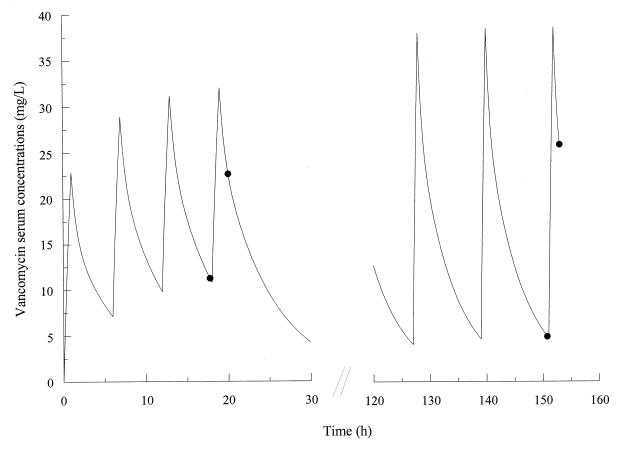
Observed VAN serum concentrations were explained very well by the proposed population PK model. The absence of systematic bias in the model was verified using the Wilcoxon signed rank test. Weighted residuals versus observed VAN serum concentrations are presented in Fig. 2. A homoscedastic distribution of the weighted residuals is evident, confirming the absence of bias. Observed and fitted VAN concentrations for a representative patient are presented in Fig. 3.
FIG. 2.
Weighted residuals versus observed serum concentrations of VAN.
FIG. 3.
Fitted (line) and observed (solid circle) VAN serum concentrations in a representative patient.
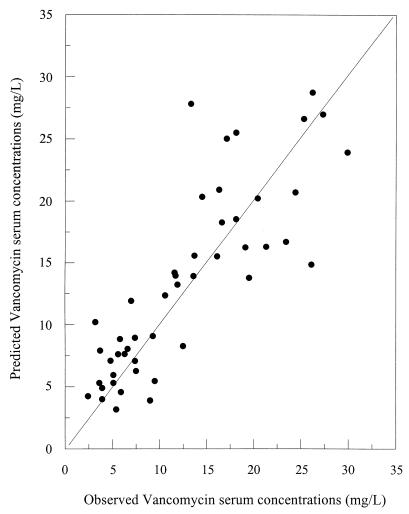
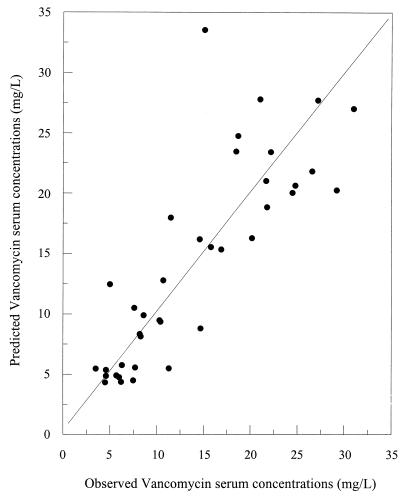
Bias and precision estimates for the population PK model with or without using VAN concentrations are presented in Table 4. These results are compared with those obtained using the conventional nomogram of our institution. Relationships between the observed and predicted VAN concentrations for the naive population are presented in Fig. 4 and 5. The quality of the prediction using the model without Bayesian adaptive control is depicted in Fig. 4, while results derived using prior concentrations with Bayesian adaptive control are presented in Fig. 5.
TABLE 4.
Precision and bias (±95% confidence interval) of the population PK model compared with those obtained using the nomogram previously used in our institutiona
| Method | Bias (mg/liter)
|
Precision (mg/liter)
|
||
|---|---|---|---|---|
| Peak | Trough | Peak | Trough | |
| Previously used nomogram | −11.4 (±2.38) | −3.56 (±0.99) | 11.15 (±2.38) | 4.07 (±0.82) |
| Population PK model (no prior VAN serum concns were used) | −0.058 (±2.15) | −0.63 (±1.11) | 4.1 (±1.41) | 2.19 (±0.72) |
| Population PK model (VAN serum concns were used as prior information) | −0.66 (±2.67) | 0.45 (±1.29) | 4.41 (±1.82) | 2.01 (±0.94) |
The absence of bias in the model was demonstrated using the Wilcoxon signed rank test.
FIG. 4.
Relationship between observed and model-predicted VAN serum concentrations using demographic data only.
FIG. 5.
Relationship between observed and model-predicted VAN serum concentrations using demographic data and the results of a previous peak and trough.
DISCUSSION
A two-compartment PK model was found to be the most appropriate one to describe serum VAN concentrations during the model discrimination process. Likewise, others have found that the PK of VAN is better described by a two- instead of a one-compartment PK model (6, 9, 11). Body weights and creatinine clearances used as covariates in the model allowed significant reduction of the interindividual and residual variability. The latter includes the patient's intraindividual variability and the total experimental errors that may be generated clinically (i.e., dosage, timing of samples, and analytical variability). The population PK model that we are proposing is associated with an interestingly low residual variability of 6.5% for serum VAN concentrations.
There is little information available regarding VAN PK parameters in children and adolescents. We found only one detailed study reported in the literature, and its results were derived from 18 children. This prior study reported an apparent volume of distribution for VAN ranging between 0.538 and 0.818 liter/kg, while VAN central clearance varied between 7.86 and 9.78 liters/h (12). These values are in agreement with our results, where the average population values for the volume of distribution and total clearance of VAN are 0.43 and 0.103 liter/h/kg, respectively. Our results were, however, determined using a more robust population PK method, and our proposed model was validated in a naive population of 19 patients.
The very good predictive ability of our proposed VAN population PK model makes it an interesting tool to use clinically to optimize VAN therapies. Bias and precision were significantly superior (P < 0.05) to those of the previously used method of our institution. The average precision for peak concentrations decreased from 11.2 to 4.1 mg/liter. Based on an average peak of 30 mg/liter, this translates into an average error of 40% compared to just 14% when the population PK model is used. Standard dosages of VAN for pediatric patients have already been shown to systematically underdose patients (14). This may have serious consequences since the time until eradication of infection and the duration of hospitalization may both be prolonged, two situations associated with emergence of drug resistance (5). Predicting VAN serum concentrations with more accuracy may enable clinicians to optimize treatment of their infected patients while minimizing the number of samples to be drawn. This would need to be verified in another study. The importance of keeping blood drawings to a minimum in pediatric patients cannot be overemphasized, since they affect the patient's quality of life and the overall cost of therapy. One interesting finding of this study is that the predictive value of the population PK model was not significantly different with the addition of previously observed VAN serum concentrations. This may indicate that the proposed PK model is well adapted to our pediatric population, but other factors may explain this phenomenon.
In conclusion, we have developed a population PK model for VAN in pediatric patients. PK parameters have been described, and the population PK model was validated in a naive population. The predictive ability of this model was significantly (P < 0.05) superior to that of the conventional method previously used in our institution. We propose the use of this population PK model to optimize VAN clinical therapies in our institution and others with similar patient population characteristics.
ACKNOWLEDGMENTS
We are grateful to the clinical pharmacists of l'Hôpital Ste-Justine de Montréal for their help in collecting the main elements of the first patient population data bank.
REFERENCES
- 1.Boyle J F, Soumakis S A, Rendo A L. Epidemiologic analyses and genotypic characterization of a nosocomial outbreak of vancomycin-resistant enterococci. J Clin Microbiol. 1993;31:1280–1285. doi: 10.1128/jcm.31.5.1280-1285.1993. [DOI] [PMC free article] [PubMed] [Google Scholar]
- 2.Cantu T, Yamanaka-Yuen N, Lietman P S. Serum vancomycin concentrations: reappraisal of their clinical value. Clin Infect Dis. 1994;8:533–543. [PubMed] [Google Scholar]
- 3.Centers for Disease Control and Prevention. Nosocomial enterococci resistant to vancomycin—United States, 1989–1993. Morbid Mortal Weekly Rep. 1993;42:597–599. [PubMed] [Google Scholar]
- 4.Costeff H. A simple empirical formula for calculating approximate surface area in children. Arch Dis Child. 1966;41:681–683. doi: 10.1136/adc.41.220.681. [DOI] [PMC free article] [PubMed] [Google Scholar]
- 5.Cunha B A, Ortega A M. Antibiotic failure. Med Clin N Am. 1995;79:663–671. doi: 10.1016/s0025-7125(16)30062-1. [DOI] [PubMed] [Google Scholar]
- 6.D'Argenio D Z, Peck C C, Rodman J H. Analysis of pharmacokinetic data for individualizing drug dosage regimens. In: Evans W E, Schentag J J, Jusko W J, editors. Applied pharmacokinetics. 3rd ed. Vancouver, Wash: Applied Therapeutics; 1992. pp. 3-1–3-31. [Google Scholar]
- 7.Gibaldi M, Perrier D. Pharmacokinetics. 2nd ed. New York, N.Y: Marcel Dekker, Inc.; 1982. [Google Scholar]
- 8.Hiramatsu K, Hanaki H, Ino T. Methicillin-resistant Staphylococcus aureus clinical strain with reduced vancomycin susceptibility. J Antimicrob Chemother. 1997;40:135–136. doi: 10.1093/jac/40.1.135. [DOI] [PubMed] [Google Scholar]
- 9.Lisby-Sutch S M, Nahata M C. Dosage guidelines for the use of vancomycin based on its pharmacokinetics in infants. Eur J Clin Pharmacol. 1988;35:637–642. doi: 10.1007/BF00637600. [DOI] [PubMed] [Google Scholar]
- 10.Miles M V, Li L, Lakkis H, Youngblood J. Special considerations for monitoring vancomycin concentrations in pediatric patients. Ther Drug Monit. 1997;19:265–270. doi: 10.1097/00007691-199706000-00004. [DOI] [PubMed] [Google Scholar]
- 11.Rodvold K A, Everett J A, Pryka R D. Pharmacokinetics and administration regimens of vancomycin in neonates, infants and children. Clin Pharmacokinet. 1997;33:32–51. doi: 10.2165/00003088-199733010-00004. [DOI] [PubMed] [Google Scholar]
- 12.Schaad U B, McCracken G H, Nelson J D. Clinical pharmacology and efficacy of vancomycin in pediatric patients. J Pediatr. 1980;96:119–126. doi: 10.1016/s0022-3476(80)80347-7. [DOI] [PubMed] [Google Scholar]
- 13.Schwartz G J, Haycock G B, Edelmann C M, Jr, Spitzer A. A simple estimate of glomerular filtration rate in children derived from body length and plasma creatinine. Pediatrics. 1976;58:259–263. [PubMed] [Google Scholar]
- 14.Seay R E, Brundage R C, Jensen P D. Population pharmacokinetic of vancomycin in neonates. Clin Pharmacol Ther. 1994;56:169–175. doi: 10.1038/clpt.1994.120. [DOI] [PubMed] [Google Scholar]
- 15.Sheiner L B, Beal S L. Some suggestions for measuring predictive performance. J Pharmacokinet Biopharm. 1981;4:503–512. doi: 10.1007/BF01060893. [DOI] [PubMed] [Google Scholar]
- 16.Taketomo C K, Hodding J H, Kraus D M. Pediatric dosage handbook. Hudson, Ohio: Lexi-Comp, Inc.; 1996. pp. 74–75. [Google Scholar]


