

Summary
Autoantibodies that recognize extracellular proteins (the exoproteome) exert potent biological effects but are challenging to detect. Here, we developed rapid extracellular antigen profiling (REAP), a high-throughput technique for the comprehensive discovery of exoproteome-targeting autoantibodies. Patient samples are applied to a genetically barcoded yeast surface display library containing 2,688 human extracellular proteins. Antibody-coated yeast are isolated, and sequencing of barcodes is used to identify displayed antigens. To benchmark REAP’s performance, we screened 77 patients with autoimmune polyglandular syndrome type 1 (APS-1). REAP sensitively and specifically detected both known and previously unidentified autoantibodies in APS-1. We further screened 106 patients with systemic lupus erythematosus (SLE) and identified numerous autoantibodies, several of which were associated with disease severity or specific clinical manifestations and exerted functional effects on cell signaling ex vivo. These findings demonstrate the utility of REAP to atlas the expansive landscape of exoproteome-targeting autoantibodies and their impacts on patient health outcomes.
Keywords: autoantibody, high-throughput, systems immunology, conformational epitope, yeast display, APS-1, systemic lupus erythematosus, APECED, autoimmunity, autoantibody screening
Graphical abstract
Highlights
-
•
REAP enables the discovery of autoantibodies that recognize extracellular antigens
-
•
Compared with existing methods, REAP more accurately detects these autoantibodies
-
•
REAP uncovers functional autoantibodies in autoimmune disease patients
-
•
REAP can atlas the diverse landscape of functional autoantibody responses
Motivation
Current high-throughput autoantibody discovery techniques largely lack sensitivity in detecting autoantibodies that target extracellular proteins. This is due to both the biochemical challenges of working with extracellular proteins, which often have unique folding requirements (signal peptide removal, disulfide bond formation, and post-translational modifications such as glycosylation), and the fact that most of these autoantibodies recognize “conformational” protein epitopes (three-dimensional epitopes present only when a protein is folded into its native state). Here, we describe the development and application of rapid extracellular antigen profiling (REAP), a yeast surface display-based high-throughput technique that enables the comprehensive discovery of autoantibodies that target extracellular proteins.
Autoantibodies targeting the extracellular proteome can exert potent biological effects but are challenging to detect. Wang et al. develop a high-throughput technique called REAP that sensitively detects these autoantibodies and use it to identify autoantibodies in APS-1 and systemic lupus erythematosus, demonstrating REAP’s ability to atlas the diverse landscape of exoproteome-targeting autoantibodies in health and disease.
Introduction
Autoantibodies play a major etiological role across a wide range of diseases spanning autoimmunity, cancer, metabolic dysfunction, cardiovascular disease, infectious diseases, and even neurological and neurodegenerative conditions (Britschgi et al., 2009; De Virgilio et al., 2016; Ercolini and Miller, 2009; Kazarian and Laird-Offringa, 2011; Leslie et al., 2016; Ludwig et al., 2017; Meier and Binstadt, 2018; Menconi et al., 2014). Though autoantibodies are commonly associated with adverse effects, they can also exhibit disease-ameliorating functions that are beneficial to patients. For example, immunosuppressive anti-cytokine autoantibodies are associated with less severe disease in numerous autoimmune conditions (Cappellano et al., 2012; Watanabe et al., 2010); similarly, anti-tumor specific and opsonizing antibodies are associated with better survival in cancer patients (Gillissen et al., 2017; von Mensdorff-Pouilly et al., 2000; Tabuchi et al., 2016). Thus, analogous to genetic mutations, autoantibodies may explain a significant fraction of the clinical and phenotypic variation seen between individuals. Discovery of functional autoantibody responses in patients therefore has the potential to uncover key etiologic factors and therapeutic targets similar to the study of human genetics.
Within the human proteome, a particularly important group of autoantibody targets are extracellular and secreted proteins (collectively, the “exoproteome”). Because antibodies are themselves large (150 kDa) secreted proteins, they are most likely to recognize and act upon targets that reside within the same extracellular compartment (Naparstek and Plotz, 1993). While state-of-the-art technologies, such as protein/peptide microarrays, proteome-scanning libraries using phage (phage immunoprecipitation sequencing [PhIP-seq]), and bacterial display, have enabled the discovery of autoantibodies in a variety of diseases (Benjamin Larman et al., 2013; Chen et al., 2020; Fishman et al., 2017; Kamath et al., 2020; Landegren et al., 2016; Larman et al., 2011, 2013; Meyer et al., 2016; Vazquez et al., 2020), these systems have limited sensitivity to detect autoantibodies against extracellular targets. This is due in part to the inherent difficulty of working with extracellular proteins, which often have unique folding requirements that include signal peptide removal, disulfide bond formation, and post-translational modifications, such as glycosylation. Many of these features are not captured by platforms that express proteins or peptides in prokaryotic systems. Similarly, technologies that rely on the use of peptide fragments are not able to detect autoantibodies that recognize “conformational” protein epitopes (i.e., three-dimensional epitopes present when a protein is folded into its native state). This limitation may significantly hamper autoantibody detection, because as many as 90% of antibodies recognize conformational epitopes as opposed to linear peptides (Laver et al., 1990).
Here, we describe rapid extracellular antigen profiling (REAP), a method to discover functional antibodies against the exoproteome. REAP leverages yeast-display technology to assess the presence of autoantibody responses to 2,688 extracellular proteins present in patient serum or plasma samples through a next-generation sequencing-based approach. We use REAP to screen a cohort of 77 autoimmune polyglandular syndrome type 1 (APS-1) patients and successfully identify well-established known autoantibodies along with other public (present in many patients) and private (present in only a few patients) reactivities. We further apply REAP to a cohort of 106 patients with systemic lupus erythematosus (SLE) and identify autoantibodies targeting cytokines, cytokine receptors, growth factors, extracellular matrix components, and immunomodulatory cell surface proteins, and validate several of these reactivities through orthogonal assays. In both SLE and APS-1, we identify autoantibody responses that are associated with disease severity and specific clinical disease manifestations. Finally, we find that autoantibodies in SLE patients that target the co-inhibitory ligand programmed death ligand 2 (PD-L2) and the cytokine interleukin (IL)-33 have functional antagonist activity ex vivo. These results indicate that REAP is broadly useful for the discovery of autoantibodies targeting the exoproteome and that functional autoantibodies within patient populations may provide key insights into disease pathogenesis and therapeutic approaches.
Results
Development of rapid exoproteome antigen profiling
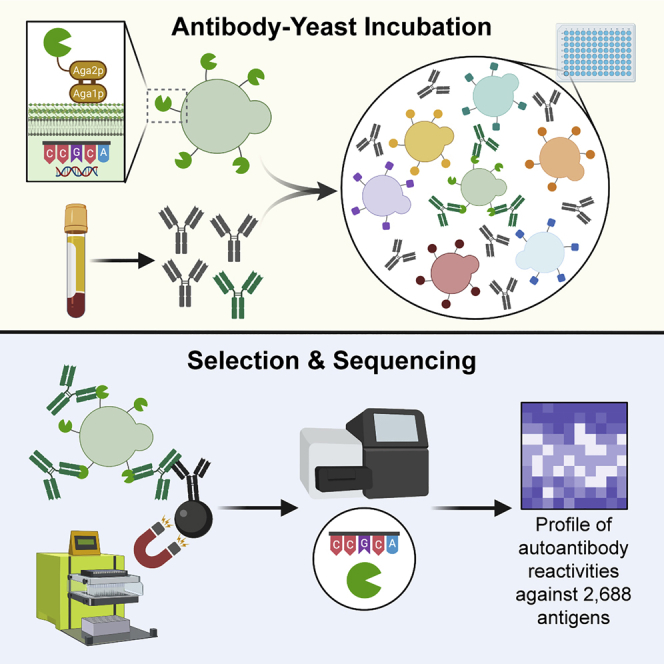
To develop a system capable of detecting autoantibody responses against conformational extracellular proteins, we elected to use yeast surface display to comprehensively sample the human exoproteome (Figure 1A). As eukaryotic cells, yeast contain several features that enable them to express extracellular proteins, including endoplasmic reticulum (ER) chaperones, glycosylation machinery, and disulfide bond proofreading systems (Gai and Wittrup, 2007). Accordingly, a diverse range of mammalian extracellular protein families has been successfully expressed with yeast display, including proteins with folds, such as the immunoglobulin superfamily (IgSF), tumor necrosis factor (TNF) superfamily (TNFSF), TNF receptor superfamily (TNFRSF), von Willebrand factor A (vWFA) domains, fibronectin domain, leucine-rich repeat (LRR), epidermal growth factor (EGF)-like, insulin-like, cytokines, growth factors, and even complicated assemblies like peptide:major histocompatibility complex (MHC) complexes, T cell receptors, and intact antibodies (Birnbaum et al., 2014; Boder and Wittrup, 1997; Boder et al., 2005; Chao et al., 2004; Chen et al., 2013; Ho et al., 2017; Jeong et al., 2019; Jin et al., 2006; Kieke et al., 1999; Levin et al., 2012; Rhiel et al., 2014; Schweickhardt et al., 2003; Warren et al., 2014; Weiskopf et al., 2013; Xu et al., 2011; Zhou et al., 2020). We therefore constructed a genetically barcoded yeast display library of human extracellular and secreted proteins. We initially attempted to include 3,088 proteins in our library, but 400 proteins did not successfully display and were removed from the library during fluorescence-activated cell sorting (FACS) of FLAG-positive clones. Thus, our final yeast display exoproteome library contained the 2,688 human extracellular and secreted proteins that were displayed. This library includes proteins from a wide range of protein families and encompasses 87% of all human exoproteins, with extracellular regions from 50 to 600 amino acids in length (Figures 1B and S1A–S1C). While there is within-library heterogeneity in individual protein abundance and the number of unique barcodes associated with each gene, the library is relatively uniform and the vast majority of proteins falls within a narrow range suited to coverage by standard next-generation sequencing approaches (Figures 1C and 1D). Full details on the design and composition of the library are described in the STAR Methods and Table S1.
Figure 1.

Yeast library and REAP development
(A) Simplified schematic of REAP. Antibodies are incubated with a genetically barcoded yeast library displaying members of the exoproteome in 96-well microtiter plates. Antibody-bound yeast are enriched by magnetic column-based sorting and enrichment is quantified by next-generation sequencing.
(B) Composition of proteins in the yeast library, categorized by broad protein families. Abbreviations are as follows: immunoglobulin superfamily (IgSF), epidermal growth factor (EGF), fibronectin (Fn), leucine-rich repeat (LRR), urokinase receptor (UPAR), C-type lectin (CLEC), and tetraspanin (TSPAN). The cytokine family consists of proteins belonging to tumor necrosis factor, interferon, interleukin, and growth factor protein families.
(C and D) Distribution of total protein frequencies (C) and unique yeast clones per protein (D) in the yeast library. Solid lines indicate the median of the distribution and dotted lines indicate first and third quartiles
We next optimized procedures for high-throughput identification of seroreactivities against proteins in our exoproteome library for REAP (Figure 1A). Briefly, immunoglobulin G (IgG) purified from patient serum or plasma is incubated with the yeast library. Autoantibody-coated cells are then isolated by magnetic separation, and deep sequencing of the library-encoded DNA barcodes is used to identify the corresponding antigens encoded by these cells. To quantify the degree of antibody reactivity to a given antigen, we developed a custom scoring algorithm (REAP score) based on the enrichment of each antigen’s barcodes after selection (see STAR Methods). To characterize the degree of proper expression/folding in our yeast library, we performed REAP on a panel of 236 monoclonal antibodies with 240 known extracellular protein targets present in our library (Figures 2A–2C, S2, and S3). REAP successfully identified 59.2% of the known antibody targets in this panel (Figures 2A, 2B, and S2), with negligible off-target reactivities (Figures 2C and S3). In addition, we performed a REAP screen using a panel of 63 recombinant proteins with 72 known binding partners in the library. REAP accurately detected the cognate binding partners for each of these proteins, with minimal enrichment of off-target proteins (Figure 2D). Altogether, we validated the expression and folding of 192 unique proteins (7.1% of the library) using these two approaches.
Figure 2.

Validation of REAP
A panel of 236 antibodies with 240 known antigen targets were screened using REAP.
(A) Percentages of known antibody targets successfully and unsuccessfully detected by REAP, categorized by broad protein families, as in Figure 1B.
(B) Violin plot of REAP scores of known antibody targets from the antibody panel screen. Each point represents an antigen target and points are colored by antigen protein family, as in (A). Boxplot lines indicate the first, median, and third quartiles.
(C) Violin plot of REAP scores from the antibody panel screen for all proteins that were not known antibody targets.
(D) REAP screen performed using recombinant protein in place of IgG. Proteins on the y axis are categorized by protein family
Evaluation of REAP performance in APS-1
To evaluate the capacity of REAP to detect exoproteome-directed autoantibodies in complex patient samples, such as polyclonal responses in serum, we screened a cohort of 77 APS-1 patients (Table S2). APS-1, also known as autoimmune polyendocrinopathy candidiasis ectodermal dystrophy (APECED), is a rare genetic autoimmune disease caused by mutations in the autoimmune regulator (AIRE) gene, resulting in loss of central tolerance and the development of chronic mucocutaneous candidiasis (CMC), severe endocrinopathies, and other non-endocrine autoimmune sequelae, such as pneumonitis, hepatitis, alopecia, vitiligo, and vitamin B12 deficiency/pernicious anemia (Constantine and Lionakis, 2019). Interestingly, APS-1 patients harbor widespread and pathognomonic autoantibodies targeting numerous cytokines, including types I and III interferons (IFNs), IL-22, IL-17A, and IL-17F (Kisand et al., 2010; Meager et al., 2006; Meloni et al., 2008; Puel et al., 2010; Wolff et al., 2007). REAP readily identified autoantibody responses against these cytokines in APS-1 patient samples but not in samples from healthy controls (Figure 3A). Furthermore, the frequencies of these autoreactivities in APS-1 patients closely matched the frequencies determined from previous reports using gold-standard methodologies, such as ELISA and luciferase immunoprecipitation system (LIPS) immunoassay (Figure 3B) (Kisand et al., 2010; Meager et al., 2006; Meyer et al., 2016). In addition, compared with previous screens of APS-1 patient autoantibodies performed with protein arrays (Meyer et al., 2016) and PhIP-seq (Vazquez et al., 2020), REAP much more sensitively detected these pathognomonic autoreactivities (Figure S1D). We also identified autoantibodies against gastric intrinsic factor (GIF), lipocalin-1 (LCN1), IL-5, IL-6, protein disulfide-isomerase-like protein of the testis (PDILT), and bactericidal/permeability-increasing fold-containing family member 1 and 2 (BPIFA1/2), which have been previously described in APS-1 (Burbelo et al., 2019; Fishman et al., 2017; Landegren et al., 2016; Meyer et al., 2016; Vazquez et al., 2020). With respect to GIF reactivities, the results seen with REAP demonstrated strong concordance with clinical intrinsic factor blocking autoantibody test results from the same patients (Figure 3C).
Figure 3.

REAP screen of APS-1 patients
A cohort of 77 APS-1 patients and 20 healthy controls were screened using REAP.
(A) Heatmap of REAP scores. Antigen groups were manually categorized.
(B) Frequencies of positive reactivities (score ≥ healthy donor average score plus 3 SDs) against 14 antigens based on REAP and prior literature (Kisand et al., 2010; Meager et al., 2006; Meyer et al., 2016).
(C) Violin plot of GIF REAP scores in APS-1 samples stratified by clinical intrinsic factor blocking autoantibody test results.
(D) EC50s of fitted REAP and ELISA dose-response curves for detection of autoantibodies against four proteins in one APS-1 patient. See Figures S1E and S1F for dose-response curves.
(E) Violin plot of the number of reactivities in APS-1 and control samples at a score cutoff of 3.
(F and G) (F) Anti-GPHB5 and (G) anti-PNLIP pan-IgG ELISAs conducted with serial dilutions of serum. Error bars represent SD.
(H) Heatmap of LCN1 and BPIFA1 REAP scores in APS-1 samples stratified by pneumonitis positivity. Listed p values represent significance for the association between LCN1 or BPIFA1 REAP positivity and pneumonitis. Significance in (C) and (E) was determined using a two-sided Mann-Whitney U test. Significance in (H) was determined using a Fisher’s exact test, where LCN1 and BPIFA1 positivity was defined as a REAP score ≥3. In all heatmaps in this figure, score was artificially capped at 7 to aid visualization. In all violin plots in this figure, solid lines represent the median and dotted lines represent the first or third quartile. ∗∗∗∗p ≤ 0.0001
To investigate the reproducibility of REAP, we compared REAP scores between technical (intra-assay) replicates across all APS-1 patient samples in aggregate and found a strong positive correlation between replicates (R2 = 0.932; Figure S1E). Due to the zero-inflated nature of REAP data, we also performed this comparison using only reactivities with REAP scores greater than 1 and found a slightly weaker but still strong positive correlation between replicates (R2 = 0.876; Figure S1F). Finally, we compared REAP scores between technical replicates individually across APS-1 patient samples and found that 75% of samples had an R2 value between 0.931 and 0.959, with the lowest R2 value being 0.796 (Figure S1G). To investigate the sensitivity of REAP, we titrated varying amounts of IgG and performed REAP and ELISA side-by-side for four autoantigens (Figures S1H and S1I). In each case, REAP exhibited higher sensitivity than ELISA by 1–2 orders of magnitude, as seen by the calculated half-maximal effective concentration (EC50) values (Figure 3D). Taken in aggregate, these data indicate that REAP can detect known autoantibody responses against extracellular proteins with high sensitivity and precision.
Broad exoproteome-targeting autoantibody reactivities in APS-1
Previous reports using protein microarrays and PhIP-seq have shown that APS-1 patients have greatly elevated numbers of autoantibody reactivities compared with healthy controls (Fishman et al., 2017; Landegren et al., 2016; Meyer et al., 2016; Vazquez et al., 2020). We found that global autoreactivity present in APS-1 also extends to the exoproteome, as REAP uncovered numerous public (present in more than one patient) and private (present in only one patient) reactivities (Figures 3E, S4A, and S4B). Two notable public reactivities were those against glycoprotein hormone beta-5 (GPHB5), a thyrostimulin subunit, and pancreatic triacylglycerol lipase (PNLIP), a tissue-restricted antigen that is regulated by AIRE in the thymus (St-Pierre et al., 2015). Using ELISA, we confirmed the presence of autoantibody responses against these proteins and found that the titers of autoantibodies were high, ranging from EC50s of approximately 1:100 to 1:10,000 (Figures 3F and 3G). We additionally were able to correlate particular serological responses to specific, variable clinical features of APS-1. For example, we found that autoantibodies against LCN1 and BPIFA1, which had previously been identified in APS-1 patients with Sjögren’s-like syndrome (Burbelo et al., 2019), were enriched in a subset of APS-1 patients with pneumonitis (6 out of 28 with pneumonitis), a life-threatening non-endocrine complication of APS-1, but universally negative in 49 patients without pneumonitis or healthy controls (Figure 3H). Of note, BPIFA1 reactivity was detected in a patient with biopsy-proven pneumonitis without reactivity to the known lung-targeted autoantibodies KCNRG and BPIFB1, which have an overall sensitivity of ∼75% but are negative in a quarter of patients with biopsy-proven pneumonitis (Ferré et al., 2019). Interestingly, the single patient in our cohort with exocrine pancreatic insufficiency, a rare manifestation of APS-1 (Constantine and Lionakis, 2019), uniquely harbored reactivity to colipase (CLPS), an essential cofactor for pancreatic lipase and related lipases (Figure 3A) (Lowe, 1997). Thus, REAP enabled the detection of autoantibody reactivities in the monogenic disease APS-1 as well as correlations of autoantibodies with clinical features of the disease.
REAP identifies autoantibody reactivities in SLE patients
We sought to apply REAP to study SLE, a systemic polygenic autoimmune disease characterized by loss of tolerance to nucleic acids (Tsokos et al., 2016). Though autoantibodies are a defining feature in SLE, particularly those against nucleic acids and nuclear protein complexes (Pisetsky and Lipsky, 2020), the role of functional autoantibodies that target the exoproteome is less well established. Previous studies have identified autoantibodies against extracellular and secreted proteins in SLE patients but have only sampled a small portion of the exoproteome (Gupta et al., 2016; Haddon et al., 2015; Howe et al., 2017; Morimoto et al., 2011; Price et al., 2013; Sjöwall et al., 2004; Uchida et al., 2019). We thus performed REAP analysis on samples from a cohort of 106 SLE patients and 20 healthy controls. Patient and control demographics are shown in Table S3. Compared with APS-1, we found that exoproteome-targeting autoantibodies in SLE patients were strikingly heterogeneous; though a wide variety of autoantigens were identified, there were essentially no public autoantigens and most reactivities were present in only a few patients (Figure 4A). Several reactivities identified by REAP included autoantigens that have previously been described in SLE, such as IL-6, type I IFNs, IL-1α, and TNF-α (Evans and Abdou, 1994; Morimoto et al., 2011; Sjöwall et al., 2004; Suzuki et al., 1991). In addition, one patient in the cohort was administered a therapeutic anti-TNF-α antibody, and this antibody was identified by REAP (white star, Figure 4A). Several patients were treated with therapeutic antibodies that target CD20 or BAFF (Table S3), but we did not identify these by REAP. CD20 therapeutic antibodies were not detected because CD20 is not in the yeast display library. BAFF is present in the library, so the lack of detection could be due to lack of effective expression of BAFF in the library or outside factors, such as low levels of available circulating therapeutic antibodies. We further identified numerous autoantibodies targeting other cytokines (e.g., IL-4 and IL-33), chemokines (e.g., CXCL3 and CCL8), growth factors (e.g., vascular endothelial growth factor [VEGF]-B and fibroblast growth factor [FGF]-21), extracellular matrix components (e.g., epiphycan and vitrin), and immunoregulatory cell surface proteins (e.g., FAS, PD-L2, and B7-H4).
Figure 4.

REAP screen of SLE patients
A cohort of 106 unique SLE patients spanning 155 samples and 20 healthy controls was screened using REAP.
(A) Heatmap of REAP scores where each column is a unique patient. For patients with longitudinal samples, the maximum REAP score for each given reactivity is shown. Antigen groups were manually categorized. Patients are ordered from left to right by increasing SLEDAI score. White stars symbolize detection of a therapeutic antibody. Score was artificially capped at 7 to aid visualization.
(B) Violin plots of the number of reactivities in control samples (n = 20) and SLE samples stratified by severe (n = 45), active (n = 33), mild (n = 43), and inactive (n = 34) disease at a score cutoff of 3. Significance was determined using a Kruskal-Wallis test followed by a Dunnett’s test.
(C) Heatmap of false discovery rate-adjusted p values from two-sided Mann-Whitney U tests comparing REAP score distributions for specific proteins between patients stratified by clinical manifestations. Only reactivities positive (score ≥ 3) in at least 3 patients were tested.
(D) SLEDAI scores for SLE patients stratified by REAP reactivity against CCL8.
(E) SLEDAI scores for SLE patients stratified by REAP reactivity against immunoregulatory antigens (defined in [A]).
(F) Anti-PD-L2 and (I) anti-IL-33 pan-IgG ELISAs conducted with serial dilutions of SLE or control serum.
(G and G) (G) Schematic and (H) results of PD-L2 blocking assay conducted with serial dilutions of serum from a healthy control and the SLE patient in (F).
(J and K) (J) Schematic and (K) results of IL-33 neutralization assay conducted with serial dilutions of IgG from a healthy control and the SLE patient in (I). Significance in (D) and (E) was determined using a two-sided Mann-Whitney U test. All error bars in this figure represent SD. For all analyses in this figure; positive reactivities were defined as those with REAP score ≥3. ∗p ≤ 0.05, ∗∗p ≤ 0.01
To validate the large number of candidate autoantibody reactivities identified by REAP, we tested autoantibody reactivities against several different proteins using LIPS and ELISA and subsequently confirmed 16 of these autoantigens (Table 1; Figures 4F, 4I, S5A–S5H, S5J, and S5N–S5R). The subset of confirmed autoantibody reactivities consisted of both shared and private reactivities and included examples of potentially pathological and well as immunomodulatory reactivities, such as those against the extracellular matrix component epiphycan (Figure S5N), the cytokine receptor IL-18Rβ (Figure S5P), the death receptor FAS/TNFRSF6 (Figure S5E), the co-inhibitory ligand PD-L2 (Figure 4F), and the IL-1 family cytokine IL-33 (Figure 4I). We additionally characterized the titers and IgG isotypes for several of these responses, finding that they spanned a wide range of titers (1:10 to >1:10,000) and isotype classes (Figures S5N–S5R, and S5U–S5W). Using these results, as well as validations of known APS-1 reactivities (Figures S5I–S5M) and previously published validations (Wang et al., 2021), we performed receiver operating characteristic (ROC) analysis to quantify the performance of the REAP scoring algorithm. We found that REAP score sensitively and specifically predicted autoantibody reactivity by ELISA and/or LIPS, with an area under the curve (AUC) of 0.785 (Figures S5S and S5T). Because REAP exhibits greater sensitivity for some antigens than the ELISA/LIPS gold standards (as was the case for type I IFN autoantibodies in APS-1), this number may represent a conservative estimate of the true performance of REAP in predicting autoantibody reactivity.
Table 1.
Orthogonal validation of autoantibody reactivities identified in SLE patients
| Antigen | # Candidate Samples Tested | REAP Score Range | # Validated by ELISA or LIPS |
|---|---|---|---|
| VEGF-B | 10 | 1.67–8.88 | 10 |
| IFN-α17 | 8 | 1.85–10.33 | 8 |
| IFN-α8 | 7 | 1.13–8.92 | 4 |
| FAS | 6 | 1.73–4.95 | 4 |
| EPYC | 4 | 4.93–9.46 | 4 |
| CSPG5 | 6 | 1.64–5.92 | 3 |
| IL-6 | 3 | 3.60–7.82 | 3 |
| PD-L2 | 4 | 2.43–9.69 | 2 |
| IL-4 | 2 | 5.78–6.09 | 2 |
| CCL8 | 4 | 4.59–6.44 | 1 |
| IL-33 | 1 | 3.88 | 1 |
| IL-18Rβ | 1 | 3.3 | 1 |
| IL-16 | 1 | 4.03 | 1 |
| LILRB4 | 1 | 3.85 | 1 |
| ACVR2B | 1 | 8.56 | 1 |
| IER3 | 1 | 4.23 | 1 |
| IFNL2 | 6 | 3.27–7.74 | 0 |
| NGFR | 4 | 3.40–6.73 | 0 |
| RGMB | 4 | 4.15–5.49 | 0 |
| CD44 | 1 | 6.34 | 0 |
| RAET1E | 1 | 7.6 | 0 |
Clinical features and functionality of exoproteome-targeting autoantibodies in SLE
Given the broad distribution of autoantibody responses in SLE, we wondered if particular responses or patterns of reactivity were associated with specific clinical features of the disease. At a global level, we found that samples from patients with severe disease (SLEDAI score ≥9) had significantly increased numbers of autoantibodies compared with healthy controls (Figures 4B, S4C, and S4D). Disease severity was measured by the Systemic Lupus Erythematosus Disease Activity Index (SLEDAI) score (Bombardier et al., 1992). Furthermore, SLE patients in all severity groups had reactivities that were not observed in healthy individuals, and these patterns of reactivity were associated with particular SLE disease phenotypes. For instance, we found that autoantibody reactivities against the chemokine CCL8, the cytokine IFN-α6, and the C-type lectin CD248 (endosialin) were significantly associated with hematuria and that VEGF-B reactivities were associated with leukopenia (Figure 4C). Additionally, patients positive for CCL8 reactivity had significantly higher SLEDAI scores, indicating more severe disease (Figure 4D). By contrast, patients who exhibited autoreactivity against a set of immunoregulatory proteins (PD-L2, RAET1E, CD44, B7H4, BTNL8, CD300E, IER3, TNFRSF6, CD300LG, LILRB2, IGLL1, and LILRB4) had significantly lower SLEDAI scores compared to patients negative for these autoantibodies (Figure 4E).
Finally, we characterized the functionality of autoantibodies against two immunomodulatory autoantigens identified by REAP: PD-L2 and IL-33. Because the primary biological function of PD-L2 is mediated by its binding to its receptor programmed cell death protein 1 (PD-1), we tested whether autoantibodies against PD-L2 could block this interaction. Serum samples from an SLE patient with anti-PD-L2 autoantibodies inhibited the interaction between PD-L2 and PD-1 in a dose-dependent manner, while serum from a control patient without anti-PD-L2 autoantibodies did not (Figures 4F–4H). To test the functional effects of anti-IL-33 autoantibodies, we used a HEK-Blue IL-33 reporter cell line, which produces secreted alkaline phosphatase downstream of a nuclear factor (NF)-κB promoter that is activated by the IL-33 pathway. Bulk IgG (isolated via protein G) from the SLE patient harboring anti-IL-33 autoantibodies potently neutralized IL-33 signaling with a half-maximal inhibitory concentration (IC50) less than 0.01 mg/mL, while IgG from a control patient without anti-IL-33 autoantibodies had no neutralizing effect (Figures 4I–4K). These findings underscore the ability of REAP to discover autoantibodies with functional biological effects.
Discussion
In the present study, we show that REAP is a sensitive and high-throughput platform for the discovery of exoproteome-directed autoantibodies. By querying antigens in a conformationally active state, REAP enables the identification of autoantibodies that are difficult to detect, if not entirely invisible to other technologies. This was particularly evident in our screen of APS-1 samples, as we found that REAP was considerably more accurate in detecting a well-defined subset of known extracellular autoantigen reactivities compared with protein arrays and phage-peptide display approaches. Furthermore, REAP enabled the identification of numerous other exoproteome autoantigens in APS-1 patients.
We also identified a large set of autoantibody reactivities against the exoproteome in SLE patients, a considerably more heterogeneous population than APS-1. A vast majority of these autoreactivities were relatively private, with a prevalence of <5%, and in some cases present in only a single patient. Though these autoantibody responses are rare, our studies suggest that they can exert large biological effects that could meaningfully impact disease progression, akin to the effects of rare genetic variants. For example, we identified a single SLE patient with mild disease activity (SLEDAI score of 1) who had extraordinarily high-titer autoantibodies against IL-33 that potently neutralized IL-33 signaling in vitro. In SLE patients, elevated IL-33 concentrations are positively correlated with C-reactive protein concentrations and clinical manifestations, such as thrombocytopenia and erythrocytopenia (Guo et al., 2016; Yang et al., 2011). In mouse models, IL-33 exposure is associated with autoantibody production, and neutralization of IL-33 suppresses lupus-like disease (Li et al., 2014; Rose et al., 2018). Thus, it is possible that the IL-33 autoantibodies may have ameliorated disease severity in this individual. Beyond IL-33, we also found that SLE patients with autoreactivity against a set of immunoreceptors had substantially lower disease severity, indicating that disruption of those pathways and/or opsonization of cells that express these receptors could similarly exert a protective effect. Future investigation is needed to mechanistically study the potential protective effects of these autoantibodies and their overall prevalence among SLE patients. Nevertheless, the fact that the presence of these potentially disease-modifying autoantibodies is highly variable between patients underscores the need for technologies like REAP that can provide comprehensive, unbiased antibody profiling for large numbers of patients. Without sufficient sample throughput and representation of the exoproteome, these rare but impactful autoantibody responses might not be readily detected.
At an aggregate level, we found that autoantibody reactivity numbers were significantly elevated in SLE patients with the most severe disease but not in milder forms of disease. This could be explained by several factors. For example, it is possible that the formation of large numbers of exoproteome-targeting autoantibodies quickly drives disease progression toward a severe phenotype or only occurs in the most severe forms of disease. Alternatively, it is possible that these autoantibodies in aggregate have limited predictive utility in terms of disease severity or that they generally are not associated with the clinical phenotypes that comprise the SLEDAI score. Finally, it is possible that the formation of these autoantibodies is highly stochastic and variable and that our study is underpowered to detect elevated autoantibody reactivity numbers in milder forms of disease. Future studies are needed to clarify the connections between exoproteome-targeting autoantibody reactivity numbers and disease severity in SLE.
Though we initially applied REAP to the study of autoimmune conditions, an intriguing avenue of future study with REAP and other serological profiling technologies is to characterize autoantibody responses in diseases such as cancer, infectious diseases, and neurological conditions that are not considered to have a primarily autoimmune etiology. Identification of disease-modifying antibody responses in such conditions could implicate new molecular pathways that contribute to disease pathology and lead to the development of novel therapeutic targets and molecular diagnostics. Furthermore, patient autoantibodies could represent potential therapeutic agents themselves. Technologies such as REAP can enable these discoveries by revealing the diverse landscape of functional autoantibody responses that influence health and disease.
Limitations of the study
REAP does have important limitations. While we demonstrated that a substantial fraction of the antigens within the REAP library are biochemically active (via recapitulating known binding interactions), our data indicate that some proteins in the library are improperly displayed and/or folded. Autoantibodies that target these proteins would thus not be identified by REAP. Furthermore, our library was constructed using a collection of human cDNA libraries and de novo gene synthesis based on consensus protein sequences. Thus, patient-specific mutations in extracellular regions of proteins may negatively impact REAP’s ability to detect antibodies against these proteins. Finally, while yeast do perform O- and N- linked glycosylation, their glycosylation patterns are characterized by a hypermannose structure that is highly divergent from glycosylation seen in humans (Herscovics and Orlean, 1993). Thus, autoantibodies recognizing specific glycoforms of their antigens would not be detected with REAP. Further improvement in the REAP platform could therefore involve “rescuing” antigens that do not display through co-expressing obligate binding partners and through yeast strain engineering to co-express mammalian chaperone proteins and glycosylation enzymes to produce more human-like glycosylation patterns, as has been described for the yeast species Pichia pastoris (Hamilton and Gerngross, 2007).
STAR★Methods
Key resources table
| REAGENT or RESOURCE | SOURCE | IDENTIFIER |
|---|---|---|
| Antibodies | ||
| Biotin anti-human IgG Fc antibody | BioLegend | Cat#409307; RRID:AB_11150771 |
| Goat anti-human IgG HRP | Millipore Sigma | Cat#AP112P; RRID:AB_90720 |
| Mouse anti-human IgG1 Fc HRP | Southern Biotech | Cat#9054-05; RRID:AB_2796627 |
| Mouse anti-human IgG2 Fc HRP | Southern Biotech | Cat#9060-05; RRID:AB_2796633 |
| Mouse anti-human IgG3 Hinge HRP | Southern Biotech | Cat#9210-05; RRID: AB_2796699 |
| Mouse anti-human IgG4 Fc HRP | Southern Biotech | Cat#9200-05; RRID:AB_2796691 |
| LegendScreen Human PE Kit | BioLegend | Cat#700007 |
| Biological samples | ||
| APS-1 patient samples | NIH Clinical Center | https://clinicalcenter.nih.gov/ |
| SLE patient samples | Yale New Haven Hospital | https://www.ynhh.org/ |
| Chemicals, peptides, and recombinant proteins | ||
| Tn5 transposase | Picelli et al. (2014) | NA |
| Recombinant proteins used in REAP | This study | NA |
| Recombinant proteins used in ELISAs | This study | NA |
| Recombinant proteins used in LIPS | This study | NA |
| Biotinylated human PD-1 | This study | NA |
| PE streptavidin | BioLegend | Cat#405203 |
| Human IL-33 | R&D Systems | Cat#3625-IL-010 |
| Critical commercial assays | ||
| Zymoprep Yeast Plasmid Miniprep II kits | Zymo Research | Cat#D2004 |
| Zymoprep-96 Yeast Plasmid Miniprep kits | Zymo Research | Cat#D2007 |
| Protein G magnetic resin | Lytic Solutions | NA |
| Streptavidin MicroBeads | Miltenyi Biotec | Cat#130-048-101 |
| Anti-PE MicroBeads | Miltenyi Biotec | Cat#130-048-801 |
| μMACS Protein G MicroBeads | Miltenyi Biotec | Cat#130-071-101 |
| Multi-96 Columns | Miltenyi Biotec | Cat#130-092-445 |
| Magnetic PCR purification beads | AvanBio | Cat#DF02003 |
| ExpiFectamine 293 Transfection Kit | ThermoFisher Scientific | Cat#A14525 |
| Pierce Protein A/G Ultralink Resin | ThermoFisher Scientific | Cat#53135 |
| 96-well opaque Multiscreen HTS 96 HV 0.45 um filter plates | Millipore Sigma | Cat#MSHVN4B50 |
| QUANTI-Luc Gold | InvivoGen | Cat#rep-qlcg5 |
| QUANTI-Blue Solution | InvivoGen | Cat#rep-qbs |
| TransIT-LT1 Transfection Reagent | Mirus Bio | Cat#MIR2300 |
| 96-well flat-bottom Immulon 2HB plates | ThermoFisher Scientific | Cat#3455 |
| TMB Substrate Reagent Set | BD Biosciences | Cat#555214 |
| Experimental models: cell lines | ||
| IL-33 reporter cell line | This study | NA |
| HEK-Blue IL-18 cell line | InvivoGen | Cat#hkb-hmil18 |
| Experimental models: organisms/strains | ||
| S. cerevisiae: Strain background: JAR300 | The Dane Wittrup Laboratory | NA |
| Oligonucleotides | ||
| Primer: bc1-TTGTTAATATACCTCTATACTTTAA CGTCAAGGAGAAAAAACCCCGGATC |
This study | NA |
| Primer: bc2-CTGCATCCTTTAGTGAG GGTTGAANNNNNNNNNNNNNNNTTCGA TCCGGGGTTTTTTCTCCTTG |
This study | NA |
| Primer: bc3-TTCAACCCTCACTAAAGG ATGCAGTTACTTCGCTGTTTTTCAATA TTTTCTGTTATTGC |
This study | NA |
| Primer: bc4-TGCTAAAACGCTAGCAA TAACAGAAAATATTGAAAAACAGCG |
This study | NA |
| Primer:159_DIF2-TCGTCGGCAGCG TCAGATGTGTATAAGAGACAGNNNNN NNNNNGAGAAAAAACCCCGGATCG |
This study | NA |
| Primer: 159_DIR2-GTCTCGTGGGCTCGGAGA TGTGTATAAGAGACAGNNNNNNNNNNAC GCTAGCAATAACAGAAAATATTG |
This study | NA |
| Recombinant DNA | ||
| Plasmid: pEZT_Dlux | This study | NA |
| Plasmid: pDD003 | This study | NA |
| Plasmid: pD2610-v12 | ATUM | NA |
| Plasmid: pEZT-BM (Morales-Perez et al., 2016) | Addgene | Plasmid #74099; RRID:Addgene_74099 |
| Plasmid: pL-SFFV.Reporter.RFP657.PAC (Heckl et al., 2014) | Addgene | Plasmid #61395; RRID:Addgene_61395 |
| Plasmid: psPAX2 | Addgene | Plasmid #12260; RRID:Addgene_12260 |
| Plasmid: pMD2.G | Addgene | Plasmid #12259; RRID:Addgene_12259 |
| Software and algorithms | ||
| R (version 4.0.2) | CRAN | https://www.r-project.org/ |
| edgeR (version 3.30.3) | Bioconductor | https://bioconductor.org/packages/release/bioc/html/edgeR.html |
| custom analysis code | This study | Zenodo: https://doi.org/10.5281/zenodo.5789092 |
Resource availability
Lead contact
Further information and requests for resources and reagents should be directed to and will be fulfilled by the lead contact, Aaron M. Ring (aaron.ring@yale.edu).
Materials availability
This study did not generate new unique reagents.
Experimental model and subject details
APS-1 patient samples
Collection of APS-1 patient blood samples was performed under a NIAID IRB-approved prospective natural history study (11-I-0187, NCT01386437). Patients underwent a comprehensive clinical evaluation at the NIH Clinical Center including a detailed history and physical examination, laboratory and radiologic evaluations and consultations by a multidisciplinary team of specialists including infectious disease, immunology, genetics, endocrinology, gastroenterology, hepatology, pulmonology, dermatology, dental, and ophthalmology, as previously described (Ferre et al., 2016). Samples from 77 patients were obtained. The sex of 45 of the patients was female and that of 32 patients was male. The average age of patients was 24 years. Full patient demographics and clinical characteristics are reported in Table S2. All study participants provided written informed consent.
SLE patient samples
Collection of SLE patient blood samples was approved by the Yale Human Research Protection Program Institutional Review Boards (protocol ID 1602017276). All patients met the 2012 SLICC classification criteria for SLE (Petri et al., 2012). Clinical information was gathered via retrospective EMR review. Samples from 105 patients were obtained. Demographic and clinical data were not available for 20 patients. Of the patients with available demographic and clinical data, the sex of 76 of the patients was female and that of 9 patients was male. The average age of patients was 41.7 years. Full patient demographics and clinical characteristics are reported in Table S3. Informed consent was obtained from all patients.
Yeast culture and induction
The yeast library was cultured and induced as follows. A frozen aliquot of the library was thawed and recovered in SDO-Ura at 30°C. The following day, the yeast were expanded in SDO-Ura at 30°C. On the third day, at an optical density (OD) below 8 yeast were induced by resuspension at an OD of 1 in SGO-Ura supplemented with 10% SDO-Ura and culturing at 30°C for approximately 18 h.
Mammalian cell culture
IL-33 reporter cells were cultured in DMEM with 10% (v/v) FBS, 100 units/mL penicillin, and 0.1 mg/mL streptomycin at 37°C, 5% CO2.
Method details
Yeast surface display library production and induction
An initial library of 3093 human extracellular proteins was assembled based on protein domains, immunological functions, and yeast-display compatibility. The extracellular portion of each protein was identified by manual inspection of topological domains annotated in the SwissProt database (January 2018). For proteins with uncertain topology, full sequences were run through SignalP 4, Topcons, and GPIPred to identify most likely topologies. For proteins with multiple extracellular portions, in general the longest individual region was chosen for initial amplification. cDNAs for chosen proteins were purchased from GE Dharmacon or DNASU. The protein sequences were further modified to match isoforms available in purchased cDNAs. An inventory of antigens included in the library are compiled in Table S1.
A two-step PCR process was used to amplify cDNAs for cloning into a barcoded yeast-display vector. cDNAs were amplified with gene-specific primers, with the forward primer containing a 5′ sequence (CTGTTATTGCTAGCGTTTTAGCA) and the reverse primer containing a 5′ sequence (GCCACCAGAAGCGGCCGC) for template addition in the second step of PCR. PCR reactions were conducted using 1 μL pooled cDNA, gene-specific primers, and the following PCR settings: 98°C denaturation, 58°C annealing, 72°C extension, 35 rounds of amplification. 1 μL of PCR product was used for direct amplification by common primers Aga2FOR and 159REV, and the following PCR settings: 98°C denaturation, 58°C annealing, 72°C extension, 35 rounds of amplification. PCR product was purified using magnetic PCR purification beads (AvanBio). 90 μL beads were added to the PCR product and supernatant was removed. Beads were washed twice with 200 μL 70% ethanol and resuspended in 50 μL water to elute PCR products from the beads. Beads were removed from purified PCR products. The 15bp barcode fragment was constructed by overlap PCR. 4 primers (bc1, bc2, bc3, bc4; sequences listed in the key resources table) were mixed in equimolar ratios and used as a template for a PCR reaction using the following PCR settings: 98°C denaturation, 55°C annealing, 72°C extension, 35 rounds of amplification. Purified product was reamplified with the first and fourth primer using identical PCR conditions. PCR products were run on 2% agarose gels and purified by gel extraction (Qiagen). Purified barcode and gene products were combined with linearized yeast-display vector (pDD003 digested with EcoRI and BamHI) and electroporated into JAR300 yeast using a 96-well electroporator (BTX Harvard Apparatus) using the following electroporation conditions: Square wave, 500 V, 5 ms pulse, 2 mm gap. Yeast were immediately recovered into 1 mL liquid synthetic dextrose medium lacking uracil (SDO -Ura) in 96-well deep well blocks and grown overnight at 30°C. Yeast were passaged once by 1:10 dilution in SDO-Ura, then frozen as glycerol stocks. To construct the final library, 2.5 μL of all wells were pooled and counted. A limited dilution of 300,000 clones was sub-sampled and expanded in SDO-Ura. Expression was induced by passaging into synthetic galactose medium lacking uracil (SGO-Ura) at a 1:10 dilution and growing at 30°C overnight. 108 yeast were pelleted and resuspended in 1 mL PBE (PBS with 0.5% BSA and 0.5 mM EDTA) containing 1:100 anti-FLAG PE antibody (BioLegend). Yeast were stained at 4° for 75 min, then washed twice with 1 mL PBE and sorted for FLAG display on a Sony SH800Z cell sorter. Sorted cells were expanded in SDO-Ura supplemented with 35 μg/mL chloramphenicol, expanded, and frozen as the final library.
Barcode-gene pairings were identified using a custom Tn5-based sequence approach. Tn5 transposase was purified as previously described, using the on-column assembly method for loading oligos (Picelli et al., 2014). DNA was extracted from the yeast library using Zymoprep-96 Yeast Plasmid Miniprep kits or Zymoprep Yeast Plasmid Miniprep II kits (Zymo Research) according to standard manufacturer protocols. 5 μL of purified plasmid DNA was digested with Tn5 in a 20 μL total reaction as previously described. 2 μL of digested DNA was amplified using primers index1 and index2, using the following PCR settings: 98°C denaturation, 56°C annealing, 72°C extension, 25 rounds of amplification. The product was run on a 2% gel and purified by gel extraction (Qiagen). Purified product was amplified using primers index3 and index4, using the following PCR settings: 98°C denaturation, 60°C annealing, 72°C extension, 25 rounds of amplification. In parallel, the barcode region alone was amplified using primers index1 and index5, using the following PCR settings: 98°C denaturation, 56°C annealing, 72°C extension, 25 rounds of amplification. The product was run on a 2% gel and purified by gel extraction (Qiagen). Purified product was amplified using primers index3 and index6, using the following PCR settings: 98°C denaturation, 60°C annealing, 72°C extension, 20 rounds of amplification. Both barcode and digested fragment products were run on a 2% gel and purified by gel extraction (Qiagen). NGS library was sequenced using an Illumina MiSeq and Illumina v3 MiSeq Reagent Kits with 150 base pair single-end sequencing according to standard manufacturer protocols. Gene-barcode pairings were identified using custom code. Briefly, from each read, the barcode sequence was extracted based on the identification of the flanking constant vector backbone sequences, and the first 25 bp of sequence immediately following the constant vector backbone-derived signal peptide were extracted and mapped to a gene identity based on the first 25 bp of all amplified cDNA constructs. The number of times each barcode was paired with an identified gene was calculated. Barcode-gene pairings that were identified more than twice, with an overall observed barcode frequency of greater than .0002% were compiled. For barcodes with multiple gene pairings matching the above criteria, the best-fit gene was manually identified by inspection of all barcode-gene pairing frequencies and, in general, identification of the most abundant gene pairing. In the final library, 2,688 genes were confidently mapped to 35,835 barcodes.
Rapid extracellular antigen profiling (REAP)
Antibody purification and yeast adsorption were performed as follows. 20 μL protein G magnetic resin (Lytic Solutions) was washed twice with 100 μL sterile PBS, resuspended in 50 μL PBS, and added to 50 μL serum or plasma. Serum-resin mixture was incubated for 3 h at 4°C with shaking. Resin was washed five times with 200 μL PBS, resuspended in 90 μL 100 mM glycine pH 2.7, and incubated for 5 minat room temperature. Supernatant was extracted and added to 10 μL sterile 1M Tris pH 8.0 (purified IgG). Empty vector (pDD003) yeast were expanded in SDO-Ura at 30°C. One day later, yeast were induced by 1:10 dilution in SGO-Ura for 24 h. 108 induced yeast were washed twice with 200 μL PBE (PBS with 0.5% BSA and 0.5 mM EDTA), resuspended with 100 μL purified IgG, and incubated for 3 hat 4°C with shaking. Yeast-IgG mixtures were placed into 96 well 0.45 um filter plates (Thomas Scientific) and yeast-depleted IgG was eluted into sterile 96 well plates by centrifugation at 3000 g for 3 min.
Selection of the yeast surface display library was performed as follows. Prior to selection, 400 μL of the induced pre-selection library was set aside to allow for comparison to post-selection libraries. Then, 108 induced yeast were washed twice with 200 μL PBE and added to wells of a sterile 96-well v-bottom microtiter plate. Yeast were resuspended in 100 μL PBE containing appropriate antibody concentration and incubated with shaking for 1 h at 4°C. Unless otherwise indicated, 10 μg antibody per well was used for human serum or plasma derived antibodies and 1 μg antibody was used for monoclonal antibodies. Yeast were washed twice with 200 μL PBE, resuspended in 100 μL PBE with a 1:100 dilution of biotin anti-human IgG Fc antibody (clone HP6017, BioLegend). Yeast-antibody mixtures were incubated with shaking for 30 min at 4°C. Yeast were washed twice with 200 μL PBE, resuspended in 100 μL PBE with a 1:20 dilution of Streptavidin MicroBeads (Miltenyi Biotec), and incubated with shaking for 30 min at 4°C. Yeast were then pelleted and kept on ice. Multi-96 Columns (Miltenyi Biotec) were placed into a MultiMACS M96 Separator (Miltenyi Biotec) and the separator was placed into positive selection mode. All following steps were carried out at room temperature. Columns were equilibrated with 400 μL 70% ethanol followed by 700 μL degassed PBE. Yeast were resuspended in 200 μL degassed PBE and placed into the columns. After the mixture had completely passed through, columns were washed three times with 700 μL degassed PBE. To elute the selected yeast, columns were removed from the separator and placed over 96-well deep well plates. 700 μL degassed PBE was added to each well of the column and the column and deep well plate were spun at 50 g for 30 seconds. This process was repeated 3 times. Selected yeast were pelleted, and recovered in 1 mL SDO -Ura at 30°C.
For the monoclonal antibody yeast library selections, all pre-selection and yeast induction steps were performed identically to those of the patient-derived antibody yeast library selections. 108 induced yeast were washed twice with 200 μL PBE and added to wells of a sterile 96-well v-bottom microtiter plate. Yeast were resuspended in 100 μL PBE containing 10 μL resuspended antibodies from the LegendScreen Human PE Kit (BioLegend, #700007) and incubated with shaking for 1 h at 4°C. Only antibodies with targets in the yeast display library were screened. Yeast were washed twice with 200 μL PBE, resuspended in 100 μL PBE with 5 μL anti-PE MicroBeads (Miltenyi Biotec), and incubated with shaking for 30 min at 4°C. Selection of yeast using the MultiMACS M96 Separator and subsequent steps were performed identically as those of the antibody yeast library selections.
For the recombinant protein yeast library selections, all pre-selection and yeast induction steps were performed identically to those of the patient-derived antibody yeast library selections. 108 induced yeast were washed twice with 200 μL PBE and added to wells of a sterile 96-well v-bottom microtiter plate. Yeast were resuspended in 100 μL PBE containing 75 μL clarified protein expression supernatant and incubated with shaking for 1 h at 4°C. Yeast were washed twice with 200 μL PBE, resuspended in 100 μL PBE with 5 μL μMACS Protein G MicroBeads (Miltenyi Biotec), and incubated with shaking for 30 min at 4°C. Selection of yeast using the MultiMACS M96 Separator and subsequent steps were performed identically as those of the antibody yeast library selections.
Preparation and sequencing of the next generation sequencing libraries were performed as follows. DNA was extracted from yeast libraries using Zymoprep-96 Yeast Plasmid Miniprep kits or Zymoprep Yeast Plasmid Miniprep II kits (Zymo Research) according to standard manufacturer protocols. A first round of PCR was used to amplify a DNA sequence containing the protein display barcode on the yeast plasmid. PCR reactions were conducted using 1 μL plasmid DNA, 159_DIF2 and 159_DIR2 primers (sequences listed in the key resources table), and the following PCR settings: 98°C denaturation, 58°C annealing, 72°C extension, 25 rounds of amplification. PCR product was purified using magnetic PCR purification beads (AvanBio). 45 μL beads were added to the PCR product and supernatant was removed. Beads were washed twice with 100 μL 70% ethanol and resuspended in 25 μL water to elute PCR products from the beads. Beads were removed from purified PCR products. A second round of PCR was conducted using 1 μL purified PCR product, Nextera i5 and i7 dual-index library primers (Illumina), and the following PCR settings: 98°C denaturation, 58°C annealing, 72°C extension, 25 rounds of amplification. PCR products were pooled and run on a 1% agarose gel. The band corresponding to 257 base pairs was cut out and DNA (NGS library) was extracted using a QIAquick Gel Extraction Kit (Qiagen) according to standard manufacturer protocols. NGS library was sequenced using an Illumina MiSeq and Illumina v3 MiSeq Reagent Kits with 75 base pair single-end sequencing or using an Illumina NovaSeq 6000 and Illumina NovaSeq S4 200 cycle kit with 101 base pair paired-end sequencing according to standard manufacturer protocols. A minimum of 50,000 reads per sample was collected and the pre-selection library was sampled at ten times greater depth than other samples.
Recombinant protein production
Recombinant proteins for REAP were produced as follows. Proteins were produced as human IgG1 Fc fusions to enable binding of secondary antibody and magnetic beads to the produced proteins during the REAP process. Sequences encoding the extracellular portions of proteins-of-interests that were present in the yeast display library were cloned by Gibson assembly into a modified pD2610-v12 plasmid (ATUM). Modifications include addition of an H7 signal sequence followed by a (GGGGS)3 linker and a truncated human IgG1 Fc (N297A). Protein-of-interest sequences were inserted directly downstream of the H7 leader sequence. Protein was produced by transfection into Expi293 cells (Thermo Fisher Scientific) in 96-well plate format. One day prior to transfection, cells were seeded at a density of 2 million cells per mL in Expi293 Expression Medium (Thermo Fisher Scientific). In a 96-well plate, 0.5 μg plasmid DNA was diluted added to 25 μL Opti-MEM (Thermo Fisher Scientific) and mixed gently. In a separate 96-well plate, 1.35 μL ExpiFectamine was added to 25 μL Opti-MEM and mixed gently. The ExpiFectamine-Opti-MEM mixture was added to the diluted DNA, mixed gently, and incubated for 20 min at room temperature. Expi293 cells were diluted to a density of 2.8 million cells per mL and 500 μL of cells were added to each well of a 96-well deep well plate. 50 μL of the DNA-ExpiFectamine-Opti-MEM mixture was added to each well. The plate was sealed with Breathe-Easier sealing film (Diversified Biotech) and incubated in a humidified tissue culture incubator (37°C, 8% CO2) with shaking at 1,200 rpm so that cells were kept in suspension. 18–20 h post-transfection, 25 μL enhancer 2 and 2.5 μL enhancer 1 (Thermo Fisher Scientific) were added to each well. 4 days post-transfection, media was clarified by centrifugation at 3000–4000 g for 5 min. Clarified media was used for recombinant protein REAP.
Recombinant proteins for use in ELISAs were produced as follows. Sequences encoding the extracellular portions of proteins-of-interests that were present in the yeast display library were cloned by Gibson assembly into pEZT_Dlux, a modified pEZT-BM vector. The pEZT-BM vector (Addgene plasmid #74099) was a gift from Ryan Hibbs (Morales-Perez et al., 2016). Modifications included insertion of an H7 Leader Sequence followed by an AviTag (Avidity), HRV 3C site, protein C epitope, and an 8x his tag. Protein-of-interest sequences were inserted directly downstream of the H7 leader sequence. Protein was produced by transfection into Expi293 cells (Thermo Fisher Scientific) according to standard manufacturer protocols. Transfected cells were maintained according to manufacturer protocols. 4 days post-transfection, media was clarified by centrifugation at 300 g for 5 min. Protein was purified from clarified media by nickel-nitrilotriacetic acid (Ni-NTA) chromatography and desalted into HEPES buffered saline + 100 mM sodium chloride, pH 7.5. Protein purity was verified by SDS-PAGE.
Biotinylated recombinant proteins were produced as follows. Sequences encoding the extracellular portions of proteins-of-interests were cloned into pEZT_Dlux as described above. Protein was expressed and purified as described above minus desalting. Enzymatic biotinylation with BirA ligase was performed and protein was purified by size-exclusion fast protein liquid chromatography using a NGC Quest 10 Chromatography System (Bio-Rad).
Recombinant proteins for LIPS were produced as follows. Sequences encoding Lucia luciferase (InvivoGen) fused by a GGSG linker to the N terminus of the protein-of-interest extracellular portion (as defined above) were cloned by Gibson assembly into pEZT-BM. Protein was produced by transfection into Expi293 cells (Thermo Fisher Scientific) according to standard manufacturer protocols. Transfected cells were maintained according to manufacturer protocols. 3 days post-transfection, media was clarified by centrifugation at 300 g for 5 min. Clarified media was used in luciferase immunoprecipitation systems assays.
Enzyme-linked immunosorbent assays (ELISAs)
200 or 400 ng of purchased or independently produced recombinant protein in 100 μL of PBS pH 7.0 was added to 96-well flat-bottom Immulon 2HB plates (Thermo Fisher Scientific) and placed at 4°C overnight. Plates were washed once with 225 μL ELISA wash buffer (PBS + 0.05% Tween 20) and 150 μL ELISA blocking buffer (PBS + 2% Human Serum Albumin) was added to the well. Plates were incubated with shaking for 2 h at room temperature. ELISA blocking buffer was removed from the wells and appropriate dilutions of sample serum in 100 μL ELISA blocking buffer were added to each well. Plates were incubated with shaking for 2 h at room temperature. Plates were washed 6 times with 225 μL ELISA wash buffer and 1:5000 goat anti-human IgG HRP (Millipore Sigma) or anti-human IgG isotype specific HRP (Southern Biotech; IgG1: clone HP6001, IgG2: clone 31-7-4, IgG3: clone HP6050, IgG4: clone HP6025) in 100 μL ELISA blocking buffer was added to the wells. Plates were incubated with shaking for 1 h at room temperature. Plates were washed 6 times with 225 μL ELISA wash buffer. 50 μL TMB substrate (BD Biosciences) was added to the wells and plates were incubated for 15 min (pan-IgG ELISAs) or 20 min (isotype specific IgG ELISAs) in the dark at room temperature. 50 μL 1 M sulfuric acid was added to the wells and absorbance at 450 nm was measured in a Synergy HTX Multi-Mode Microplate Reader (BioTek).
Luciferase immunoprecipitation systems (LIPS) assays
Pierce Protein A/G Ultralink Resin (5 μL; Thermo Fisher Scientific) and 1 μL sample serum in 100 μL Buffer A (50 mM Tris, 150 mM NaCl, 0.1% Triton X-100, pH 7.5) was added to 96-well opaque Multiscreen HTS 96 HV 0.45 μm filter plates (Millipore Sigma). Plates were incubated with shaking at 300 rpm for 1 h at room temperature. Supernatant in wells was removed by centrifugation at 2000 g for 1 min. Luciferase fusion protein (106 RLU) was added to the wells in 100 μL Buffer A. Plates were incubated with shaking at 300 rpm for 1 h at room temperature. Using a vacuum manifold, wells were washed 8 times with 100 μL Buffer A followed by 2 washes with 100 μL PBS. Remaining supernatant in wells was removed by centrifugation at 2000 g for 1 min. Plates were dark adapted for 5 min. An autoinjector equipped Synergy HTX Multi-Mode Microplate Reader (BioTek) was primed with QUANTI-Luc Gold (InvivoGen). Plates were read using the following per well steps: 50 μL QUANTI-Luc Gold injection, 4 second delay with shaking, read luminescence with an integration time of 0.1 seconds and a read height of 1 mm.
PD-L2 blocking assay
A single clone of PD-L2 displaying yeast was isolated from the library and expanded in SDO-Ura at 30°C. Yeast were induced by 1:10 dilution into SGO-Ura and culturing at 30°C for 24 h. 105 induced PD-L2 yeast were washed twice with 200 μL PBE and added to wells of a 96-well v-bottom microtiter plate. Yeast were resuspended in 25 μL PBE containing serial dilutions of sample serum and incubated with shaking for 1 h at 4°C. PD-1 tetramers were prepared by incubating a 5:1 ratio of biotinylated PD-1 and PE streptavidin (BioLegend) for 10 min on ice in the dark. Yeast were washed twice with 200 μL PBE, resuspended in 25 μL PBE containing 10 nM previously prepared PD-1 tetramers, and incubated with shaking for 1 h at 4°C. Yeast were washed twice with 200 μL PBE and resuspended in 75 μL PBE. PE fluorescent intensity was quantified by flow cytometry using a Sony SA3800 Spectral Cell Analyzer. Percent max binding was calculated based on fluorescent PD-1 tetramer binding in the absence of any serum.
IL-33 reporter cell line construction
The full-length coding sequence for ST2 was cloned by Gibson assembly into the lentiviral transfer plasmid pL-SFFV.Reporter.RFP657.PAC (Addgene plasmid #61395), a kind gift from Benjamin Ebert (Heckl et al., 2014). HEK-293FT cells were seeded into a 6-well plate in 2 mL growth media (DMEM with 10% (v/v) FBS, 100 units/mL penicillin, and 0.1 mg/mL streptomycin) and were incubated at 37°C, 5% CO2. Once cells achieved 70%–80% confluence approximately one day later, cells were transfected using TransIT-LT1 (Mirus Bio) in Opti-MEM media (Life Technologies). TransIT-LT1 Reagent was pre-warmed to room temperature and vortexed gently. For each well, 0.88 μg lentiviral transfer plasmid along with 0.66 μg psPAX2 (Addgene plasmid #12260) and 0.44 μg pMD2.G (Addgene plasmid #12259), kind gifts from Didier Trono, were added to 250 μL Opti-MEM media and mixed gently. TransIT-LT1 reagent (6 μl) was added to the DNA mixture, mixed gently, and incubated at room temperature for 15–20 min. The mixture was added dropwise to different areas of the well. Plates were incubated at 37°C, 5% CO2; 48hrs later, the virus-containing media was collected and filtered with a 0.45μm low protein-binding filter. HEK-Blue IL-18 cells (InvivoGen) were seeded into a 6-well plate in 1 mL growth media (DMEM with 10% (v/v) FBS, 100 units/mL penicillin, and 0.1 mg/mL streptomycin) and 1 mL virus-containing media. Cells were incubated at 37°C, 5% CO2 for two days before the media was changed.
IL-33 neutralization assay
Purified IgG titrations and 2 nM IL-33 (R&D Systems) were mixed in 50 μL assay media (DMEM with 10% (v/v) FBS, 100 units/mL penicillin, and 0.1 mg/mL streptomycin) and incubated with shaking for 1 h at room temperature. Approximately 50,000 IL-33 reporter cells in 50 μL assay media were added to wells of a sterile tissue culture grade flat-bottom 96-well plate. IgG-IL-33 mixtures were added to respective wells (1 nM IL-33 final concentration). Plates were incubated at 37°C, 5% CO2 for 20 h, then 20 μL media from each well was added to 180 μL room temperature QUANTI-Blue Solution (InvivoGen) in a separate flat-bottom 96-well plate and incubated at 37°C for 3 h. Absorbance at 655 nm was measured in a Synergy HTX Multi-Mode Microplate Reader (BioTek). Percent max signal was calculated based on signal generated by IL-33 in the absence of any serum.
Quantification and statistical analysis
Analysis of REAP sequencing data
REAP scores were calculated as follows. First, barcode counts were extracted from raw NGS data using custom codes and counts from technical replicates were summed. Next, aggregate and clonal enrichment was calculated using edgeR (Robinson et al., 2010) and custom codes. For aggregate enrichment, barcode counts across all unique barcodes associated with a given protein were summed, library sizes across samples were normalized using default edgeR parameters, common and tagwise dispersion were estimated using default edgeR parameters, and exact tests comparing each sample to the pre-selection library were performed using default edgeR parameters. Aggregate enrichment is thus the log2 fold change values from these exact tests with zeroes in the place of negative fold changes. Log2 fold change values for clonal enrichment were calculated in an identical manner, but barcode counts across all unique barcodes associated with a given protein were not summed. Clonal enrichment for a given reactivity was defined as the fraction of clones out of total clones that were enriched (log2 fold change ≥ 2). Aggregate (Ea) and clonal enrichment (Ec) for a given protein, a scaling factor (βu) based on the number of unique yeast clones (yeast that have a unique DNA barcode) displaying a given protein, and a scaling factor (βf) based on the overall frequency of yeast in the library displaying a given protein were used as inputs to calculate the REAP score, which is defined as follows.
βu and βf are logarithmic scaling factors that progressively penalize the REAP score of proteins with low numbers of unique barcodes or low frequencies in the library. βu is applied to proteins with ≤ 5 unique yeast clones in the library and βf is applied to proteins with a frequency ≤ 0.0001 in the library. βf was implemented to mitigate spurious enrichment signals from low-frequency proteins, which could occur due to sequencing errors or stochasticity in the selection process. βu was implemented because the clonal enrichment metric is less valid for proteins with low numbers of unique yeast clones, decreasing confidence in the validity of the reactivity. βu and βf are defined as follows where xu is the number of unique yeast clones for a given protein and xf is the log10 transformed frequency of a given protein in the library.
| βu = ln(xu + 0.5)/1.705 |
| βf = ln(xf + 7.1)/1.16 |
Antigens with an average REAP score greater than 0.5 across all samples were defined as “sticky” and excluded from further analysis.
ROC analysis of REAP score performance
Orthogonal validation data for the receiver operator curve (ROC) analysis was obtained by ELISA, LIPS, or clinical autoantibody tests. For ELISA and LIPS, valid reactivities were defined as those 3 standard deviations above the healthy donor average for a given protein in each assay. Orthogonal validation data from a previously published study (Wang et al., 2021) was included in the analysis. ROC analysis was performed using 378 test pairs across 64 different proteins. A full list of ROC inputs can be found in Table S4.
Statistical analysis
Statistical details of experiments can be found in the figure legends. All REAP screens and experimental assays were performed with technical replicates. Data analysis was performed using R, Python, Excel, and GraphPad Prism. Unless otherwise specified, adjustment for false discovery rate was performed using the Benjamini-Hochberg procedure.
Acknowledgments
The authors gratefully acknowledge all members of the Ring Laboratory and Daniela Deny for helpful advice and technical assistance. The authors also thank the Yale Section of Rheumatology, Allergy & Immunology for providing systemic lupus erythematosus (SLE) samples from its repository as well as the members of the Yale Rheumatology Clinical and Translational Research Laboratory, Shannon Teaw and Michelle Cheng, for aliquoting SLE patient sera. This work was supported by gifts from the Mathers Family Foundation, Colton Foundation, Ludwig Family Foundation, and a supplement to the Yale Cancer Center support grant 3P30CA016359-40S4. A.M.R. is additionally supported by an NIH Director’s Early Independence Award (DP5OD023088), a Pew-Stewart Award, and the Robert T. McCluskey Foundation. This work was supported by the Division of Intramural Research of the National Institute of Allergy and Infectious Diseases, NIH. The graphical abstract, Figures 1A, 4G, and 4J were created with BioRender.
Author contributions
Conceptualization, E.Y.W., Y.D., C.E.R., and A.M.R.; methodology, E.Y.W., Y.D., C.E.R., and A.M.R.; software, E.Y.W. and C.E.R.; validation, E.Y.W. and Y.D.; formal analysis, E.Y.W., Y.D., E.M., M.S.L., and A.M.R.; investigation, E.Y.W., Y.D., C.E.R., F.L., and Y.Y.; resources – APS-1 patient samples and clinical annotations, M.M.S., E.M.N.F., and M.S.L.; resources – SLE patient samples and clinical annotations, M.X.D.; writing – original draft, E.Y.W. and A.M.R.; writing – review & editing, E.Y.W. and A.M.R.; visualization, E.Y.W.; and supervision, M.H., M.S.L., and A.M.R.
Declaration of interests
E.Y.W., Y.D., C.E.R., and A.M.R. are inventors of a patent describing the REAP technology. A.M.R. is the founder of Seranova Bio; and A.M.R., E.Y.W., Y.D., and C.E.R. hold equity in Seranova Bio.
Published: February 14, 2022
Footnotes
Supplemental information can be found online at https://doi.org/10.1016/j.crmeth.2022.100172.
Supplemental information
Data and code availability
-
•
All data reported in this paper will be shared by the lead contact upon request.
-
•
All original code has been deposited at Zenodo and is publicly available as of the date of publication (Zenodo: https://doi.org/10.5281/zenodo.5789092).
-
•
Any additional information required to reanalyze the data reported in this paper is available from the lead contact upon request.
References
- Benjamin Larman H., Salajegheh M., Nazareno R., Lam T., Sauld J., Steen H., Won Kong S., Pinkus J.L., Amato A.A., Elledge S.J., et al. Cytosolic 5′-nucleotidase 1A autoimmunity in sporadic inclusion body myositis: cN1A Autoimmunity in IBM. Ann. Neurol. 2013;73:408–418. doi: 10.1002/ana.23840. [DOI] [PubMed] [Google Scholar]
- Birnbaum M.E., Mendoza J.L., Sethi D.K., Dong S., Glanville J., Dobbins J., Ozkan E., Davis M.M., Wucherpfennig K.W., Garcia K.C. Deconstructing the peptide-MHC specificity of T cell recognition. Cell. 2014;157:1073–1087. doi: 10.1016/j.cell.2014.03.047. [DOI] [PMC free article] [PubMed] [Google Scholar]
- Boder E.T., Wittrup K.D. Yeast surface display for screening combinatorial polypeptide libraries. Nat. Biotechnol. 1997;15:553–557. doi: 10.1038/nbt0697-553. [DOI] [PubMed] [Google Scholar]
- Boder E.T., Bill J.R., Nields A.W., Marrack P.C., Kappler J.W. Yeast surface display of a noncovalent MHC class II heterodimer complexed with antigenic peptide. Biotechnol. Bioeng. 2005;92:485–491. doi: 10.1002/bit.20616. [DOI] [PubMed] [Google Scholar]
- Bombardier C., Gladman D.D., Urowitz M.B., Caron D., Chang C.H., Committee on Prognosis Studies in SLE Derivation of the SLEDAI. A disease activity index for lupus patients. Arthritis Rheumatol. 1992;35(6):630–640. doi: 10.1002/art.1780350606. [DOI] [PubMed] [Google Scholar]
- Britschgi M., Olin C.E., Johns H.T., Takeda-Uchimura Y., LeMieux M.C., Rufibach K., Rajadas J., Zhang H., Tomooka B., Robinson W.H., et al. Neuroprotective natural antibodies to assemblies of amyloidogenic peptides decrease with normal aging and advancing Alzheimer’s disease. Proc. Natl. Acad. Sci. U S A. 2009;106:12145–12150. doi: 10.1073/pnas.0904866106. [DOI] [PMC free article] [PubMed] [Google Scholar]
- Burbelo P.D., Ferré E.M.N., Chaturvedi A., Chiorini J.A., Alevizos I., Lionakis M.S., Warner B.M. Profiling autoantibodies against Salivary proteins in sicca conditions. J. Dent. Res. 2019;98:772–778. doi: 10.1177/0022034519850564. [DOI] [PMC free article] [PubMed] [Google Scholar]
- Cappellano G., Orilieri E., Woldetsadik A.D., Boggio E., Soluri M.F., Comi C., Sblattero D., Chiocchetti A., Dianzani U. Anti-cytokine autoantibodies in autoimmune diseases. Am. J. Clin. Exp. Immunol. 2012;1:136–146. [PMC free article] [PubMed] [Google Scholar]
- Chao G., Cochran J.R., Wittrup K.D. Fine epitope mapping of anti-epidermal growth factor receptor antibodies through random mutagenesis and yeast surface display. J. Mol. Biol. 2004;342:539–550. doi: 10.1016/j.jmb.2004.07.053. [DOI] [PubMed] [Google Scholar]
- Chen T.F., de Picciotto S., Hackel B.J., Wittrup K.D. Engineering fibronectin-based binding proteins by yeast surface display. Methods Enzymol. 2013;523:303–326. doi: 10.1016/B978-0-12-394292-0.00014-X. [DOI] [PubMed] [Google Scholar]
- Chen W.S., Haynes W.A., Waitz R., Kamath K., Vega-Crespo A., Shrestha R., Zhang M., Foye A., Baselga Carretero I., Perez Garcilazo I., et al. Autoantibody landscape in patients with advanced prostate cancer. Clin. Cancer Res. 2020;26:6204–6214. doi: 10.1158/1078-0432.CCR-20-1966. [DOI] [PMC free article] [PubMed] [Google Scholar]
- Constantine G.M., Lionakis M.S. Lessons from primary immunodeficiencies: autoimmune regulator and autoimmune polyendocrinopathy-candidiasis-ectodermal dystrophy. Immunol. Rev. 2019;287:103–120. doi: 10.1111/imr.12714. [DOI] [PMC free article] [PubMed] [Google Scholar]
- De Virgilio A., Greco A., Fabbrini G., Inghilleri M., Rizzo M.I., Gallo A., Conte M., Rosato C., Ciniglio Appiani M., de Vincentiis M. Parkinson’s disease: autoimmunity and neuroinflammation. Autoimmun. Rev. 2016;15:1005–1011. doi: 10.1016/j.autrev.2016.09.027. [DOI] [PubMed] [Google Scholar]
- Ercolini A.M., Miller S.D. The role of infections in autoimmune disease. Clin. Exp. Immunol. 2009;155:1–15. doi: 10.1111/j.1365-2249.2008.03834.x. [DOI] [PMC free article] [PubMed] [Google Scholar]
- Evans M., Abdou N.I. Anti-interleukin-6 and soluble interleukin-6 receptor in systemic lupus erythematosus. Lupus. 1994;3:161–166. doi: 10.1177/096120339400300306. [DOI] [PubMed] [Google Scholar]
- Ferre E.M.N., Rose S.R., Rosenzweig S.D., Burbelo P.D., Romito K.R., Niemela J.E., Rosen L.B., Break T.J., Gu W., Hunsberger S., et al. Redefined clinical features and diagnostic criteria in autoimmune polyendocrinopathy-candidiasis-ectodermal dystrophy. JCI Insight. 2016;1:e88782. doi: 10.1172/jci.insight.88782. [DOI] [PMC free article] [PubMed] [Google Scholar]
- Ferré E.M.N., Break T.J., Burbelo P.D., Allgäuer M., Kleiner D.E., Jin D., Xu Z., Folio L.R., Mollura D.J., Swamydas M., et al. Lymphocyte-driven regional immunopathology in pneumonitis caused by impaired central immune tolerance. Sci. Transl. Med. 2019;11:eaav5597. doi: 10.1126/scitranslmed.aav5597. [DOI] [PMC free article] [PubMed] [Google Scholar]
- Fishman D., Kisand K., Hertel C., Rothe M., Remm A., Pihlap M., Adler P., Vilo J., Peet A., Meloni A., et al. Autoantibody repertoire in APECED patients targets two distinct subgroups of proteins. Front. Immunol. 2017;8:976. doi: 10.3389/fimmu.2017.00976. [DOI] [PMC free article] [PubMed] [Google Scholar]
- Gai S.A., Wittrup K.D. Yeast surface display for protein engineering and characterization. Curr. Opin. Struct. Biol. 2007;17:467–473. doi: 10.1016/j.sbi.2007.08.012. [DOI] [PMC free article] [PubMed] [Google Scholar]
- Gillissen M.A., de Jong G., Kedde M., Yasuda E., Levie S.E., Moiset G., Hensbergen P.J., Bakker A.Q., Wagner K., Villaudy J., et al. Patient-derived antibody recognizes a unique CD43 epitope expressed on all AML and has antileukemia activity in mice. Blood Adv. 2017;1:1551–1564. doi: 10.1182/bloodadvances.2017008342. [DOI] [PMC free article] [PubMed] [Google Scholar]
- Guo J., Xiang Y., Peng Y.-F., Huang H.-T., Lan Y., Wei Y.-S. The association of novel IL-33 polymorphisms with sIL-33 and risk of systemic lupus erythematosus. Mol. Immunol. 2016;77:1–7. doi: 10.1016/j.molimm.2016.07.001. [DOI] [PubMed] [Google Scholar]
- Gupta S., Tatouli I.P., Rosen L.B., Hasni S., Alevizos I., Manna Z.G., Rivera J., Jiang C., Siegel R.M., Holland S.M., et al. Distinct functions of autoantibodies against interferon in systemic lupus erythematosus: a comprehensive analysis of anticytokine autoantibodies in common rheumatic diseases. Arthritis Rheumatol. 2016;68:1677–1687. doi: 10.1002/art.39607. [DOI] [PMC free article] [PubMed] [Google Scholar]
- Haddon D.J., Diep V.K., Price J.V., Limb C., Utz P.J., Balboni I. Autoantigen microarrays reveal autoantibodies associated with proliferative nephritis and active disease in pediatric systemic lupus erythematosus. Arthritis Res. Ther. 2015;17:162. doi: 10.1186/s13075-015-0682-6. [DOI] [PMC free article] [PubMed] [Google Scholar]
- Hamilton S.R., Gerngross T.U. Glycosylation engineering in yeast: the advent of fully humanized yeast. Curr. Opin. Biotechnol. 2007;18:387–392. doi: 10.1016/j.copbio.2007.09.001. [DOI] [PubMed] [Google Scholar]
- Heckl D., Kowalczyk M.S., Yudovich D., Belizaire R., Puram R.V., McConkey M.E., Thielke A., Aster J.C., Regev A., Ebert B.L. Generation of mouse models of myeloid malignancy with combinatorial genetic lesions using CRISPR-Cas9 genome editing. Nat. Biotechnol. 2014;32:941–946. doi: 10.1038/nbt.2951. [DOI] [PMC free article] [PubMed] [Google Scholar]
- Herscovics A., Orlean P. Glycoprotein biosynthesis in yeast. FASEB J. 1993;7:540–550. doi: 10.1096/fasebj.7.6.8472892. [DOI] [PubMed] [Google Scholar]
- Ho C.C.M., Chhabra A., Starkl P., Schnorr P.-J., Wilmes S., Moraga I., Kwon H.-S., Gaudenzio N., Sibilano R., Wehrman T.S., et al. Decoupling the functional pleiotropy of stem cell factor by tuning c-kit signaling. Cell. 2017;168:1041–1052.e18. doi: 10.1016/j.cell.2017.02.011. [DOI] [PMC free article] [PubMed] [Google Scholar]
- Howe H.S., Thong B.Y.H., Kong K.O., Chng H.H., Lian T.Y., Chia F.L., Tay K.S.S., Lau T.C., Law W.G., Koh E.T., et al. Associations of B cell-activating factor (BAFF) and anti-BAFF autoantibodies with disease activity in multi-ethnic Asian systemic lupus erythematosus patients in Singapore. Clin. Exp. Immunol. 2017;189:298–303. doi: 10.1111/cei.12975. [DOI] [PMC free article] [PubMed] [Google Scholar]
- Jeong M.-Y., Rutter J., Chou D.H.-C. Display of single-chain insulin-like peptides on a yeast surface. Biochemistry. 2019;58:182–188. doi: 10.1021/acs.biochem.8b01094. [DOI] [PMC free article] [PubMed] [Google Scholar]
- Jin M., Song G., Carman C.V., Kim Y.-S., Astrof N.S., Shimaoka M., Wittrup D.K., Springer T.A. Directed evolution to probe protein allostery and integrin I domains of 200,000-fold higher affinity. Proc. Natl. Acad. Sci. U S A. 2006;103:5758–5763. doi: 10.1073/pnas.0601164103. [DOI] [PMC free article] [PubMed] [Google Scholar]
- Kamath K., Reifert J., Johnston T., Gable C., Pantazes R.J., Rivera H.N., McAuliffe I., Handali S., Daugherty P.S. Antibody epitope repertoire analysis enables rapid antigen discovery and multiplex serology. Sci. Rep. 2020;10:5294. doi: 10.1038/s41598-020-62256-9. [DOI] [PMC free article] [PubMed] [Google Scholar]
- Kazarian M., Laird-Offringa I.A. Small-cell lung cancer-associated autoantibodies: potential applications to cancer diagnosis, early detection, and therapy. Mol. Cancer. 2011;10:33. doi: 10.1186/1476-4598-10-33. [DOI] [PMC free article] [PubMed] [Google Scholar]
- Kieke M.C., Shusta E.V., Boder E.T., Teyton L., Wittrup K.D., Kranz D.M. Selection of functional T cell receptor mutants from a yeast surface-display library. Proc. Natl. Acad. Sci. U S A. 1999;96:5651–5656. doi: 10.1073/pnas.96.10.5651. [DOI] [PMC free article] [PubMed] [Google Scholar]
- Kisand K., Bøe Wolff A.S., Podkrajsek K.T., Tserel L., Link M., Kisand K.V., Ersvaer E., Perheentupa J., Erichsen M.M., Bratanic N., et al. Chronic mucocutaneous candidiasis in APECED or thymoma patients correlates with autoimmunity to Th17-associated cytokines. J. Exp. Med. 2010;207:299–308. doi: 10.1084/jem.20091669. [DOI] [PMC free article] [PubMed] [Google Scholar]
- Landegren N., Sharon D., Freyhult E., Hallgren Å., Eriksson D., Edqvist P.-H., Bensing S., Wahlberg J., Nelson L.M., Gustafsson J., et al. Proteome-wide survey of the autoimmune target repertoire in autoimmune polyendocrine syndrome type 1. Sci. Rep. 2016;6:20104. doi: 10.1038/srep20104. [DOI] [PMC free article] [PubMed] [Google Scholar]
- Larman H.B., Zhao Z., Laserson U., Li M.Z., Ciccia A., Gakidis M.A.M., Church G.M., Kesari S., Leproust E.M., Solimini N.L., et al. Autoantigen discovery with a synthetic human peptidome. Nat. Biotechnol. 2011;29:535–541. doi: 10.1038/nbt.1856. [DOI] [PMC free article] [PubMed] [Google Scholar]
- Larman H.B., Laserson U., Querol L., Verhaeghen K., Solimini N.L., Xu G.J., Klarenbeek P.L., Church G.M., Hafler D.A., Plenge R.M., et al. PhIP-Seq characterization of autoantibodies from patients with multiple sclerosis, type 1 diabetes and rheumatoid arthritis. J. Autoimmun. 2013;43:1–9. doi: 10.1016/j.jaut.2013.01.013. [DOI] [PMC free article] [PubMed] [Google Scholar]
- Laver W.G., Air G.M., Webster R.G., Smith-Gill S.J. Epitopes on protein antigens: misconceptions and realities. Cell. 1990;61:553–556. doi: 10.1016/0092-8674(90)90464-p. [DOI] [PubMed] [Google Scholar]
- Leslie R.D., Palmer J., Schloot N.C., Lernmark A. Diabetes at the crossroads: relevance of disease classification to pathophysiology and treatment. Diabetologia. 2016;59:13–20. doi: 10.1007/s00125-015-3789-z. [DOI] [PubMed] [Google Scholar]
- Levin A.M., Bates D.L., Ring A.M., Krieg C., Lin J.T., Su L., Moraga I., Raeber M.E., Bowman G.R., Novick P., et al. Exploiting a natural conformational switch to engineer an interleukin-2 “superkine. Nature. 2012;484:529–533. doi: 10.1038/nature10975. [DOI] [PMC free article] [PubMed] [Google Scholar]
- Li P., Lin W., Zheng X. IL-33 neutralization suppresses lupus disease in lupus-prone mice. Inflammation. 2014;37:824–832. doi: 10.1007/s10753-013-9802-0. [DOI] [PubMed] [Google Scholar]
- Lowe M.E. Structure and function of pancreatic lipase and colipase. Annu. Rev. Nutr. 1997;17:141–158. doi: 10.1146/annurev.nutr.17.1.141. [DOI] [PubMed] [Google Scholar]
- Ludwig R.J., Vanhoorelbeke K., Leypoldt F., Kaya Z., Bieber K., McLachlan S.M., Komorowski L., Luo J., Cabral-Marques O., Hammers C.M., et al. Mechanisms of autoantibody-induced pathology. Front. Immunol. 2017;8:603. doi: 10.3389/fimmu.2017.00603. [DOI] [PMC free article] [PubMed] [Google Scholar]
- Meager A., Visvalingam K., Peterson P., Möll K., Murumägi A., Krohn K., Eskelin P., Perheentupa J., Husebye E., Kadota Y., et al. Anti-interferon autoantibodies in autoimmune polyendocrinopathy syndrome type 1. PLoS Med. 2006;3:e289. doi: 10.1371/journal.pmed.0030289. [DOI] [PMC free article] [PubMed] [Google Scholar]
- Meier L.A., Binstadt B.A. The contribution of autoantibodies to inflammatory cardiovascular pathology. Front. Immunol. 2018;9:911. doi: 10.3389/fimmu.2018.00911. [DOI] [PMC free article] [PubMed] [Google Scholar]
- Meloni A., Furcas M., Cetani F., Marcocci C., Falorni A., Perniola R., Pura M., Bøe Wolff A.S., Husebye E.S., Lilic D., et al. Autoantibodies against type I interferons as an additional diagnostic criterion for autoimmune polyendocrine syndrome type I. J. Clin. Endocrinol. Metab. 2008;93:4389–4397. doi: 10.1210/jc.2008-0935. [DOI] [PubMed] [Google Scholar]
- Menconi F., Marcocci C., Marinò M. Diagnosis and classification of Graves’ disease. Autoimmun. Rev. 2014;13:398–402. doi: 10.1016/j.autrev.2014.01.013. [DOI] [PubMed] [Google Scholar]
- von Mensdorff-Pouilly S., Verstraeten A.A., Kenemans P., Snijdewint F.G., Kok A., Van Kamp G.J., Paul M.A., Van Diest P.J., Meijer S., Hilgers J. Survival in early breast cancer patients is favorably influenced by a natural humoral immune response to polymorphic epithelial mucin. J. Clin. Oncol. 2000;18:574–583. doi: 10.1200/JCO.2000.18.3.574. [DOI] [PubMed] [Google Scholar]
- Meyer S., Woodward M., Hertel C., Vlaicu P., Haque Y., Kärner J., Macagno A., Onuoha S.C., Fishman D., Peterson H., et al. AIRE-deficient patients harbor unique high-affinity disease-ameliorating autoantibodies. Cell. 2016;166:582–595. doi: 10.1016/j.cell.2016.06.024. [DOI] [PMC free article] [PubMed] [Google Scholar]
- Morales-Perez C.L., Noviello C.M., Hibbs R.E. Manipulation of subunit stoichiometry in heteromeric membrane proteins. Structure. 2016;24:797–805. doi: 10.1016/j.str.2016.03.004. [DOI] [PMC free article] [PubMed] [Google Scholar]
- Morimoto A.M., Flesher D.T., Yang J., Wolslegel K., Wang X., Brady A., Abbas A.R., Quarmby V., Wakshull E., Richardson B., et al. Association of endogenous anti-interferon-α autoantibodies with decreased interferon-pathway and disease activity in patients with systemic lupus erythematosus. Arthritis Rheum. 2011;63:2407–2415. doi: 10.1002/art.30399. [DOI] [PMC free article] [PubMed] [Google Scholar]
- Naparstek Y., Plotz P.H. The role of autoantibodies in autoimmune disease. Annu. Rev. Immunol. 1993;11:79–104. doi: 10.1146/annurev.iy.11.040193.000455. [DOI] [PubMed] [Google Scholar]
- Petri M., Orbai A.-M., Alarcón G.S., Gordon C., Merrill J.T., Fortin P.R., Bruce I.N., Isenberg D., Wallace D.J., Nived O., et al. Derivation and validation of the Systemic Lupus International Collaborating Clinics classification criteria for systemic lupus erythematosus. Arthritis Rheumatol. 2012;64(8):2677–2686. doi: 10.1002/art.34473. [DOI] [PMC free article] [PubMed] [Google Scholar]
- Picelli S., Björklund A.K., Reinius B., Sagasser S., Winberg G., Sandberg R. Tn5 transposase and tagmentation procedures for massively scaled sequencing projects. Genome Res. 2014;24:2033–2040. doi: 10.1101/gr.177881.114. [DOI] [PMC free article] [PubMed] [Google Scholar]
- Pisetsky D.S., Lipsky P.E. New insights into the role of antinuclear antibodies in systemic lupus erythematosus. Nat. Rev. Rheumatol. 2020;16:565–579. doi: 10.1038/s41584-020-0480-7. [DOI] [PMC free article] [PubMed] [Google Scholar]
- Price J.V., Haddon D.J., Kemmer D., Delepine G., Mandelbaum G., Jarrell J.A., Gupta R., Balboni I., Chakravarty E.F., Sokolove J., et al. Protein microarray analysis reveals BAFF-binding autoantibodies in systemic lupus erythematosus. J. Clin. Invest. 2013;123:5135–5145. doi: 10.1172/JCI70231. [DOI] [PMC free article] [PubMed] [Google Scholar]
- Puel A., Döffinger R., Natividad A., Chrabieh M., Barcenas-Morales G., Picard C., Cobat A., Ouachée-Chardin M., Toulon A., Bustamante J., et al. Autoantibodies against IL-17A, IL-17F, and IL-22 in patients with chronic mucocutaneous candidiasis and autoimmune polyendocrine syndrome type I. J. Exp. Med. 2010;207:291–297. doi: 10.1084/jem.20091983. [DOI] [PMC free article] [PubMed] [Google Scholar]
- Rhiel L., Krah S., Günther R., Becker S., Kolmar H., Hock B. REAL-select: full-length antibody display and library screening by surface capture on yeast cells. PLoS ONE. 2014;9:e114887. doi: 10.1371/journal.pone.0114887. [DOI] [PMC free article] [PubMed] [Google Scholar]
- Robinson M.D., McCarthy D.J., Smyth G.K. edgeR: a bioconductor package for differential expression analysis of digital gene expression data. Bioinformatics. 2010;26:139–140. doi: 10.1093/bioinformatics/btp616. [DOI] [PMC free article] [PubMed] [Google Scholar]
- Rose W.A., II, Okragly A.J., Hu N.N., Daniels M.R., Martin A.P., Koh Y.T., Kikly K., Benschop R.J. Interleukin-33 contributes toward loss of tolerance by promoting B-Cell-activating factor of the tumor-necrosis-factor family (BAFF)-dependent autoantibody production. Front. Immunol. 2018;9:2871. doi: 10.3389/fimmu.2018.02871. [DOI] [PMC free article] [PubMed] [Google Scholar]
- Schweickhardt R.L., Jiang X., Garone L.M., Brondyk W.H. Structure-expression relationship of tumor necrosis factor receptor mutants that increase expression∗. J. Biol. Chem. 2003;278:28961–28967. doi: 10.1074/jbc.M212019200. [DOI] [PubMed] [Google Scholar]
- Sjöwall C., Ernerudh J., Bengtsson A.A., Sturfelt G., Skogh T. Reduced anti-TNFalpha autoantibody levels coincide with flare in systemic lupus erythematosus. J. Autoimmun. 2004;22:315–323. doi: 10.1016/j.jaut.2004.02.003. [DOI] [PubMed] [Google Scholar]
- St-Pierre C., Trofimov A., Brochu S., Lemieux S., Perreault C. Differential Features of AIRE-Induced and AIRE-Independent Promiscuous Gene Expression in Thymic Epithelial Cells. The Journal of Immunology. 2015;195(2):498–506. doi: 10.4049/jimmunol.1500558. [DOI] [PubMed] [Google Scholar]
- Suzuki H., Ayabe T., Kamimura J., Kashiwagi H. Anti-IL-1 alpha autoantibodies in patients with rheumatic diseases and in healthy subjects. Clin. Exp. Immunol. 1991;85:407–412. doi: 10.1111/j.1365-2249.1991.tb05740.x. [DOI] [PMC free article] [PubMed] [Google Scholar]
- Tabuchi Y., Shimoda M., Kagara N., Naoi Y., Tanei T., Shimomura A., Shimazu K., Kim S.J., Noguchi S. Protective effect of naturally occurring anti-HER2 autoantibodies on breast cancer. Breast Cancer Res. Treat. 2016;157:55–63. doi: 10.1007/s10549-016-3801-4. [DOI] [PubMed] [Google Scholar]
- Tsokos G.C., Lo M.S., Costa Reis P., Sullivan K.E. New insights into the immunopathogenesis of systemic lupus erythematosus. Nat. Rev. Rheumatol. 2016;12:716–730. doi: 10.1038/nrrheum.2016.186. [DOI] [PubMed] [Google Scholar]
- Uchida M., Ooka S., Goto Y., Suzuki K., Fujimoto H., Ishimori K., Matsushita H., Takakuwa Y., Kawahata K. Anti-IL-10 antibody in systemic lupus erythematosus. Open Access Rheumatol. 2019;11:61–65. doi: 10.2147/OARRR.S191953. [DOI] [PMC free article] [PubMed] [Google Scholar]
- Vazquez S.E., Ferré E.M., Scheel D.W., Sunshine S., Miao B., Mandel-Brehm C., Quandt Z., Chan A.Y., Cheng M., German M., et al. Identification of novel, clinically correlated autoantigens in the monogenic autoimmune syndrome APS1 by proteome-wide PhIP-Seq. Elife. 2020;9:e55053. doi: 10.7554/eLife.55053. [DOI] [PMC free article] [PubMed] [Google Scholar]
- Wang E.Y., Mao T., Klein J., Dai Y., Huck J.D., Jaycox J.R., Liu F., Zhou T., Israelow B., Wong P., et al. Diverse functional autoantibodies in patients with COVID-19. Nature. 2021;595:283–288. doi: 10.1038/s41586-021-03631-y. [DOI] [PubMed] [Google Scholar]
- Warren J.T., Nelson C.A., Decker C.E., Zou W., Fremont D.H., Teitelbaum S.L. Manipulation of receptor oligomerization as a strategy to inhibit signaling by TNF superfamily members. Sci. Signal. 2014;7:ra80. doi: 10.1126/scisignal.2004948. [DOI] [PMC free article] [PubMed] [Google Scholar]
- Watanabe M., Uchida K., Nakagaki K., Trapnell B.C., Nakata K. High avidity cytokine autoantibodies in health and disease: pathogenesis and mechanisms. Cytokine Growth Factor Rev. 2010;21:263–273. doi: 10.1016/j.cytogfr.2010.03.003. [DOI] [PubMed] [Google Scholar]
- Weiskopf K., Ring A.M., Ho C.C.M., Volkmer J.-P., Levin A.M., Volkmer A.K., Ozkan E., Fernhoff N.B., van de Rijn M., Weissman I.L., et al. Engineered SIRPα variants as immunotherapeutic adjuvants to anticancer antibodies. Science. 2013;341:88–91. doi: 10.1126/science.1238856. [DOI] [PMC free article] [PubMed] [Google Scholar]
- Wolff A.S.B., Erichsen M.M., Meager A., Magitta N.F., Myhre A.G., Bollerslev J., Fougner K.J., Lima K., Knappskog P.M., Husebye E.S. Autoimmune polyendocrine syndrome type 1 in Norway: phenotypic variation, autoantibodies, and novel mutations in the autoimmune regulator gene. J. Clin. Endocrinol. Metab. 2007;92:595–603. doi: 10.1210/jc.2006-1873. [DOI] [PubMed] [Google Scholar]
- Xu G., Tasumi S., Pancer Z. Yeast surface display of lamprey variable lymphocyte receptors. Methods Mol. Biol. 2011;748:21–33. doi: 10.1007/978-1-61779-139-0_2. [DOI] [PMC free article] [PubMed] [Google Scholar]
- Yang Z., Liang Y., Xi W., Li C., Zhong R. Association of increased serum IL-33 levels with clinical and laboratory characteristics of systemic lupus erythematosus in Chinese population. Clin. Exp. Med. 2011;11:75–80. doi: 10.1007/s10238-010-0115-4. [DOI] [PubMed] [Google Scholar]
- Zhou T., Damsky W., Weizman O.-E., McGeary M.K., Hartmann K.P., Rosen C.E., Fischer S., Jackson R., Flavell R.A., Wang J., et al. IL-18BP is a secreted immune checkpoint and barrier to IL-18 immunotherapy. Nature. 2020;583:609–614. doi: 10.1038/s41586-020-2422-6. [DOI] [PMC free article] [PubMed] [Google Scholar]
Associated Data
This section collects any data citations, data availability statements, or supplementary materials included in this article.
Supplementary Materials
Data Availability Statement
-
•
All data reported in this paper will be shared by the lead contact upon request.
-
•
All original code has been deposited at Zenodo and is publicly available as of the date of publication (Zenodo: https://doi.org/10.5281/zenodo.5789092).
-
•
Any additional information required to reanalyze the data reported in this paper is available from the lead contact upon request.