

Abstract
Purpose
The Japan Society of Obstetrics and Gynecology records online annual cycle‐based information for assisted reproductive technology (ART). This report presents the characteristics and treatment outcomes of ART cycles registered during 2019.
Methods
The Japanese ART registry includes cycle‐specific information from 619 participating facilities, including treatment and pregnancy outcomes. Descriptive analyses were conducted for cycles registered during 2019.
Results
In 2019, 458 101 treatment cycles and 60 598 neonates were reported, both of which increased from 2018. The number of fresh cycles, including in vitro fertilization and intracytoplasmic sperm injection, decreased, while frozen‐thawed embryo transfer (ET) cycles increased. The mean maternal age was 37.9 years (standard deviation ± 4.7). Of 239 348 oocyte retrievals, 123 690 (51.7%) involved freeze‐all‐embryos cycles; fresh ET was performed in 41 831 cycles (a decreasing trend since 2015). In 2019, there were 211 597 frozen‐thawed ET cycles, resulting in 74 882 pregnancies and 54 168 neonates born. Single ET was performed in 82.6% of fresh transfers and 85.1% of frozen‐thawed cycles, with singleton live birth rates of 97.3% for both.
Conclusions
The number of fresh cycles decreased but frozen cycles increased in 2019. Single ET was performed in >80% of cases, and the proportion of babies born from frozen‐thawed ET increased.
Keywords: assisted reproductive technology, cryopreservation, intracytoplasmic sperm injections, Japan, registries
The number of fresh cycles decreased but frozen cycles increased in 2019. Single ET was performed in >80% of cases, and the proportion of babies born from frozen‐thawed ET increased.

1. INTRODUCTION
Since the first baby was born by in vitro fertilization (IVF) in 1983 in Japan, the number of assisted reproductive technology (ART) cycles has increased each year. According to the latest preliminary report from the International Committee Monitoring Assisted Reproductive Technologies in 2016, Japan was the second‐largest national user of ART globally, based on the total annual number of treatment cycles implemented. 1
Because the fertility rate in Japan has been decreasing steadily since the 1980s, 2 the contribution of ART to the overall birth rate in Japan is increasing. To evaluate the effectiveness and safety of ART and to understand the latest situations requiring the implementation of ART, it is essential to monitor national trends of use and outcomes of implemented ART treatments. The Japan Society of Obstetrics and Gynecology (JSOG) started an ART registry system in 1986 and launched an online registration system in 2007. From this, the cycle‐specific information of all ART treatment cycles performed in ART facilities in Japan can be assembled. The aim of this report was to describe the characteristics and treatment outcomes of registered ART cycles during 2019 in comparison with previous years. 3
2. MATERIALS AND METHODS
Since 2007, the JSOG has obtained cycle‐specific information from all ART treatment cycles of participating ART facilities, including clinics and hospitals. This information includes patient characteristics such as infertility diagnosis, information on the specific ART treatment (eg, IVF and intracytoplasmic sperm injection [ICSI]), and pregnancy and obstetric outcomes. Detailed information collected by this registry has been reported previously. 4 For ART cycles implemented between January 1 and December 31, 2019, the JSOG requested that online registration, including the input of all relevant information, be carried out by the end of November 2020.
Using the registry data from 2019, we performed a descriptive analysis to investigate the characteristics and treatment outcomes of registered cycles. First, the numbers of registered cycles, oocyte retrievals, embryo transfer (ET) cycles, freeze‐all‐embryo/oocyte cycle (henceforth “freeze‐all”) pregnancies, and neonates were compared with those in previous years for IVF, ICSI, and frozen‐thawed embryo transfer (FET) cycles. Second, the characteristics of registered cycles and pregnancy outcomes were described for fresh and FET cycles. Fresh cycles were stratified according to fertilization methods, including IVF, ICSI, and gamete intrafallopian transfer (GIFT), and included cycles with oocyte freezing based on medical indications. Treatment outcomes included clinical pregnancy (defined as confirmation of a gestational sac in utero), miscarriage (defined as spontaneous or unplanned loss of a fetus from the uterus before 22 weeks of gestation), live birth (defined as the delivery of at least one live neonate after 22 weeks of gestation), and multiple pregnancy rates. Pregnancy outcomes included ectopic pregnancy, heterotopic pregnancy, artificially induced abortion, stillbirth, and fetal reduction. Third, the treatment outcomes of pregnancy, live birth, miscarriage, and multiple pregnancy rates were analyzed according to patient age. Last, the treatment outcomes for FET cycles using frozen‐thawed oocytes were investigated.
3. RESULTS
In Japan, there were 624 registered ART facilities in 2019, of which 619 participated in the ART registration system. A total of 595 registered facilities implemented some form of ART treatment in 2019, while 24 did not. Trends in the numbers of registered cycles, oocyte retrievals, pregnancies, and neonates born by IVF, ICSI, and FET cycles since 1985 are shown in Table 1. In 2019, 458 101 cycles were registered and 60 598 neonate births were recorded. The total number of registered cycles for both IVF and ICSI had decreased from 2018 to 2019. The numbers of freeze‐all IVF and ICSI cycles increased in 2019, and the number of neonates born was 2974 for IVF‐ET cycles and 3433 for ICSI cycles, both of which were decreased from the previous year. In contrast, the number of FET cycles has increased continuously since the late 1980s; in 2019, there were 215 203 cycles registered (a 5.8% increase from 2018), resulting in 74 911 pregnancies and 54 188 neonates born.
TABLE 1.
Trends in numbers of registered cycles, egg retrievals, pregnancy, and neonate births categorized by IVF, ICSI, and frozen‐thawed embryo transfer cycles in Japan (1985–2019)
| Year | Fresh cycles | FET cycles c | ||||||||||||||
|---|---|---|---|---|---|---|---|---|---|---|---|---|---|---|---|---|
| IVF a | ICSI b | |||||||||||||||
| No. of registered cycles | No. of egg retrievals | No. of freeze‐all cycles | No. of ET cycles | No. of cycles with pregnancy | No. of neonates | No. of registered cycles | No. of egg retrievals | No. of freeze‐all cycles | No. of ET cycles | No. of cycles with pregnancy | No. of neonates | No. of registered cycles | No. of ET cycles | No. of cycles with pregnancy | No. of neonates | |
| 1985 | 1195 | 1195 | 862 | 64 | 27 | |||||||||||
| 1986 | 752 | 752 | 556 | 56 | 16 | |||||||||||
| 1987 | 1503 | 1503 | 1070 | 135 | 54 | |||||||||||
| 1988 | 1702 | 1702 | 1665 | 257 | 114 | |||||||||||
| 1989 | 4218 | 3890 | 2968 | 580 | 446 | 184 | 92 | 7 | 3 | |||||||
| 1990 | 7405 | 6892 | 5361 | 1178 | 1031 | 160 | 153 | 17 | 17 | |||||||
| 1991 | 11 177 | 10 581 | 8473 | 2015 | 1661 | 369 | 352 | 57 | 39 | |||||||
| 1992 | 17 404 | 16 381 | 12 250 | 2702 | 2525 | 963 | 936 | 524 | 42 | 35 | 553 | 530 | 79 | 66 | ||
| 1993 | 21 287 | 20 345 | 15 565 | 3730 | 3334 | 2608 | 2447 | 1271 | 176 | 149 | 681 | 597 | 86 | 71 | ||
| 1994 | 25 157 | 24 033 | 18 690 | 4069 | 3734 | 5510 | 5339 | 4114 | 759 | 698 | 1303 | 1112 | 179 | 144 | ||
| 1995 | 26 648 | 24 694 | 18 905 | 4246 | 3810 | 9820 | 9054 | 7722 | 1732 | 1579 | 1682 | 1426 | 323 | 298 | ||
| 1996 | 27 338 | 26 385 | 21 492 | 4818 | 4436 | 13 438 | 13 044 | 11 269 | 2799 | 2588 | 2900 | 2676 | 449 | 386 | ||
| 1997 | 32 247 | 30 733 | 24 768 | 5730 | 5060 | 16 573 | 16 376 | 14 275 | 3495 | 3249 | 5208 | 4958 | 1086 | 902 | ||
| 1998 | 34 929 | 33 670 | 27 436 | 6255 | 5851 | 18 657 | 18 266 | 15 505 | 3952 | 3701 | 8132 | 7643 | 1748 | 1567 | ||
| 1999 | 36 085 | 34 290 | 27 455 | 6812 | 5870 | 22 984 | 22 350 | 18 592 | 4702 | 4247 | 9950 | 9093 | 2198 | 1812 | ||
| 2000 | 31 334 | 29 907 | 24 447 | 6328 | 5447 | 26 712 | 25 794 | 21 067 | 5240 | 4582 | 11 653 | 10 719 | 2660 | 2245 | ||
| 2001 | 32 676 | 31 051 | 25 143 | 6749 | 5829 | 30 369 | 29 309 | 23 058 | 5924 | 4862 | 13 034 | 11 888 | 3080 | 2467 | ||
| 2002 | 34 953 | 33 849 | 26 854 | 7767 | 6443 | 34 824 | 33 823 | 25 866 | 6775 | 5486 | 15 887 | 14 759 | 4094 | 3299 | ||
| 2003 | 38 575 | 36 480 | 28 214 | 8336 | 6608 | 38 871 | 36 663 | 27 895 | 7506 | 5994 | 24 459 | 19 641 | 6205 | 4798 | ||
| 2004 | 41 619 | 39 656 | 29 090 | 8542 | 6709 | 44 698 | 43 628 | 29 946 | 7768 | 5921 | 30 287 | 24 422 | 7606 | 5538 | ||
| 2005 | 42 822 | 40 471 | 29 337 | 8893 | 6706 | 47 579 | 45 388 | 30 983 | 8019 | 5864 | 35 069 | 28 743 | 9396 | 6542 | ||
| 2006 | 44 778 | 42 248 | 29 440 | 8509 | 6256 | 52 539 | 49 854 | 32 509 | 7904 | 5401 | 42 171 | 35 804 | 11 798 | 7930 | ||
| 2007 | 53 873 | 52 165 | 7626 | 28 228 | 7416 | 5144 | 61 813 | 60 294 | 11 541 | 34 032 | 7784 | 5194 | 45 478 | 43 589 | 13 965 | 9257 |
| 2008 | 59 148 | 57 217 | 10 139 | 29 124 | 6897 | 4664 | 71 350 | 69 864 | 15 390 | 34 425 | 7017 | 4615 | 60 115 | 57 846 | 18 597 | 12 425 |
| 2009 | 63 083 | 60 754 | 11 800 | 28 559 | 6891 | 5046 | 76 790 | 75 340 | 19 046 | 35 167 | 7330 | 5180 | 73 927 | 71 367 | 23 216 | 16 454 |
| 2010 | 67 714 | 64 966 | 13 843 | 27 905 | 6556 | 4657 | 90 677 | 88 822 | 24 379 | 37 172 | 7699 | 5277 | 83 770 | 81 300 | 27 382 | 19 011 |
| 2011 | 71 422 | 68 651 | 16 202 | 27 284 | 6341 | 4546 | 10 2473 | 10 0518 | 30 773 | 38 098 | 7601 | 5415 | 95 764 | 92 782 | 31 721 | 22 465 |
| 2012 | 82 108 | 79 434 | 20 627 | 29 693 | 6703 | 4740 | 12 5229 | 12 2962 | 41 943 | 40 829 | 7947 | 5498 | 119 089 | 116 176 | 39 106 | 27 715 |
| 2013 | 89 950 | 87 104 | 25 085 | 30 164 | 6817 | 4776 | 13 4871 | 13 4871 | 49 316 | 41 150 | 8027 | 5630 | 14 1335 | 138 249 | 45 392 | 32 148 |
| 2014 | 92 269 | 89 397 | 27 624 | 30 414 | 6970 | 5025 | 14 4247 | 141 888 | 55 851 | 41 437 | 8122 | 5702 | 157 229 | 153 977 | 514 58 | 36 595 |
| 2015 | 93 614 | 91 079 | 30 498 | 28 858 | 6478 | 4629 | 155 797 | 153 639 | 63 660 | 41 396 | 8169 | 5761 | 174 740 | 171 495 | 56 888 | 40 611 |
| 2016 | 94 566 | 92 185 | 34 188 | 26 182 | 5903 | 4266 | 161 262 | 159 214 | 70 387 | 38 315 | 7324 | 5166 | 191 962 | 188 338 | 62 749 | 44 678 |
| 2017 | 91 516 | 89 447 | 36 441 | 22 423 | 5182 | 3731 | 157 709 | 155 758 | 74 200 | 33 297 | 6757 | 4826 | 198 985 | 195 559 | 67 255 | 48 060 |
| 2018 | 92 552 | 90 376 | 38 882 | 20 894 | 4755 | 3402 | 158 859 | 157 026 | 79 496 | 29 569 | 5886 | 4194 | 203 482 | 200 050 | 693 95 | 49 383 |
| 2019 | 88 074 | 86 334 | 40 561 | 17 341 | 4002 | 2977 | 154 824 | 153 014 | 83 129 | 24 490 | 4789 | 3433 | 215 203 | 211 758 | 74 911 | 54 188 |
Abbreviations: ET, embryo transfer; FET, frozen‐thawed embryo transfer; ICSI, intracytoplasmic sperm injection; IVF, in vitro fertilization.
Including gamete intrafallopian transfer.
Including split‐ICSI cycles.
Including cycles using frozen‐thawed oocyte.
The distribution of patient age in the total number of registered cycles, cycles with ET, cycles leading to pregnancy, and cycles leading to live births is shown in Figure 1. The mean patient age for registered cycles was 37.9 years (standard deviation [SD] ± 4.7), and 40.7% of registered cycles were for women in their 40s or older; the mean age for pregnancy and live birth cycles was 35.9 years (SD ± 4.2) and 35.4 years (SD ± 4.0), respectively.
FIGURE 1.
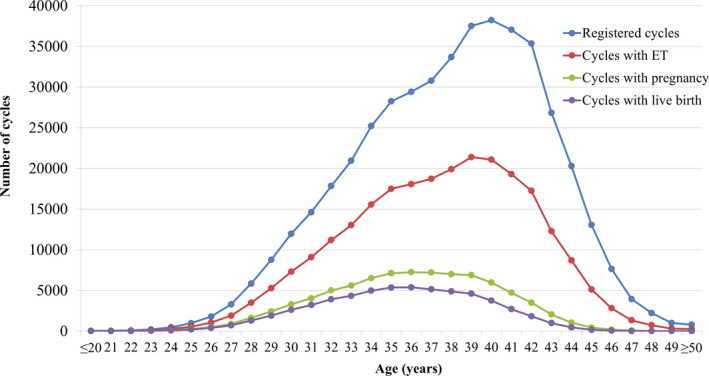
Distribution of maternal age from all registered cycles, cycles for ET, cycles leading to pregnancy, and cycles leading to live births in 2019. Adapted from the Japan Society of Obstetrics and Gynecology ART Databook 2019 (http://plaza.umin.ac.jp/~jsog‐art/2019data_202107.pdf). ET, embryo transfer
The detailed characteristics and treatment outcomes of registered fresh cycles are shown in Table 2. There were 82 908 registered IVF cycles, 28 498 split‐ICSI cycles, 124 035 ICSI cycles using ejaculated spermatozoa, 2291 ICSI cycles using testicular sperm extraction (TESE), 14 GIFT cycles, 723 cycles for oocyte freezing based on medical indications, and 4429 other cycles. Of the 239 348 cycles with oocyte retrieval, 123 690 (51.7%) were freeze‐all cycles. The pregnancy rate per ET cycle was 23.1% for IVF and 18.6% for ICSI using ejaculated spermatozoa. Single ET was performed at a rate of 82.6%, with a pregnancy rate of 21.6%. Live birth rates per ET were 16.7% for IVF, 18.4% for split‐ICSI, 12.9% for ICSI using ejaculated spermatozoa, and 7.8% for ICSI with TESE. The singleton pregnancy rate and live birth rate were both 97.3%. Of the 723 cycles for oocyte freezing based on medical indications, 717 oocyte retrievals were conducted, of which 605 cycles included the successful freezing of oocytes.
TABLE 2.
Characteristics and treatment outcomes of registered fresh cycles in assisted reproductive technology in Japan, 2019
| Variables | IVF | Split | ICSI | GIFT | Frozen oocyte | Other a | Total | |
|---|---|---|---|---|---|---|---|---|
| Ejaculated sperm | TESE | |||||||
| No. of registered cycles | 82 908 | 28 498 | 124 035 | 2291 | 14 | 723 | 4429 | 242 898 |
| No. of egg retrievals | 81 293 | 28 091 | 122 635 | 2288 | 14 | 717 | 4310 | 239 348 |
| No. of fresh ET cycles | 16 871 | 3830 | 20 197 | 463 | 14 | 0 | 456 | 418 31 |
| No. of freeze‐all cycles | 38 403 | 21 026 | 60 844 | 1259 | 0 | 605 | 1553 | 123 690 |
| No. of cycles with pregnancy | 3900 | 967 | 3766 | 56 | 3 | 0 | 99 | 8791 |
| Pregnancy rate per ET | 23.1% | 25.3% | 18.6% | 12.1% | 21.4% | ‐ | 21.7% | 21.0% |
| Pregnancy rate per egg retrieval | 4.8% | 3.4% | 3.1% | 2.5% | 21.4% | ‐ | 2.3% | 3.7% |
| Pregnancy rate per egg retrieval excluding freeze‐all cycles | 9.1% | 13.7% | 6.1% | 5.4% | 21.4% | ‐ | 3.6% | 7.6% |
| SET cycles | 14 319 | 3284 | 16 216 | 309 | 1 | ‐ | 411 | 34 540 |
| Pregnancy following SET cycles | 3386 | 851 | 3088 | 47 | 0 | ‐ | 92 | 7464 |
| Rate of SET cycles | 84.9% | 85.7% | 80.3% | 66.7% | 7.1% | ‐ | 90.1% | 82.6% |
| Pregnancy rate following SET cycles | 23.7% | 25.9% | 19.0% | 15.2% | 0.0% | ‐ | 22.4% | 21.6% |
| Miscarriages | 901 | 236 | 1010 | 17 | 0 | ‐ | 24 | 2188 |
| Miscarriage rate per pregnancy | 23.1% | 24.4% | 26.8% | 30.4% | 0.0% | ‐ | 24.2% | 24.9% |
| Singleton pregnancies b | 3686 | 931 | 3546 | 50 | 2 | ‐ | 94 | 8309 |
| Multiple pregnancies b | 98 | 23 | 106 | 2 | 1 | ‐ | 2 | 232 |
| Twin pregnancies | 97 | 21 | 105 | 2 | 0 | ‐ | 2 | 227 |
| Triplet pregnancies | 1 | 2 | 1 | 0 | 1 | ‐ | 0 | 5 |
| Quadruplet pregnancies | 0 | 0 | 0 | 0 | 0 | ‐ | 0 | 0 |
| Multiple pregnancy rate | 2.5% | 2.4% | 2.8% | 3.6% | 33.3% | ‐ | 2.0% | 2.6% |
| Live births | 2821 | 703 | 2605 | 36 | 3 | ‐ | 71 | 6239 |
| Live birth rate per ET | 16.7% | 18.4% | 12.9% | 7.8% | 21.4% | ‐ | 15.6% | 14.9% |
| Total no. of neonates | 2901 | 715 | 2682 | 36 | 4 | ‐ | 72 | 6410 |
| Singleton live births | 2742 | 691 | 2528 | 36 | 2 | ‐ | 70 | 6069 |
| Twin live births | 78 | 12 | 77 | 0 | 1 | ‐ | 1 | 169 |
| Triplet live births | 1 | 0 | 0 | 0 | 0 | ‐ | 0 | 1 |
| Quadruplet live births | 0 | 0 | 0 | 0 | 0 | ‐ | 0 | 0 |
| Pregnancy outcomes | ‐ | |||||||
| Ectopic pregnancies | 40 | 10 | 61 | 1 | 0 | ‐ | 1 | 113 |
| Heterotopic pregnancies | 2 | 0 | 0 | 0 | 0 | ‐ | 0 | 2 |
| Artificial abortions | 24 | 3 | 17 | 0 | 0 | ‐ | 0 | 44 |
| Still births | 12 | 2 | 13 | 0 | 0 | ‐ | 0 | 27 |
| Fetal reductions | 1 | 1 | 1 | 0 | 1 | ‐ | 0 | 4 |
| Cycles with unknown pregnancy outcomes | 42 | 11 | 42 | 1 | 0 | ‐ | 2 | 98 |
Abbreviations: ET, embryo transfer; GIFT, gamete intrafallopian transfer; ICSI, intracytoplasmic sperm injection; in vitro fertilization; IVF; SET, single embryo transfer; TESE, testicular sperm extraction; ZIFT, zygote intrafallopian transfer.
Others include ZIFT.
Singleton, twin, triplet, and quadruplet pregnancies were defined according to the number of gestational sacs in utero.
The characteristics and treatment outcomes of FET cycles are shown in Table 3. There was a total of 214 938 registered cycles in 2019, of which FET was performed in 211 597, leading to 74 882 pregnancies (pregnancy rate per FET = 35.4%). The miscarriage rate per pregnancy was 25.4%, resulting in a 24.9% live birth rate per ET. Single ET was performed at a rate of 85.1%, and the singleton pregnancy and live birth rates were 97.1% and 97.3%, respectively.
TABLE 3.
Characteristics and treatment outcomes of frozen cycles in assisted reproductive technology in Japan, 2019
| Variables | FET | Other a | Total |
|---|---|---|---|
| No. of registered cycles | 213 882 | 1056 | 214 938 |
| No. of FET | 210 656 | 941 | 211 597 |
| No. of cycles with pregnancy | 74 595 | 287 | 74 882 |
| Pregnancy rate per FET | 35.4% | 30.5% | 35.4% |
| SET cycles | 179 335 | 790 | 180 125 |
| Pregnancy following SET cycles | 65 249 | 256 | 65 505 |
| Rate of SET cycles | 85.1% | 84.0% | 85.1% |
| Pregnancy rate following SET cycles | 36.4% | 32.4% | 36.4% |
| Miscarriages | 18 957 | 68 | 19 025 |
| Miscarriage rate per pregnancy | 25.4% | 23.7% | 25.4% |
| Singleton pregnancies b | 71 088 | 278 | 71 366 |
| Multiple pregnancies b | 2160 | 4 | 2164 |
| Twin pregnancies | 2118 | 4 | 2122 |
| Triplet pregnancies | 40 | 0 | 40 |
| Quadruplet pregnancies | 2 | 0 | 2 |
| Multiple pregnancy rate | 2.9% | 1.4% | 2.9% |
| Live births | 52 513 | 214 | 52 727 |
| Live birth rate per FET | 24.9% | 22.7% | 24.9% |
| Total no. of neonates | 53 949 | 219 | 54 168 |
| Singleton live births | 51 084 | 209 | 51 293 |
| Twin live births | 1419 | 5 | 1424 |
| Triplet live births | 9 | 0 | 9 |
| Quadruplet live births | 0 | 0 | 0 |
| Pregnancy outcomes | |||
| Ectopic pregnancies | 398 | 0 | 398 |
| Intrauterine pregnancies coexisting with ectopic pregnancy | 10 | 0 | 10 |
| Artificial abortions | 363 | 2 | 365 |
| Still births | 196 | 0 | 196 |
| Fetal reductions | 18 | 0 | 18 |
| Cycles with unknown pregnancy outcomes | 1655 | 2 | 1657 |
Abbreviations: FET, frozen‐thawed embryo transfer; SET, single embryo transfer.
Including cycles using frozen‐thawed oocytes.
Singleton, twin, triplet, and quadruplet pregnancies were defined according to the number of gestational sacs in utero.
Treatment outcomes of registered cycles, including pregnancy, miscarriage, live birth, and multiple pregnancy rate, according to maternal age, are shown in Table 4. The pregnancy, live birth, and miscarriage rate according to maternal age are shown in Figure 2. The pregnancy rate per ET exceeded 40% up to a maternal age of 36 years; this rate gradually fell below 30% for women aged over 40 years and below 10% for women aged over 45 years. The miscarriage rate was below 20% for women aged less than 35 years, but gradually increased to 32.9% and 48.4% for those aged 40 and 43 years, respectively. The live birth rate per registered cycle was around 20% in women up to 33 years of age and decreased to 9.8% and 3.6% for women aged 40 and 43 years, respectively. The multiple pregnancy rate varied between 2% and 3% for most age groups (Table 4).
TABLE 4.
Treatment outcomes of registered cycles according to patient age in Japan, 2019
| Age (years) | No. of registered cycles | No. of ET cycles | Pregnancy | Multiple pregnancies a | Miscarriage | Live birth | Pregnancy rate per ET | Pregnancy rate per registered cycles | Live birth rate per registered cycles | Miscarriage rate per pregnancy | Multiple pregnancy rate a |
|---|---|---|---|---|---|---|---|---|---|---|---|
| ≤20 | 43 | 6 | 4 | 0 | 0 | 4 | 66.7% | 9.3% | 9.3% | 0.0% | 0.0% |
| 21 | 38 | 16 | 9 | 1 | 3 | 6 | 56.3% | 23.7% | 15.8% | 33.3% | 0.0% |
| 22 | 83 | 35 | 15 | 0 | 2 | 11 | 42.9% | 18.1% | 13.3% | 13.3% | 9.5% |
| 23 | 210 | 117 | 53 | 4 | 7 | 42 | 45.3% | 25.2% | 20.0% | 13.2% | 5.7% |
| 24 | 473 | 270 | 111 | 1 | 19 | 87 | 41.1% | 23.5% | 18.4% | 17.1% | 1.0% |
| 25 | 974 | 538 | 247 | 10 | 39 | 196 | 45.9% | 25.4% | 20.1% | 15.8% | 0.0% |
| 26 | 1788 | 1041 | 478 | 13 | 74 | 388 | 45.9% | 26.7% | 21.7% | 15.5% | 4.0% |
| 27 | 3288 | 1902 | 875 | 22 | 124 | 708 | 46.0% | 26.6% | 21.5% | 14.2% | 1.7% |
| 28 | 5844 | 3488 | 1614 | 41 | 247 | 1289 | 46.3% | 27.6% | 22.1% | 15.3% | 2.2% |
| 29 | 8751 | 5278 | 2411 | 58 | 410 | 1904 | 45.7% | 27.6% | 21.8% | 17.0% | 3.4% |
| 30 | 11 974 | 7298 | 3293 | 84 | 515 | 2616 | 45.1% | 27.5% | 21.8% | 15.6% | 3.0% |
| 31 | 14 616 | 9076 | 4028 | 108 | 664 | 3208 | 44.4% | 27.6% | 21.9% | 16.5% | 2.6% |
| 32 | 17 830 | 11 187 | 5000 | 143 | 891 | 3919 | 44.7% | 28.0% | 22.0% | 17.8% | 2.6% |
| 33 | 20 944 | 13 027 | 5598 | 129 | 1017 | 4341 | 43.0% | 26.7% | 20.7% | 18.2% | 2.6% |
| 34 | 25 210 | 15 566 | 6522 | 188 | 1259 | 4975 | 41.9% | 25.9% | 19.7% | 19.3% | 2.9% |
| 35 | 28 249 | 17 489 | 7105 | 226 | 1464 | 5356 | 40.6% | 25.2% | 19.0% | 20.6% | 3.2% |
| 36 | 29 414 | 18 078 | 7249 | 221 | 1571 | 5377 | 40.1% | 24.6% | 18.3% | 21.7% | 3.8% |
| 37 | 30 787 | 18 727 | 7201 | 229 | 1739 | 5139 | 38.5% | 23.4% | 16.7% | 24.1% | 3.0% |
| 38 | 33 672 | 19 907 | 7006 | 232 | 1825 | 4880 | 35.2% | 20.8% | 14.5% | 26.0% | 3.3% |
| 39 | 37 516 | 21 394 | 6879 | 217 | 2025 | 4605 | 32.2% | 18.3% | 12.3% | 29.4% | 3.0% |
| 40 | 38 221 | 21 075 | 5967 | 173 | 1966 | 3740 | 28.3% | 15.6% | 9.8% | 32.9% | 2.8% |
| 41 | 37 040 | 19 299 | 4719 | 133 | 1821 | 2694 | 24.5% | 12.7% | 7.3% | 38.6% | 2.8% |
| 42 | 35 349 | 17 243 | 3501 | 80 | 1541 | 1823 | 20.3% | 9.9% | 5.2% | 44.0% | 2.8% |
| 43 | 26 845 | 12 284 | 2050 | 47 | 992 | 979 | 16.7% | 7.6% | 3.6% | 48.4% | 3.0% |
| 44 | 20 291 | 8697 | 1043 | 20 | 554 | 453 | 12.0% | 5.1% | 2.2% | 53.1% | 3.1% |
| 45 | 13 066 | 5125 | 435 | 8 | 261 | 157 | 8.5% | 3.3% | 1.2% | 60.0% | 1.2% |
| 46 | 7651 | 2816 | 175 | 5 | 119 | 51 | 6.2% | 2.3% | 0.7% | 68.0% | 1.4% |
| 47 | 3938 | 1327 | 66 | 0 | 43 | 19 | 5.0% | 1.7% | 0.5% | 65.2% | 1.9% |
| 48 | 2217 | 723 | 25 | 1 | 16 | 8 | 3.5% | 1.1% | 0.4% | 64.0% | 6.3% |
| 49 | 991 | 313 | 11 | 2 | 7 | 4 | 3.5% | 1.1% | 0.4% | 63.6% | 0.0% |
| ≥50 | 788 | 251 | 12 | 0 | 5 | 7 | 4.8% | 1.5% | 0.9% | 41.7% | 0.0% |
Abbreviation: ET, embryo transfer.
Multiple pregnancies were defined according to the number of gestational sacs in utero.
FIGURE 2.

Pregnancy, live birth, and miscarriage rates according to patient age in all registered cycles in 2019. Adapted from the Japan Society of Obstetrics and Gynecology ART Databook 2019 (http://plaza.umin.ac.jp/~jsog‐art/2019data_202107.pdf). ET, embryo transfer
The treatment outcomes of cycles using frozen‐thawed oocytes are shown in Table 5. There were 161 FET cycles using frozen‐thawed oocytes in 2019, of which 29 cycles resulted in a pregnancy (pregnancy rate per FET = 18.0%). The miscarriage rate per pregnancy was 24.1%, resulting in a 12.4% live birth rate per ET.
TABLE 5.
Treatment outcomes of embryo transfers using frozen‐thawed oocytes in assisted reproductive technology in Japan, 2019
| Variables | Embryo transfers using frozen‐thawed oocyte |
|---|---|
| No. of registered cycles | 265 |
| No. of ET | 161 |
| No. of cycles with pregnancy | 29 |
| Pregnancy rate per ET | 18.0% |
| SET cycles | 117 |
| Pregnancy following SET cycles | 24 |
| Rate of SET cycles | 72.7% |
| Pregnancy rate following SET cycles | 20.5% |
| Miscarriages | 7 |
| Miscarriage rate per pregnancy | 24.1% |
| Singleton pregnancies a | 27 |
| Multiple pregnancies a | 0 |
| Twin pregnancies | 0 |
| Triplet pregnancies | 0 |
| Quadruplet pregnancies | 0 |
| Multiple pregnancy rate | 0.0% |
| Live births | 20 |
| Live birth rate per ET | 12.4% |
| Total number of neonates | 20 |
| Singleton live births | 20 |
| Twin live births | 0 |
| Triplet live births | 0 |
| Quadruplet live births | 0 |
| Pregnancy outcomes | |
| Ectopic pregnancies | 0 |
| Intrauterine pregnancies coexisting with ectopic pregnancy | 0 |
| Artificial abortions | 0 |
| Still births | 0 |
| Fetal reductions | 0 |
| Cycles with unknown pregnancy outcomes | 0 |
Abbreviations: ET, embryo transfer; SET, single embryo transfer.
Singleton, twin, triplet, and quadruplet pregnancies were defined according to the number of gestational sacs in utero.
4. DISCUSSION
In this descriptive study, we evaluated and reported on the main characteristics and treatment outcomes of ART cycles administered at 595 Japanese ART facilities during 2019. Moreover, we compared the number and types of ART treatments registered in 2019, including their outcomes, with previous years. The Japanese ART registry system is managed by the JSOG and is crucial for understanding and increasing the low fertility rate in Japan, as well as for evaluating the safety of ART techniques and understanding the latest trends regarding their implementation in Japan.
In 2019, 458 101 ART cycles were registered by the JSOG in Japan, and they resulted in the birth of 60 598 neonates. Both of these are higher than the reported numbers for 2018. 3 Compared with findings in 2018, 3 the number of fresh cycles, including IVF and ICSI, decreased in 2019. Freeze‐all cycles were the predominant reported cycle type; in 2019, 51.7% of cycles with oocyte retrieval for IVF and ICSI combined were freeze‐all cycles, whereas the percentage attributable to freeze‐all cycles in 2018 was 47.8%. Therefore, the number of freeze‐all cycles in 2019 was higher than the previous year, a trend that has been observed for the past 5 years. 3 , 4 , 5 , 6 , 7 Moreover, the number of registered IVF‐ET and ICSI cycles that resulted in a neonate birth in 2019 (2974 and 3433, respectively) was lower compared with the reported numbers of the previous year. 3 There was a 5.8% increase in FET cycles in 2019 compared with 2018, including a total of 215 203 cycles that resulted in 74 911 pregnancies and 54 188 neonates. Conversely, the single ET rate was 82.6% for fresh cycles and 85.1% for FET cycles, which continues the previously reported gradual increase in the use of these techniques. For fresh cycles, the singleton pregnancy and live birth rates each reached 97.3%, and for frozen cycles, the singleton pregnancy and live birth rates reached 97.1% and 97.3%, respectively, which are also similar values to those reported in 2018.
We analyzed the distribution of cycle type and outcome based on maternal age. The mean patient age for registered cycles in 2019 was 37.9 years (SD ± 4.7). Of all registered cycles in 2019, 40.7% were undertaken by women aged ≥40 years, which is similar to the percentage of women aged ≥40 years undergoing ART cycles in 2018 (41.8%). The rate of pregnancy was above 40% for women aged 36 years or younger undergoing ART; in women aged >36 years, the pregnancy rate with ART declined progressively with increasing age. Conversely, the rate of miscarriage remained <20% in women under 34 years of age undergoing ART, and the rate gradually increased with increasing age in women older than 34 years. However, the data indicated a miscarriage rate of 33.3% in women aged 21 years, which deviates from the abovementioned trend. Because the number of women receiving ART in this age group was very low (in 2019, 38 cycles were registered and 9 pregnancies were recorded), this rate is likely a result of random variation. In addition, live birth rates per cycle were approximately 20% in women aged 33 years or younger, and this gradually decreased with increasing age in women aged >33 years, down to 3.6% in patients who were 43 years old.
Over the past 40 years in Japan, the fertility rate has continuously declined. 2 This is a significant issue that has become a priority for the government in recent decades. Although several policies and countermeasures have been implemented by the government in Japan, these changes are not necessarily beneficial for all people. For instance, some policies have included increased assistance for childcare and additional support for a work–life balance; however, these are mostly targeted at two‐income households and are not available for single individuals who are not married or not in a relationship. Therefore, despite these measures, the fertility rate is still decreasing. Compared with a total fertility rate of 1.42 births per woman in 2018, 8 the fertility rate in 2019 was 1.36 births per woman. 9
In January 2021, several incentives and subsidies were put in place as part of a support program for couples receiving ART. This policy change included the removal of income limitations (previously, couples had to have an annual income of under 7 300 000 JPY to be eligible for support), an increase in the subsidy available per cycle (from 300 000 JPY for the first cycle and 150 000 JPY for each subsequent cycle to 300 000 JPY for each cycle), and an increase in the number of cycles available per woman/couple (from six cycles in total to six cycles per child for women aged under 40 years and three cycles per child for women aged 40–43 years). The existing age limitation for eligibility (age <43 years at the time of starting treatment) remained in place. 10 These subsidies are covered in part by the state and the implementing entities, such as the prefecture, ordinance‐designated city, or core city, and the project‐related procedures and treatments are carried out at designated clinics.
The Japanese government is planning to further expand ART provision to provide universal insurance coverage to couples with fertility issues who wish to undertake ART. The full details of the specific procedures, costs, and coverages are still under discussion at the Central Social Insurance Medical Council. 11 , 12 The Japan Society for Reproductive Medicine has prepared a guideline regarding the ART insurance coverage changes, which will be published in November 2021 in advance of the policy rollout in 2022. The potential impact of the coverage changes on the number of treatment cycles and the number of infants born from ART, as well as the health insurance costs, is unknown. Therefore, it is not clear whether the coverage will considerably increase the accessibility of ART. Government‐assisted health coverage programs for ART are currently available for eligible candidates in Israel, Canada, Denmark, and the UK 13 ; although outcome data from these programs are sparse, a recent report of the 5‐year government health coverage experience in Quebec compared with a non‐insured period showed a remarkable increase in the number of ART cycles performed during the insured period, despite increased cycle cancellation rates. 14 This shows that government funding for ART and/or subsidized ARTs may make fertility treatments more accessible to the public and will therefore have a positive overall socioeconomic impact. Whether the implementation of these programs will influence data collection or other aspects of the ART registry by the JSOG remains undetermined.
The JSOG recently completed a pilot study that investigated the effectiveness of preimplantation genetic testing for aneuploidy (PGT‐A) for improving the live birth rate and reducing miscarriage rates in specific populations. The specific population in this study included patients experiencing recurrent pregnancy loss (RPL) caused by an abnormal embryonic karyotype and patients experiencing recurrent implantation failure (RIF) or ART failure. The results of the pilot study showed that PGT‐A did not improve the number of live births or decrease the number of miscarriages in the RPL or RIF groups; however, it did improve the live birth rate per ET in both groups. 15 Thus, PGT‐A reduced the number of ETs required to achieve a similar number of live births compared with those not undergoing PGT‐A. The main study following this pilot is currently underway as a multicenter prospective study. Although the main results will not be available until 2022, the preliminary findings of the pilot study suggest that the forthcoming results may support the use of this screening method for detecting euploid embryos in specific populations in Japan. Although several studies and systematic reviews have been conducted on the effectiveness of PGT‐A for this purpose, 16 , 17 , 18 , 19 the results remain controversial. However, from a clinical standpoint, PGT‐A may be of particular benefit for women in their mid‐ or late‐30s to facilitate single ET and reduce RPL, RIF, and ART failure, and shorten time to pregnancy, 20 all of which are problems faced by this age group.
In the present study, we found that FET increased in frequency in 2019 compared with 2018, 3 which is consistent with the trend observed for FET cycles over the past 5 years in Japan. Interestingly, the decreasing trends in Japan regarding the use of fresh cycles are different to those observed in other Asia‐Pacific countries. For instance, in New Zealand and Australia, the trend indicates an increase in fresh cycles and a reduction in FET cycles in the last 5 years. 21 Therefore, it is possible that the total number of women receiving ART may be decreasing in Japan. Although fresh ET continues to be the major type of ART in Japan, there are several concerns regarding controlled ovarian stimulation (COS) for the endometrium, 22 which may result in lower pregnancy rates and poorer obstetric and perinatal outcomes compared with FET. The freeze‐all strategy is becoming more widely used in Japan because of several key factors, including an improvement in cryopreservation techniques, the advantages of delayed FET, fewer complications related to ovarian stimulation (ie, COS and ovarian hyperstimulation syndrome), development of new ovarian stimulation protocols such as progestin‐primed ovarian stimulation, and reports of significantly higher implantation, clinical pregnancy, and live birth rates with freeze‐all versus fresh cycles. 23 , 24 However, several studies have reported that the advantages of the freeze‐all strategy over fresh ET are highly dependent on the number of oocytes retrieved (threshold of >15 oocytes) and that in procedures with oocyte counts below this threshold, these advantages are insignificant. 23 , 24 , 25 Moreover, several researchers argue that the freeze‐all strategy should be reserved for specific patient populations, such as those with a risk of ovarian hyperstimulation syndrome and those with supra‐physiologic hormonal levels during the follicular phase of COS. 26 Moreover, it remains unclear whether this strategy is beneficial for patients with regular menstrual cycles. 26 , 27 , 28 , 29
This study has several strengths and limitations. The main strength of the Japanese ART registry system is that the registration of ART cases is mandatory in the designated ART facilities in Japan and the compliance rate is very high. Additionally, the reporting and recording of data are standardized, meaning cycle‐specific information is collected in the same way nationwide; thus, the risk of reporting bias is low. However, the collection of patient background data is not standardized or mandatory; therefore, the large amount of patient background data that was missing because of low reporting is a major limitation of this study. For instance, data on body mass index, the number of previous pregnancies, and parity were unavailable for some patients. Therefore, to improve the accuracy of analyses on these data, the reporting of such variables should be encouraged. Furthermore, other background information, such as the presence of relevant patient conditions (eg, polycystic ovarian syndrome and anovulation) and treatment history, should be collected, as these may have a significant impact on the outcome of ART. These types of information will be included in the registries from 2022. Because the collection of data for the registry was carried out per cycle, we were not able to distinguish whether a person received multiple treatment cycles. Thus, the information required to calculate the cumulative live birth rate or pregnancy rate per patient receiving ART treatment is currently unavailable, and this is a significant limitation of the registry.
In conclusion, the present analysis of the ART registry showed that the overall number of ART cycles and neonates born increased in 2019 compared with 2018, and this increase was largely because of an increased number of freeze‐all cycles in 2019 (a 5.8% increase from 2018). The rate of single ETs, both fresh and frozen, also increased in 2019, but the increase was most striking for FET cycles. For both fresh and FET cycles, the rates of singleton pregnancies and live births were over 97%. In summary, the trends for ART use and outcomes in Japan in 2019 were similar to those of the previous year. It will be interesting to compare these results with the forthcoming results after the implementation of the Japanese ART subsidy programs and the government health coverage for ART.
CONFLICT OF INTEREST
There is no conflict of interest regarding the publication of this study.
HUMAN RIGHTS STATEMENTS AND INFORMED CONSENT
All procedures were performed in accordance with the ethical standards of the relevant committees on human experimentation (institutional and national) and the Helsinki Declaration of 1964 and its later amendments.
ANIMAL RIGHTS
This report does not contain any studies performed by any of the authors that included animal participants.
APPROVAL BY ETHICS COMMITTEE
Not applicable.
CLINICAL TRIAL REGISTRY
Not applicable.
ACKNOWLEDGMENTS
We thank all of the registered facilities for their cooperation in providing their responses. We would also like to encourage these facilities to continue promoting the use of the online registry system and assisting us with our research. We thank Edanz (https://jp.edanz.com/ac) for providing medical writing support.
Katagiri Y, Jwa SC, Kuwahara A, et al. Assisted reproductive technology in Japan: A summary report for 2019 by the Ethics Committee of the Japan Society of Obstetrics and Gynecology. Reprod Med Biol. 2021;21:e12434. doi: 10.1002/rmb2.12434
REFERENCES
- 1. Adamson D, Zegers F, de Mouzon J, et al. International Committee Monitoring Assisted Reproductive Technologies: ICMART Preliminary World Report 2016. 7 Jul 2020, Copenhagen, Denmark. https://secureservercdn.net/198.71.233.47/3nz.654.myftpupload.com/wp‐content/uploads/ICMART‐ESHRE‐WR2016‐FINAL‐20200901.pdf Accessed 7 Dec 2021. [Google Scholar]
- 2. Matsuda S. In: Matsuda S, ed. Low Fertility in Japan, South Korea, and Singapore: Population Policies and Their Effectiveness. Springer Nature; 2020:1‐14. [Google Scholar]
- 3. Ishihara O, Jwa SC, Kuwahara A, et al. Assisted reproductive technology in Japan: a summary report for 2018 by the Ethics Committee of the Japan Society of Obstetrics and Gynecology. Reprod Med Biol. 2021;20:3‐12. [DOI] [PMC free article] [PubMed] [Google Scholar]
- 4. Irahara M, Kuwahara A, Iwasa T, et al. Assisted reproductive technology in Japan: a summary report of 1992–2014 by the Ethics Committee, Japan Society of Obstetrics and Gynecology. Reprod Med Biol. 2017;16:126‐132. [DOI] [PMC free article] [PubMed] [Google Scholar]
- 5. Saito H, Jwa SC, Kuwahara A, et al. Assisted reproductive technology in Japan: a summary report for 2015 by The Ethics Committee of The Japan Society of Obstetrics and Gynecology. Reprod Med Biol. 2017;17:20‐28. [DOI] [PMC free article] [PubMed] [Google Scholar]
- 6. Ishihara O, Jwa SC, Kuwahara A, et al. Assisted reproductive technology in Japan: a summary report for 2016 by the Ethics Committee of the Japan Society of Obstetrics and Gynecology. Reprod Med Biol. 2018;18:7‐16. [DOI] [PMC free article] [PubMed] [Google Scholar]
- 7. Ishihara O, Jwa SC, Kuwahara A, et al. Assisted reproductive technology in Japan: a summary report for 2017 by the Ethics Committee of the Japan Society of Obstetrics and Gynecology. Reprod Med Biol. 2019;19:3‐12. [DOI] [PMC free article] [PubMed] [Google Scholar]
- 8. Ministry of Health Labour and Welfare . Summary of Vital Statistics in 2018 Tokyo; 2019. https://www.mhlw.go.jp/toukei/saikin/hw/jinkou/kakutei18/dl/02_kek.pdf Accessed 7 Dec 2021 [Japanese]. [Google Scholar]
- 9. Ministry of Health Labour and Welfare . Summary of Vital Statistics in 2019 Tokyo; 2020. https://www.mhlw.go.jp/toukei/saikin/hw/jinkou/kakutei19/dl/02_kek.pdf Accessed 20 October 2021 [Japanese]. [Google Scholar]
- 10. Ministry of Health, Labour and Welfare . Expansion of the Specific Treatment Support Project for Those Suffering from Infertility; 2021. https://www.mhlw.go.jp/stf/seisakunitsuite/bunya/0000047270.html Accessed 20 October 2021 [Japanese]. [Google Scholar]
- 11. Ministry of Health, Labour and Welfare . Insurance Coverage for Infertility Treatment; 2021. https://www.mhlw.go.jp/content/12404000/000718601.pdf Accessed 20 October 2021 [Japanese]. [Google Scholar]
- 12. Japan Society for Reproductive Medicine . Reproductive Medicine Guidelines; 2021. http://www.jsrm.or.jp/publications/pub_guidelines.html Accessed 20 October 2021 [Japanese] [Google Scholar]
- 13. Hodgetts K, Hiller JE, Street JM, et al. Disinvestment policy and the public funding of assisted reproductive technologies: outcomes of deliberative engagements with three key stakeholder groups. BMC Health Serv Res. 2014;14:204. [DOI] [PMC free article] [PubMed] [Google Scholar]
- 14. Bissonnette F, Phillips S, Sampalis J, et al. Impact of government health coverage for ART: the results of a 5‐year experience in Quebec. Reprod Biomed Soc Online. 2019;8:32‐37. [DOI] [PMC free article] [PubMed] [Google Scholar]
- 15. Sato T, Sugiura‐Ogasawara M, Ozawa F, et al. Preimplantation genetic testing for aneuploidy: a comparison of live birth rates in patients with recurrent pregnancy loss due to embryonic aneuploidy or recurrent implantation failure. Hum Reprod. 2020;35:255. [DOI] [PubMed] [Google Scholar]
- 16. Lee E, Illingworth P, Wilton L, Chambers GM. The clinical effectiveness of preimplantation genetic diagnosis for aneuploidy in all 24 chromosomes (PGD‐A): systematic review. Hum Reprod. 2015;30:473‐483. [DOI] [PubMed] [Google Scholar]
- 17. Hou W, Xu Y, Li R, et al. Role of aneuploidy screening in preimplantation genetic testing for monogenic diseases in young women. Fertil Steril. 2019;111:928‐935. [DOI] [PubMed] [Google Scholar]
- 18. Lee E, Chambers GM, Hale L, Illingworth P, Wilton L. Assisted reproductive technology (ART) cumulative live birth rates following preimplantation genetic diagnosis for aneuploidy (PGD‐A) or morphological assessment of embryos: a cohort analysis. Aust N Z J Obstet Gynaecol. 2018;58:525‐532. [DOI] [PubMed] [Google Scholar]
- 19. Chang J, Boulet SL, Jeng G, Flowers L, Kissin DM. Outcomes of in vitro fertilization with preimplantation genetic diagnosis: an analysis of the United States Assisted Reproductive Technology Surveillance Data, 2011–2012. Fertil Steril. 2016;105:394‐400. [DOI] [PMC free article] [PubMed] [Google Scholar]
- 20. Vitez SF, Forman EJ, Williams Z. Preimplantation genetic diagnosis in early pregnancy loss. Semin Perinatol. 2019;43:116‐120. [DOI] [PubMed] [Google Scholar]
- 21. Assisted Reproductive Technology in Australia and New Zealand 2019. UNSW Sydney; 2021. https://npesu.unsw.edu.au/ Accessed 27 October 2021 [Google Scholar]
- 22. Sciorio R, Esteves SC. Clinical utility of freeze‐all approach in ART treatment: a mini‐review. Cryobiology. 2020;92:9‐14. [DOI] [PubMed] [Google Scholar]
- 23. Wu J, Yang X, Huang J, Kuang Y, Wang Y. Fertility and neonatal outcomes of freeze‐all vs. fresh embryo transfer in women with advanced endometriosis. Front Endocrinol (Lausanne). 2019;10:770. [DOI] [PMC free article] [PubMed] [Google Scholar]
- 24. Chang JC, Chen MJ, Guu HF, et al. Does the “freeze‐all” policy allow for a better outcome in assisted reproductive techniques than the use of fresh embryo transfers? A retrospective study on cumulative live birth rates. Taiwan J Obstet Gynecol. 2017;56:775‐780. [DOI] [PubMed] [Google Scholar]
- 25. Dieamant FC, Petersen CG, Mauri AL, et al. Fresh embryos versus freeze‐all embryos ‐ transfer strategies: nuances of a meta‐analysis. JBRA Assist Reprod. 2017;21:260‐272. [DOI] [PMC free article] [PubMed] [Google Scholar]
- 26. Roque M, Valle M, Kostolias A, Sampaio M, Geber S. Freeze‐all cycle in reproductive medicine: current perspectives. JBRA Assist Reprod. 2017;21:49‐53. [DOI] [PMC free article] [PubMed] [Google Scholar]
- 27. Wei D, Liu J‐Y, Sun Y, et al. Frozen versus fresh single blastocyst transfer in ovulatory women: a multicentre, randomised controlled trial. Lancet. 2019;393:1310‐1318. [DOI] [PubMed] [Google Scholar]
- 28. Vuong LN, Dang VQ, Ho TM, et al. IVF transfer of fresh or frozen embryos in women without polycystic ovaries. N Engl J Med. 2018;378:137‐147. [DOI] [PubMed] [Google Scholar]
- 29. Stormlund S, Sopa N, Zedeler A, et al. Freeze‐all versus fresh blastocyst transfer strategy during in vitro fertilisation in women with regular menstrual cycles: multicentre randomised controlled trial. BMJ. 2020;370:m2519. [DOI] [PMC free article] [PubMed] [Google Scholar]