

Abstract
Exposure to nitrogen dioxide (NO2), black carbon (BC), and ultrafine particles (UFP) during pregnancy may increase risk of preeclampsia, but previous studies have not assessed hyper-localized differences in pollutant levels which may cause exposure misclassification. We used data from Google Street View cars with mobile air monitors that repeatedly sampled NO2, BC, and UFP every 30-meters in Downtown and West Oakland neighborhoods during 2015–2017. Data were linked to electronic health records of pregnant women in the 2014-2016 Sutter Health population who resided within 120-meters of monitoring data (N=1,095) to identify preeclampsia cases. We used G-computation with log-binomial regression to estimate risk differences (RD) associated with hypothetical interventions reducing pollutant levels to 25th percentiles observed in our sample on preeclampsia risk, overall and stratified by race/ethnicity. Prevalence of preeclampsia was 6.8%. Median (interquartile range) levels of NO2, BC, and UFP were 10.8 ppb (9.0, 13.0), 0.34 μg/m3 (0.27, 0.42), and 29.2 # × 103/cm3 (26.6, 32.6), respectively. Changes in the risk of preeclampsia achievable by limiting each pollutant to the 25th percentile was NO2 RD =−1.5 per 100 women (95% confidence interval (CI): −2.5, −0.5); BC RD=−1.0 (95% CI: −2.2, 0.02); and UFP RD = −0.5 (95% CI: −1.8, 0.7). Estimated effects were largest for non-Latina Black mothers: NO2 RD=−2.8 (95% CI: −5.2, −0.3) and BC RD=−3.0 (95% CI: −6.4, 0.4).
Keywords: black carbon, nitrogen dioxide, ultrafine particles, hypertensive disorders of pregnancy, pregnancy complications, maternal health, air pollution
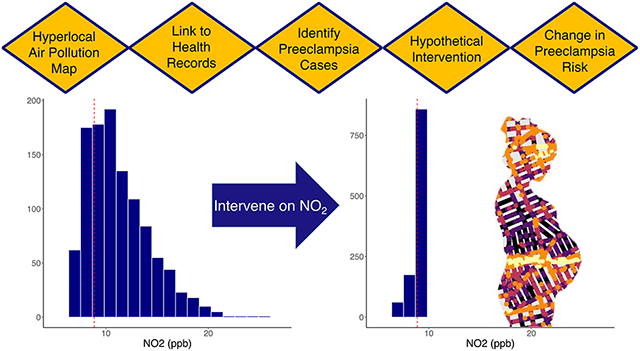
Graphical Abstract
Preeclampsia and other hypertensive disorders of pregnancy are threats to both maternal and fetal health. A pregnancy complicated with preeclampsia or gestational hypertension is more likely to result in a fetal-growth-restricted or premature newborn (1, 2), and experiencing a hypertensive disorder of pregnancy has been linked to increased risk for cardiovascular disease for mothers later in life (3, 4). Preeclampsia can result in severe complications and maternal death if untreated (2).
The prior evidence linking air pollution with hypertensive disorders of pregnancy, including preeclampsia and gestational hypertension (5, 6) is limited due to coarse geographic resolution and limited categories of pollutants assessed. The majority of studies of air pollution and maternal health outcomes have relied on methods with low spatial resolution, such as fixed-site air pollution monitors, chemical transport models, satellite remote sensing, and distance to nearby roads (7). These measurement methods provide spatial exposure estimates of 1-kilometer in resolution or more (8), while recent studies using mobile monitoring suggest that on-road pollutant concentrations may vary by factors of 5 to 8 within a city block (8). Therefore, previous studies that rely on air pollution measures with low spatial resolution may have significant exposure misclassification that masks important heterogeneity within neighborhoods.
In addition, some pollutants have not been assessed using standard methods. For example, black carbon (BC) and ultrafine particles (UFP, particles with diameter of less than 0.1 μm), have not been measured using satellite remote sensing methods (8). However, the established links between these pollutants and hypertension, asthma exacerbations, and adverse cardiovascular outcomes (9-11) suggest they can negatively affect cardiovascular and immune function in ways that are relevant for maternal health and the risk for preeclampsia, in particular. Land-use regression models can provide spatially detailed information (7, 12-14), but may fail to capture local emission sources and are inconsistent at predicting pollution hot spots (8, 15). Studies linking air pollution to preeclampsia have focused almost exclusively on particulate matter less than 2.5 micrograms (PM2.5) and nitrogen dioxide (NO2) (5). Other pollutants relevant to urban areas, like black carbon (BC) and ultrafine particulate matter (UFP) have only been studied in limited settings (16-19). To our knowledge, only one prior study has evaluated the association between UFP and hypertensive disorders of pregnancy (17).
To address the limitations of the prior literature on air pollution and hypertensive disorders of pregnancy, we use data from Sutter Health electronic health records (EHR) in combination with exposure information collected by Google Street View cars that measured air quality on average 50 times per block in West and Downtown Oakland, California between 2015-2017. This novel assessment of exposure permitted granular characterizations of NO2, BC, and UFP in 30-meter (30-m) road segments across neighborhoods in Oakland. We focused on these three pollutants because they are characterized by a high degree of intra-urban and intra-neighborhood spatial variability. Within our study area, black carbon (BC) is generated principally by diesel engines, with an additional contribution from wood combustion during the heating season (9). Nitrogen dioxide (NO2) results from traffic and other combustion sources, such as residential and industrial combustion. NO2 is one of two nitrogen oxide species (NOx = NO + NO2) that exist in dynamic equilibrium. Most primary combustion emissions of NOx are released as NO and are rapidly converted to NO2 (timescale ~5-15 mins) during daylight hours. NO2 therefore exhibits less sharp spatial gradients than NO but is the NOx species with clearly identified health effects. Ultrafine particles (UFP) are produced by both direct emissions as well as secondary atmospheric formation (nucleation) which occurs most commonly in summer months. Major primary sources of UFP include traffic, residential natural gas combustion, meat cooking, and industrial combustion emissions (20). To evaluate associations with preeclampsia, we linked maternal addresses to these block segments, identified cases of preeclampsia from the Sutter EHR among these mothers, and evaluated the impact of a hypothetical intervention in which air pollutant levels were reduced.
We focused our analyses on Oakland because it is a city in the San Francisco Bay Area that has documented challenges and activism around high air pollution levels (21-23), a history of racial residential segregation (24), and elevated prevalence of adverse birth outcomes. Therefore, based on prior evidence that exposure to environmental hazards and social inequality can explain racial disparities in adverse maternal and infant health outcomes (25), we hypothesized that exposure to air pollution is associated with increased risk of preeclampsia, and that these associations are stronger for Black women due to the chronic stress experienced as a result of structural and interpersonal racism (26, 27). Additionally, using hyper-localized measures of air pollution is especially important in a city like Oakland, which has densely populated neighborhoods near multiple industrial and traffic sources of pollution with hills and other complex terrain that traditional methods cannot effectively capture (28).
Methods
Study population
Mothers who lived in West or Downtown Oakland at the time of delivery and had a singleton live birth in a Sutter Hospital between 2014 and 2016 were eligible for inclusion (see supplemental material for detailed description of analytic sample creation). Our study population (N=1,095 births to 1,059 mothers) includes approximately 70% of the births that occurred to mothers living in these neighborhoods during the study period based on statewide birth certificate data from the California Department of Public Health.
This study was approved by the University of California, Berkeley Committee on Human Subjects and University of California, San Francisco, Sutter Health, and Columbia University Institutional Review Boards.
Air pollution measures
We used a fleet of Google Street View cars to repeatedly measure air quality on every street within West and Downtown Oakland from May 2015 and December 2017 during weekday, daytime hours balanced among all seasons from approximately 9:00 AM to 5:00 PM (8). The cars used were gasoline-powered Subaru Imprezas equipped with fast-response laboratory-grade air pollution instrumentation to measure NO2 (Teledyne T500U via cavity attenuation phase-shift spectroscopy), BC (Droplet Measurement Technologies PAX photoacoustic spectrometer), and UFP (TSI 3788 water-based condensation particle counter) with high accuracy and precision (8). Instruments were subjected to daily quality control procedures and weekly calibration and zero checks. Testing indicated that the monitors self-sampled exhaust from the Street View cars themselves in rare circumstances, when backing up after idling in low-wind conditions (8). Oakland neighborhoods comprising approximately 40 km2 were the focus of the most intensive repeated monitoring, with an average of 50 car visits to each city street over the 2.5-year study. The internal consistency of the data was verified using careful subsampling/bootstrap resampling to demonstrate that spatial patterns were stable, and intraclass correlation coefficients of the measurements were high (0.8-0.95), indicating the majority of variability was across block segments rather than within segments over time (8). An algorithm was developed to precisely (± 10-20%) estimate the median weekday daytime pollution concentrations every 30-m based on repeated observations from the cars (8). Concentrations were consistent with regulatory monitors where they existed, and comparison of our approach to other mobile monitoring approaches and fixed site monitors of pollutants in Oakland indicates the measurement data is robust (29, 30). Additional information about the exposure measurement approach is available elsewhere (8). Our main analysis linked maternal address at delivery to the median pollutant level across the approximately 50 repeated measurements at the nearest 30-m block segment. This represents the average long-term exposure to each pollutant within the 30-m segment.
Preeclampsia and gestational hypertension measurement
We identified cases of preeclampsia from mothers’ EHR data using International Classification of Diseases (ICD)-9 codes 642.4x-642.5x and 642.7x and ICD-10 codes O11.x, O14.0x, O14.1x, and O14.9x. These include diagnoses of mild or unspecified preeclampsia, severe preeclampsia, and preeclampsia with pre-existing hypertension. As a sensitivity analysis, we created a composite outcome variable that included all mothers who were classified as experiencing either preeclampsia and/or gestational hypertension. The latter was characterized by ICD-9 codes 642.3x and ICD-10 codes O13.x, which identify transient hypertension of pregnancy.
Area-level socioeconomic factors
We calculated the percent of people with less than high school education and below the federal poverty threshold at the block group level using the 2011–2015 American Community Survey. The distribution of educational attainment and poverty varied across the study area (Supplemental Figure 1).
Statistical analysis
We estimated the correlations between pollutants and community covariates using Pearson’s correlation coefficient. We examined the linearity of the relationship between each pollutant and the odds of preeclampsia using penalized splines. We then estimated the effect of a potential intervention in which pollution levels were reduced to the 25th percentile of levels observed across the study participants. Therefore, we used G-computation with log-binomial regression to estimate risk differences (RD) if all mothers with pollutant levels above the 25th percentile were set to the 25th percentile level, while those with pollutant levels below the 25th percentile were left as observed (31). G-computation is a substitution estimator of the average treatment effect (32); it is also a form of standardization that produces a marginal effect estimate (33), which in this case represents the expected change in risk of the outcome (i.e., the change in the expected number of cases per 100 women) if the hypothetical intervention had occurred. For these estimates to be interpreted causally, the models must be correctly specified, and exchangeability, positivity, and consistency must be satisfied (34).
We estimated log-binomial regression models of pollutant levels on preeclampsia, controlling for maternal race/ethnicity, health insurance type, maternal age at delivery, maternal age squared, smoking history, parity, season of conception, the block group percent with less than high school education, and the block group percent below the federal poverty level. Supplemental Figure 2 shows a directed acyclic graph that illustrates why we elected to control for these variables. We modeled pollution levels continuously and included squared terms to account for potential non-linearities in their effect on the outcome; we did not co-adjust for the other pollutants. We stratified by maternal race/ethnicity and season of conception to assess whether there were differential effects by these potential effect modifiers. In stratified analyses the 25th percentile of air pollutants across all participants was used as the intervention threshold, not the 25th percentile within strata. For inference, we calculated Wald-type confidence intervals using a clustered bootstrap by block group with 250 iterations. The cluster bootstrap helps account for spatial autocorrelation in exposure and outcome. All analyses were conducted using R version 3.6.0 (35).
Sensitivity analyses
We conducted several sensitivity analyses. First, we repeated our main analyses using the average value of all 30-m segments within a 120-m radius of the maternal residence to capture larger areas of potential exposure, which is approximately the length of one city block in West and Downtown Oakland and could be more representative of mothers’ actual exposures due to wind patterns or if they traveled within their neighborhoods often during pregnancy. Second, to assess whether more extreme levels of pollutants had stronger impacts on mothers’ cardiovascular health during pregnancy, we used the 75th percentile, rather than the median, of the pollutant measurements across the approximately 50 repeated measurements for each 30-m segment. Third, we also estimated the risk difference for a hypothetical intervention setting the pollution levels above the median to the median, rather than the 25th percentile. In the supplemental material, we also show results for NOx, which is the combination of NO and NO2. We also include in the supplemental material a sensitivity analysis limiting the study years to 2015 and 2016 so that the outcome measurements overlap with the exposure measurements. Finally, we present results for joint evaluation of the pollutants as a mixture using quantile G-computation, which estimates the expected change in risk of preeclampsia if all pollutant levels increased by one quartile.
Results
Our data on NO2, BC, and UFP in Oakland, California neighborhoods 2015–2017 demonstrate pollution patterns that are remarkably variable in space (Figure 1), including across the 30-m segments we included in analyses. The median levels of NO2, BC, and UFP exposure among our study participants were 10.8 ppb, 0.34 μg/m3, and 29.2 # × 103/cm3, respectively (Table 1), and pollutant levels were moderately correlated across participants (Table 2). NO2 and BC had the highest correlation with one another (Pearson ρ = 0.65), and ρ = 0.56 for NO2 and UFP (Table 2). The area-level socioeconomic factors, percent with less than a high school education and percent with household income below the poverty line, had a correlation of 0.50. The socioeconomic factors were not as strongly or in all cases positively correlated with the pollution levels.
Figure 1. Distribution of Black Carbon (BC), Nitrogen Dioxide (NO2), and Ultrafine Particles (UFP) within the study area of Downtown and West Oakland, California.

Table 1.
Descriptive statistics of participant exposure to pollutant levels across 30-m segments in study area of Downtown and West Oakland, California.
| Mean | Minimum | 25th percentile |
Median | 75th percentile |
Maximum | |
|---|---|---|---|---|---|---|
| Nitrogen dioxide (ppb) | 11.5 | 6.7 | 9.0 | 10.8 | 13.0 | 24.0 |
| Black carbon (μg/m3) | 0.37 | 0 | 0.27 | 0.34 | 0.42 | 1.32 |
| Ultrafine particles (# × 103/cm3) | 30.1 | 17.0 | 26.6 | 29.2 | 32.6 | 67.3 |
Table 2.
Correlation of participant pollutant exposure levels by 30-m segments and socioeconomic factors by Census block groups within study area of Downtown and West Oakland, California.
| NO2 | BC | UFP | Percent below poverty |
Percent with less than high school education |
|
|---|---|---|---|---|---|
| NO2 | 1.00 | 0.65 | 0.56 | −0.19 | −0.05 |
| BC | - | 1.00 | 0.49 | 0.03 | −0.09 |
| UFP | - | - | 1.00 | 0.07 | 0.18 |
| Percent below poverty | - | - | - | 1.00 | 0.50 |
| Percent with less than high school education | - | - | - | - | 1.00 |
BC, black carbon; NO2, nitrogen dioxide; UFP, ultrafine particulates
The sample comprised 31.1% Black, 17.9% Latina, 18.6% Asian, and 18.1% White women (Table 3). Women were, on average, 29.8 years old at delivery, and the majority had private health insurance (79.1%). The prevalence of preeclampsia during the study period by block group varied spatially across the study area (Figure 2). The overall prevalence of preeclampsia during the study period was 6.8%, and the prevalence of gestational hypertension and/or preeclampsia was 13.8%. Prevalence of both conditions was highest among Black mothers (10.6% and 14.4%, respectively) and lowest among Asian mothers (3.9% and 3.9%, respectively) (Supplemental Table 1). No large differences in exposure by race/ethnicity were observed (Supplemental Table 2). The relationships between all pollutants and the odds of preeclampsia were linear (Supplemental Figure 3).
Table 3.
Descriptive statistics of study area and participants.
| N (%) | |
|---|---|
| Total block groups | 55 (100) |
| % with less than high school education, Mean (IQR) | 14.3 (7.8, 21.4) |
| % with family income below the poverty level, Mean (IQR) | 24.6 (14.0, 34.1) |
| Total population a | 1095 (100) |
| Race/ethnicity | |
| Latina | 196 (17.9) |
| Non-Latina White | 198 (18.1) |
| Non-Latina Black | 340 (31.1) |
| Non-Latina Asian | 204 (18.6) |
| Otherb | 157 (14.3) |
| Parity | |
| 1 | 524 (47.9) |
| 2 | 308 (28.1) |
| 3 | 134 (12.2) |
| 4+ | 129 (11.8) |
| Insurance | |
| Private | 866 (79.1) |
| Medicaid | 229 (20.9) |
| Ever smoked | |
| No | 775 (70.8) |
| Yes | 221 (20.2) |
| Unknown | 99 (9.0) |
| Preeclampsia | 75 (6.8) |
| Either preeclampsia or gestational hypertension | 151 (13.8) |
Total number of births to 1,059 mothers.
Includes other, missing or unknown, or multiple races/ethnicities.
Figure 2. Distribution of preeclampsia among participants across study area of Downtown and West Oakland, California.

When estimating the effect of reducing pollutant levels to the 25th percentile (using the closest 30-m segment to characterize exposure) compared to the observed distribution, we estimated reductions in risk of preeclampsia for both NO2 (RD = −1.5 cases per 100 women, 95% CI: −2.5, −0.5) and BC (RD = −1.0 cases per 100 women, 95% CI: −2.2, 0.02) (Figure 3). The findings using the average of 30-m segments within 120-m of the maternal residence, representing a larger exposure area, were slightly stronger (NO2 RD = −1.8, 95% CI: −3.1, −0.5 and BC RD = −1.4, 95% CI: −2.5, −0.3). Associations for UFP were identified but smaller in magnitude than for either NO2 or BC with both the 30-m (RD = −0.5, 95% CI: −1.8, 0.7) and 120-m approach (RD = −0.8, 95% CI: −1.7, 0.1). The associations for NOx were similar to those observed for NO2 for both the 30-m (RD = −1.8, 95% CI −2.9, −0.7) and 120-m approach (RD = −1.8, 95% CI −3.1, −0.6) (Supplemental Figure 4). Limiting the outcome years to 2015-2016 resulted in similar findings, although the confidence intervals were wider due to reduced sample size (Supplemental Figure 5). Estimating the joint effects of pollutants using quantile G-computation showed similar associations (Supplemental Figure 6). For example, using the 30-m exposure metric we estimated a risk difference of 1.6 cases per 100 women, 95% CI (−0.2, 3.4) when the exposure levels increased by one quartile simultaneously. For the 120-m metric, the findings were slightly stronger (RD = 2.0, 95% CI (0.3, 3.7). For both exposure metrics, the results were driven equally by BC and NO2, with UFP contributing little to the overall association.
Figure 3. Estimated preeclampsia risk differences per 100 women and 95% CI associated with hypothetical intervention reducing the pollutant levels to the 25th percentile versus the observed levels by exposure characterization distance.
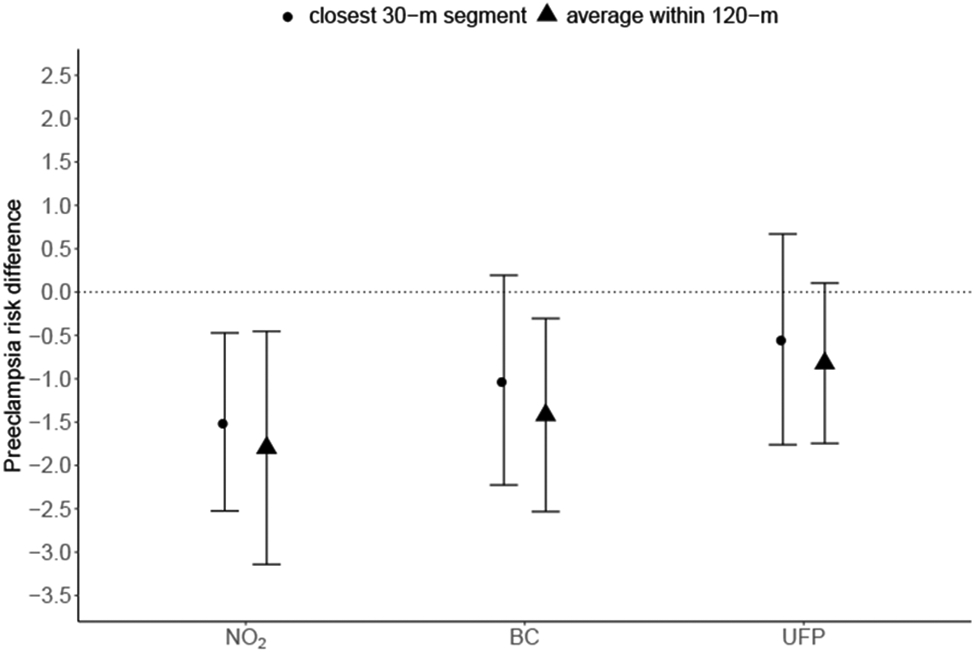
Note: Estimates shown for each pollutant averaged within 120-m and within 30-m of maternal residence at delivery. Models adjusted for maternal race/ethnicity, insurance type, age at delivery, age-squared, smoking history, parity, season of conception, proportion of census block with educational attainment less than high school, proportion of census block living below the poverty line. The 25th percentile was 9.0 ppb for NO2, 0.27 μg/m3 for BC, and 26.6 # × 103/cm3 for UFP.
We observed stronger associations for Black mothers compared to mothers of other races/ethnicities (Figure 4). For instance, we estimated that the hypothetical intervention for NO2 would result in a preeclampsia risk difference among Black women of −2.8 (95% CI: −5.2, −0.3), and −3.0 (95% CI: −6.4, 0.4) for BC, using the 30-m exposure characterization. Using the 120-m exposure characterization resulted in even larger estimates (NO2 RD = −3.7, 95% CI: −6.5, −0.8; BC RD = −3.5, 95% CI: −6.2, −0.8). Findings were similar when using the 75th percentile of the exposure to characterize more extreme exposure patterns (Supplemental Figures 7 and 8).
Figure 4. Estimated preeclampsia risk differences per 100 women and 95% CI by race/ethnicity associated with hypothetical intervention reducing the pollutant levels to the 25th percentile versus the observed levels by exposure characterization distance.
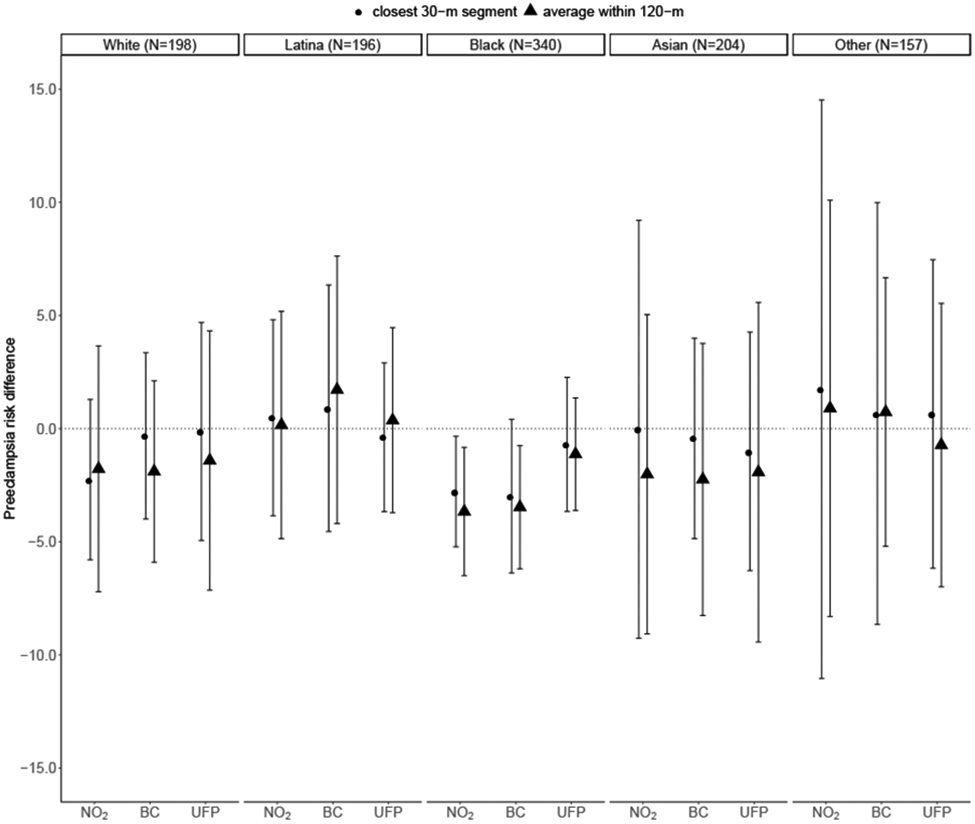
Note: Estimates shown for each pollutant averaged within 120-m and within 30-m of maternal residence at delivery. Models adjusted for maternal insurance type, age at delivery, age-squared, smoking history, parity, season of conception, proportion of census block with educational attainment less than high school, proportion of census block living below the poverty line. The 25th percentile was 9.0 ppb for NO2, 0.27 μg/m3 for BC, and 26.6 # × 103/cm3 for UFP.
There was no strong patterning by season of conception, although the associations for NO2, BC, and UFP were slightly stronger among women who conceived in the Winter and Spring compared to those who conceived in the Summer and Fall (Supplemental Figure 9).
Secondary analyses that conducted a hypothetical intervention by setting the pollutants to the median, rather than the 25th percentile, resulted in attenuated estimates. For example, the expected difference in preeclampsia risk was −0.5 (95% CI: −1.4, 0.5) for NO2 and −0.4 (95% CI: −1.1, 0.2) for BC when using the 30-m exposure characterization (Supplemental Figure 10). The 120-m characterization of exposure resulted in larger estimated effects compared to the 30-m exposure for this hypothetical intervention as well: RD = −0.8 (95% CI: −1.6, 0.0) for NO2 and RD = −0.9 (95% CI: −1.7, −0.2) for BC. The race-stratified results for this scenario followed a similar pattern with strongest results observed among Black women (Supplemental Figure 11).
When we analyzed the impact of our hypothetical intervention on gestational hypertension and/or preeclampsia, our results were attenuated (Supplemental Figure 12). For example, the estimated changes in the risk of gestational hypertension and/or preeclampsia were NO2 RD: −0.3 (95% CI: −1.9, 1.2) and BC RD: −0.2 (95% CI: −1.8, 1.5). The race-stratified results for gestational hypertension and/or preeclampsia were stronger for both Black and Asian mothers, with slightly stronger associations observed for Asian mothers for NO2 and UFP (Supplemental Figure 13).
Discussion
Using hyper-localized measures of air pollution in Oakland, California, we estimated the effect of a potential intervention reducing pollutants to the first quartile of their observed distribution. Results showed that reducing NO2 and BC to the 25th percentile would substantially reduce risk of preeclampsia among pregnant women, especially among non-Latina Black women, but reducing UFP had little effect. Associations using the 120-m exposure metric were slightly stronger than those using the 30-m metric, suggesting that larger geographic resolution of BC and NO2 exposure measurements, which are nonetheless an order of magnitude smaller than traditional measurements, may better represent actual exposures people experience in their neighborhoods. It is also possible the larger exposure metrics may have less sampling uncertainty given the greater number of measurements that are averaged, or they may be more strongly correlated with unmeasured neighborhood-level factors associated with preeclampsia risk. Preeclampsia is a severe maternal complication of pregnancy that often leads to preterm birth, fetal growth restriction, and if untreated, can lead to maternal death, and these findings indicate that NO2 and BC exposure during pregnancy likely contribute to adverse maternal health outcomes. Further, the prevalence of preeclampsia was 40% higher in non-Latina Black versus White women in our sample (Supplemental Table 1). Air pollution exposures, therefore, may contribute to disparities in both preeclampsia, and the fetal and maternal health sequelae of preeclampsia, by race/ethnicity.
Studies evaluating the mechanisms underlying relationships between traffic-related air pollutants and hypertensive disorders of pregnancy indicate that different pollutants likely operate via distinct pathways. For example, PM2.5 appears to increase vascular inflammation whereas NO2 likely operates via oxidative stress (5), although both result in higher blood pressure. Mechanistic understanding of the roles of BC and UFP in hypertensive disorders of pregnancy is not well-developed, however. Studies of potential toxicity associated with BC have focused on diesel exhaust or woodsmoke, but have not isolated BC from other components of the particulate matter produced by these combustion processes (9). However, existing evidence suggests that BC carries other toxic components of combustion-related particulate matter, such as semi-volatile organics, to pulmonary or cardiovascular tissues (9). Recent evidence suggests that UFP exposure may have adverse health effects that exceed those produced by larger particles like PM2.5 because of their small size (which means they travel the body via diffusion and systemic circulation, and penetrate deeper into tissue), large surface-area to mass ratio, high retention rate (their small size allows them to evade clearance by phagocytosis), and ability to generate reactive oxygen species and oxidative stress (36). While there is evidence that short-term UFP exposure can adversely affect the respiratory, cardiovascular, and nervous systems (37), the mechanisms linking UFP exposure to possible adverse health effects, especially among pregnant women, are poorly understood (36, 37). Future studies that are sufficiently powered to examine the potential interactive effects of BC, NO2, and UFP would be helpful to better understand how these pollutants may jointly affect pregnancy outcomes.
Two prior studies examined relationships between BC and either preeclampsia or hypertensive disorders of pregnancy using land-use regression models to characterize exposure. One did not find associations (16) while the other found small, non-statistically significant positive associations (17). The average level of BC exposure in (16) was higher than what we observed, with an average of 0.5 μg/m3 versus 0.34 μg/m3 in our study. Differences in results between this study and ours could therefore be due to differences in exposure levels or could be explained by our hyper-localized exposure measurements or different study populations. In addition, including gestational hypertension with preeclampsia largely attenuated our results; these smaller findings were consistent with the previous study that focused exclusively on hypertensive disorders of pregnancy (17). Assibey-Mensah et al. (17) focused on identifying critical windows of exposure for each month of pregnancy and found small associations of an IQR increase of BC (0.67 - 1.52) with gestational hypertension during months 3 and 7. Our study was unable to assess critical windows of exposure, which may also explain inconsistent results.
Our results for both NO2 and UFP were largely consistent with prior evidence. The National Toxicology Program’s Systematic Review of Traffic-related Air Pollution and Hypertensive Disorders of Pregnancy determined there was evidence to support a small positive relationship between increasing NO2 exposure and risk of preeclampsia based on nine studies (5). These studies used air dispersion or land use regression models to characterize exposure, and the meta-analysis indicated a pooled relative risk for preeclampsia of 1.04 (95% CI: 0.91, 1.10) associated with a 10 μg/m3 increase in NO2. We estimated a risk difference of −1.5 (95% CI: −2.5, −0.5) associated with setting all mothers with NO2 exposure above 9 μg/m3 (range = 9.1 to 24 μg/m3) to 9 μg/m3. Furthermore, another study in Southern California that also used local monitoring to inform their air quality estimates examined the relationship between UFP and hypertensive disorders of pregnancy and did not find a relationship between them (17). We found a reduced risk associated with reduced UFP exposure, but the magnitude was smaller than those observed for NO2 and BC and the estimate was imprecise. Two studies, however, found increased odds of preterm birth associated with elevated UFP exposure during pregnancy (38, 39), and preeclampsia is a major risk factor for preterm birth. The most recent study took place in Los Angeles and reported a modeled mean UFP level of 12.0 # × 103/cm3 (38). This is less than half of the average exposure level we observed in Oakland (30.1 # × 103/cm3).
While our study improved upon prior work in important ways, it had limitations. The air pollution measurements were averaged from observations that took place between May 2015 and December 2017, while the births occurred between 2014 and 2016. Therefore, we do not have strict temporality between our exposure and outcomes. Given that the annual averages were consistent over time, exposure measurements are good proxies for exposure during the times during which our participants were pregnant. Furthermore, while seasonality exists in the levels of air pollutants in Oakland, we did not have enough measurements to create season-specific exposures, although we did control for season of conception and evaluated whether it modified the findings. In addition, while prior evidence indicates that there are critical windows during which air pollution may impact risk of hypertensive disorders of pregnancy (40), we were not able to assess trimester-specific effects.
On the whole, the mobile monitoring approach used to measure exposure had several strengths and weaknesses. Mobile monitoring captures greater spatial variation compared to fixed site monitoring or land use regression models. Another advantage over land use regression models is that mobile monitoring is a direct measurement of ambient air quality that does not require prediction based on associations with a limited set of spatial covariates. Therefore, it can capture idiosyncratic pollution hotspots missed by land use regression models (15). However, mobile monitoring has limitations. Traffic patterns and atmospheric dispersion differ between daytime and nighttime, and we collected measurements only during daytime hours. For the years of mobile monitoring (2015–2017), the average weekday 9am–5pm NO2 concentrations at the Oakland West fixed site monitor (which was located at the center of the mobile monitoring road network) were ~5% (0.7 ppb) lower than the corresponding annual average concentrations. This temporal pattern is consistent with other Bay Area monitors, suggesting that the temporal bias of our measurements imposed minimal bias on the average conditions represented. Additionally, the concentration surfaces that result from mobile measurements are inherently time-averaged, so this exposure measurement approach is better suited for capturing spatial variation than seasonal variation that may be important when assessing susceptibility windows.
We also geocoded women based on the address they provided at delivery, which may have resulted in exposure misclassification if they moved during pregnancy. Several previous studies have evaluated the extent of bias from exposure misclassification due to maternal mobility during pregnancy and have found the bias to be small and generally toward the null, although with differential patterns by maternal characteristics (41-44). However, given the hyper-local nature of our exposure measurements it is possible that the misclassification due to mobility may be larger in our study population. It is also possible that on-road concentrations of pollutants overestimate the exposure levels at residential addresses. In the parts of Oakland included in this analysis, however, housing units are generally close to the street and lack large front yards. The potential for exposure mismeasurement may vary by block socioeconomic characteristics. We controlled for area-level socioeconomic factors to mitigate this potential bias. Furthermore, a recent study compared the mobile monitoring approach we use in this study to a fixed site network of monitors for BC among homes, businesses, and industrial sites in West Oakland (30). The fixed site monitors were attached to fences and porches at a height of 1.5m with a median distance to the nearest road of 15m (45), and 97 of the 100 sites were located within 30m of the mobile monitoring road network. There was also overlap in the time of sampling—of the 100 days the fixed site monitors were deployed, 57 days were simultaneously covered by the Google Street View mobile monitoring (30). The comparison found no systematic overestimation of pollution using mobile monitoring compared to fixed site monitors at residences and businesses; median levels of BC were 0.48 μg/m3 across the fixed site monitors and 0.44 μg/m3 using the mobile monitoring on residential roads. While this study only examined levels of BC, and not NO2 or UFP, the findings suggest the differential between on-road versus residential exposure in these areas may be minimal.
We were not able to account for fetal loss or still births, which may have created live birth bias in our analysis (46). However, we expect that this would bias our findings toward the null. The study population of births at Sutter Hospitals included approximately 70% of all births in West and Downtown Oakland that occurred during the study period, and therefore it is possible our results were affected by selection bias. To evaluate this, we considered the predictors of giving birth at a Sutter Hospital compared to other facilities in the Bay Area. In a comparison of demographics, the only differences we observed were that Sutter births were more likely to be covered by private insurance. Since we have controlled for insurance type in the analysis, for selection bias to be induced there would need to at least two other factors that are uncontrolled for in the analysis that 1) both independently influence the likelihood of having private insurance, and 2) one must be associated with exposure to air pollutants and the other must be associated with preeclampsia (or they are associated with both air pollutants and preeclampsia). An example of two such factors could be educational attainment and occupation, factors for which we were not able to control. However, we expect the majority of the effects of education and occupation on selection into the Sutter population to operate through insurance type. Furthermore, we have controlled for other markers of socioeconomic status, including maternal age at delivery, race/ethnicity, smoking history, parity, and the block group percent with less than high school education and percent below the federal poverty level. Given the number of socioeconomic variables we controlled for and the small magnitudes of bias that are common with this type of bias structure (47), we do not expect selection bias to substantially affect our findings. However, the potential remains for bias from residual confounding, as we lacked data on potentially important confounders and effect modifiers including maternal body mass index, marital status, education, and occupational exposures. We also were unable to assess potential confounding or effect modification by pre-existing hypertension as there was too much missingness in this variable to conduct stratified analyses. We were also not able to include information on use of antihypertensive medication during pregnancy.
The levels of pollutants we observed in Oakland were below the EPA’s standards for health and welfare, where those standards exist. For instance, the annual standard for NO2 is 53 ppb (48), while the maximum level observed in this study was 24 ppb. Nevertheless, we found associations of NO2 with preeclampsia at annual levels below half the standard. This suggests that air pollutants may have detrimental effects on the health of pregnant women, even in places where the air quality is better than the standard. While there are no current standards for UFP or BC, levels of BC in California have been declining over the past decades, averaging 0.14 μg/m3 since 2010 (49, 50). The average BC exposure levels we observed in Oakland (0.34 μg/m3), however, were more than double the state average.
Preeclampsia is a pregnancy complication with potentially life-threatening implications, for both mother and fetus, and prevention is an important public health goal. Nationally, preeclampsia affects 3.4% of pregnancies (51), but we observed a risk twice as high for our sample overall (6.8%) and three times as high for non-Latina Black women in our sample (10.6%). We estimated reductions in risk of preeclampsia overall and even larger benefits for Black women could be achieved with hypothetical interventions reducing the levels of BC and NO2. Since we did not observe differences in the average pollutant levels across racial/ethnic groups in our study (Supplemental Table 2), it may be that the larger estimated effects of pollution reduction we observed among Black women may be a result of interaction between the air pollutants we measured here with other chemical or non-chemical stressors. For example, these stressors could increase the likelihood among Black women of having pre-existing hypertension, which could interact with air pollution exposure to influence risk of preeclampsia. This study provides evidence that reducing air pollutants even far below regulatory standards may reduce the risk of preeclampsia and alleviate disparities in maternal and infant health in Oakland, California. The Clean Air Act stipulates a duty for EPA to protect at-risk populations with an adequate margin of safety. Our findings support previous recommendations to consider pregnant women an at-risk group under the Clean Air Act National Ambient Air Quality Standards (52).
Supplementary Material
Description of creation of analytic sample
Supplemental Table 1. Counts and prevalence of preeclampsia and preeclampsia and/or gestational hypertension overall and by race/ethnicity in Downtown and West Oakland, California.
Supplemental Table 2. Median (IQR) of pollutant exposure levels by race/ethnicity of participants in Downtown and West Oakland, California.
Supplemental Figure 1. Distributions of educational attainment and poverty rate by block group in West and Downtown Oakland.
Supplemental Figure 2. Directed Acyclic Graph of variables and their hypothesized relationships with the exposure and outcome.
Supplemental Figure 3. Estimated odds ratios and 95% confidence intervals for preeclampsia across the distribution of each pollutant.
Supplemental Figure 4. Estimated preeclampsia risk differences per 100 women and 95% CI associated with hypothetical intervention reducing NOx to the 25th percentile versus the observed levels by exposure characterization distance.
Supplemental Figure 5. Estimated preeclampsia risk differences associated with hypothetical intervention reducing the pollutant levels to the 25th percentile versus the observed levels by exposure characterization distance, limited to study years 2015-2016.
Supplemental Figure 6. Estimated preeclampsia risk differences associated with jointly increasing all exposures by one quartile, by exposure characterization distance.
Supplemental Figure 7. Estimated preeclampsia risk differences associated with hypothetical intervention reducing the pollutant levels to the 25th percentile versus the observed levels by exposure characterization distance, using the 75th percentile of exposure.
Supplemental Figure 8. Estimated preeclampsia risk differences by race/ethnicity associated with hypothetical intervention reducing the pollutant levels to the 25th percentile versus the observed levels by exposure characterization distance, using the 75th percentile of exposure.
Supplemental Figure 9. Estimated preeclampsia risk differences per 100 women and 95% CI by season of conception associated with hypothetical intervention reducing the pollutant levels to the 25th percentile versus the observed levels by exposure characterization distance.
Supplemental Figure 10. Estimated preeclampsia risk differences associated with hypothetical intervention reducing the pollutant levels to the 50th percentile versus the observed levels by exposure characterization distance.
Supplemental Figure 11. Estimated preeclampsia risk differences by race/ethnicity associated with hypothetical intervention reducing the pollutant levels to the 50th percentile versus the observed levels by exposure characterization distance.
Supplemental Figure 12. Estimated gestational hypertension and/or preeclampsia risk differences associated with hypothetical intervention reducing the pollutant levels to the 25th percentile versus the observed levels by exposure characterization distance.
Supplemental Figure 13. Estimated gestational hypertension and/or preeclampsia risk differences by race/ethnicity associated with hypothetical intervention reducing the pollutant levels to the 25th percentile versus the observed levels by exposure characterization distance.
Synopsis:
We documented a reduction in the risk of preeclampsia among pregnant women in Oakland, California associated with a hypothetical intervention lowering air pollutant levels surrounding their residences.
Footnotes
The authors declare no competing interests.
References
- 1.Mateus J, Newman RB, Zhang C, Pugh SJ, Grewal J, Kim S, Grobman WA, Owen J, Sciscione AC, Wapner RJ. Fetal growth patterns in pregnancy-associated hypertensive disorders: NICHD Fetal Growth Studies. American journal of obstetrics and gynecology. 2019;221(6):635. e1–. e16. [DOI] [PMC free article] [PubMed] [Google Scholar]
- 2.Mol BW, Roberts CT, Thangaratinam S, Magee LA, De Groot CJ, Hofmeyr GJ. Pre-eclampsia. The Lancet. 2016;387(10022):999–1011. [DOI] [PubMed] [Google Scholar]
- 3.Bellamy L, Casas J-P, Hingorani AD, Williams DJ. Pre-eclampsia and risk of cardiovascular disease and cancer in later life: systematic review and meta-analysis. Bmj. 2007;335(7627):974. [DOI] [PMC free article] [PubMed] [Google Scholar]
- 4.Brown MC, Best KE, Pearce MS, Waugh J, Robson SC, Bell R. Cardiovascular disease risk in women with pre-eclampsia: systematic review and meta-analysis. European journal of epidemiology. 2013;28(1):1–19. [DOI] [PubMed] [Google Scholar]
- 5.(NTP) NTP. NTP Monograph on the Systematic Review of Traffic-related Air Pollution and Hypertensive Disorders of Pregnancy. In: Services USDoHaH, editor. Research Triangle Park, North Carolina, USA: National Institute of Environmental Health Sciences; 2019. [Google Scholar]
- 6.Pedersen M, Stayner L, Slama R, Sørensen M, Figueras F, Nieuwenhuijsen MJ, Raaschou-Nielsen O, Dadvand P. Ambient air pollution and pregnancy-induced hypertensive disorders: a systematic review and meta-analysis. Hypertension. 2014;64(3):494–500. [DOI] [PubMed] [Google Scholar]
- 7.Malmqvist E, Jakobsson K, Tinnerberg H, Rignell-Hydbom A, Rylander L. Gestational diabetes and preeclampsia in association with air pollution at levels below current air quality guidelines. Environmental health perspectives. 2013;121(4):488–93. [DOI] [PMC free article] [PubMed] [Google Scholar]
- 8.Apte JS, Messier KP, Gani S, Brauer M, Kirchstetter TW, Lunden MM, Marshall JD, Portier CJ, Vermeulen RC, Hamburg SP. High-resolution air pollution mapping with Google street view cars: exploiting big data. Environmental science & technology. 2017;51(12):6999–7008. [DOI] [PubMed] [Google Scholar]
- 9.Janssen NA, Gerlofs-Nijland ME, Lanki T, Salonen RO, Cassee F, Hoek G, Fischer P, Brunekreef B, Krzyzanowski M. Health effects of black carbon: World Health Organization; 2012. [Google Scholar]
- 10.Li N, Sioutas C, Cho A, Schmitz D, Misra C, Sempf J, Wang M, Oberley T, Froines J, Nel A. Ultrafine particulate pollutants induce oxidative stress and mitochondrial damage. Environmental health perspectives. 2003;111(4):455–60. [DOI] [PMC free article] [PubMed] [Google Scholar]
- 11.Belleudi V, Faustini A, Stafoggia M, Cattani G, Marconi A, Perucci CA, Forastiere F. Impact of fine and ultrafine particles on emergency hospital admissions for cardiac and respiratory diseases. Epidemiology. 2010:414–23. [DOI] [PubMed] [Google Scholar]
- 12.Wu J, Ren C, Delfino RJ, Chung J, Wilhelm M, Ritz B. Association between local traffic-generated air pollution and preeclampsia and preterm delivery in the south coast air basin of California. Environmental health perspectives. 2009;117(11):1773–9. [DOI] [PMC free article] [PubMed] [Google Scholar]
- 13.Madsen C, Håberg SE, Aamodt G, Stigum H, Magnus P, London SJ, Nystad W, Nafstad P. Preeclampsia and hypertension during pregnancy in areas with relatively low levels of traffic air pollution. Maternal and child health journal. 2018;22(4):512–9. [DOI] [PMC free article] [PubMed] [Google Scholar]
- 14.Sears CG, Braun JM, Ryan PH, Xu Y, Werner EF, Lanphear BP, Wellenius GA. The association of traffic-related air and noise pollution with maternal blood pressure and hypertensive disorders of pregnancy in the HOME study cohort. Environment international. 2018;121:574–81. [DOI] [PMC free article] [PubMed] [Google Scholar]
- 15.Messier KP, Chambliss SE, Gani S, Alvarez R, Brauer M, Choi JJ, Hamburg SP, Kerckhoffs J, LaFranchi B, Lunden MM. Mapping air pollution with google street view cars: Efficient Approaches with mobile monitoring and land use regression. Environmental science & technology. 2018;52(21):12563–72. [DOI] [PubMed] [Google Scholar]
- 16.Choe S-A, Kauderer S, Eliot MN, Glazer KB, Kingsley SL, Carlson L, Awad YA, Schwartz JD, Savitz DA, Wellenius GA. Air pollution, land use, and complications of pregnancy. Science of the Total Environment. 2018;645:1057–64. [DOI] [PubMed] [Google Scholar]
- 17.Assibey-Mensah V, Glantz JC, Hopke PK, Jusko TA, Thevenet-Morrison K, Chalupa D, Rich DQ. Ambient wintertime particulate air pollution and hypertensive disorders of pregnancy in Monroe County, New York. Environmental research. 2019;168:25–31. [DOI] [PMC free article] [PubMed] [Google Scholar]
- 18.Assibey-Mensah V, Glantz JC, Hopke PK, Jusko TA, Thevenet-Morrison K, Chalupa D, Rich DQ. Wintertime Wood Smoke, Traffic Particle Pollution, and Preeclampsia. Hypertension. 2020:HYPERTENSIONAHA. 119.13139. [DOI] [PMC free article] [PubMed] [Google Scholar]
- 19.Mandakh Y, Rittner R, Flanagan E, Oudin A, Isaxon C, Familari M, Hansson SR, Malmqvist E. Maternal Exposure to Ambient Air Pollution and Risk of Preeclampsia: A Population-Based Cohort Study in Scania, Sweden. International Journal of Environmental Research and Public Health. 2020;17(5):1744. [DOI] [PMC free article] [PubMed] [Google Scholar]
- 20.Yu X, Venecek M, Kumar A, Hu J, Tanrikulu S, Soon S-T, Tran C, Fairley D, Kleeman MJ. Regional sources of airborne ultrafine particle number and mass concentrations in California. Atmospheric Chemistry and Physics. 2019;19(23):14677–702. [Google Scholar]
- 21.Fisher JB, Kelly M, Romm J. Scales of environmental justice: Combining GIS and spatial analysis for air toxics in West Oakland, California. Health & Place. 2006;12(4):701–14. [DOI] [PubMed] [Google Scholar]
- 22.Gonzalez PA, Minkler M, Garcia AP, Gordon M, Garzón C, Palaniappan M, Prakash S, Beveridge B. Community-based participatory research and policy advocacy to reduce diesel exposure in West Oakland, California. American Journal of Public Health. 2011;101(S1):S166–S75. [DOI] [PMC free article] [PubMed] [Google Scholar]
- 23.Pingkuan D. Diesel Particulate Matter Health Risk Assessment for the West Oakland Community. California Air Resources Board, Sacramento, CA. 2008. [Google Scholar]
- 24.Self RO. American Babylon: Race and the struggle for postwar Oakland: Princeton University Press; 2005. [Google Scholar]
- 25.Morello-Frosch R, Shenassa ED. The environmental “riskscape” and social inequality: implications for explaining maternal and child health disparities. Environmental health perspectives. 2006;114(8):1150–3. [DOI] [PMC free article] [PubMed] [Google Scholar]
- 26.Chambers BD, Arabia SE, Arega HA, Altman MR, Berkowitz R, Feuer SK, Franck LS, Gomez AM, Kober K, Pacheco-Werner T. Exposures to Structural Racism and Racial Discrimination among Pregnant and Early Postpartum Black Women living in Oakland, California. Stress and Health. 2020. [DOI] [PMC free article] [PubMed] [Google Scholar]
- 27.Chambers BD, Baer RJ, McLemore MR, Jelliffe-Pawlowski LL. Using index of concentration at the extremes as indicators of structural racism to evaluate the association with preterm birth and infant mortality—California, 2011–2012. Journal of Urban Health. 2019;96(2):159–70. [DOI] [PMC free article] [PubMed] [Google Scholar]
- 28.Joe DK, Zhang H, DeNero SP, Lee H-H, Chen S-H, McDonald BC, Harley RA, Kleeman MJ. Implementation of a high-resolution Source-Oriented WRF/Chem model at the Port of Oakland. Atmospheric environment. 2014;82:351–63. [Google Scholar]
- 29.Shah RU, Robinson ES, Gu P, Robinson AL, Apte JS, Presto AA. High-spatial-resolution mapping and source apportionment of aerosol composition in Oakland, California, using mobile aerosol mass spectrometry. Atmospheric Chemistry and Physics. 2018;18(22):16325–44. [Google Scholar]
- 30.Chambliss SE, Preble CV, Caubel JJ, Cados T, Messier KP, Alvarez RA, LaFranchi B, Lunden M, Marshall JD, Szpiro AA. Comparison of mobile and fixed-site black carbon measurements for high-resolution urban pollution mapping. Environmental Science & Technology. 2020;54(13):7848–57. [DOI] [PubMed] [Google Scholar]
- 31.Snowden JM, Mortimer KM, Dufour M-SK, Tager IB. Population intervention models to estimate ambient NO 2 health effects in children with asthma. Journal of exposure science & environmental epidemiology. 2015;25(6):567–73. [DOI] [PMC free article] [PubMed] [Google Scholar]
- 32.Robins J. A new approach to causal inference in mortality studies with a sustained exposure period—application to control of the healthy worker survivor effect. Mathematical modelling. 1986;7(9-12):1393–512. [Google Scholar]
- 33.Vansteelandt S, Keiding N. Invited commentary: G-computation–lost in translation? American journal of epidemiology. 2011;173(7):739–42. [DOI] [PubMed] [Google Scholar]
- 34.Snowden JM, Rose S, Mortimer KM. Implementation of G-computation on a simulated data set: demonstration of a causal inference technique. American journal of epidemiology. 2011;173(7):731–8. [DOI] [PMC free article] [PubMed] [Google Scholar]
- 35.Team RC. R: A language and environment for statistical computing. Vienna, Austria.: R Foundation for Statistical Computing; 2020. [Google Scholar]
- 36.Li N, Georas S, Alexis N, Fritz P, Xia T, Williams MA, Horner E, Nel A. A work group report on ultrafine particles (American Academy of Allergy, Asthma & Immunology): Why ambient ultrafine and engineered nanoparticles should receive special attention for possible adverse health outcomes in human subjects. Journal of Allergy and Clinical Immunology. 2016;138(2):386–96. [DOI] [PMC free article] [PubMed] [Google Scholar]
- 37.EPA. US. Integrated Science Assessment (ISA) for Particulate Matter. (Final Report 2019). Washington, DC: U.S. Environmental Protection Agency; 2019. [Google Scholar]
- 38.Wing SE, Larson TV, Hudda N, Boonyarattaphan S, Fruin S, Ritz B. Preterm Birth among Infants Exposed to in Utero Ultrafine Particles from Aircraft Emissions. Environmental Health Perspectives. 2020;128(4):047002. [DOI] [PMC free article] [PubMed] [Google Scholar]
- 39.Laurent O, Hu J, Li L, Kleeman MJ, Bartell SM, Cockburn M, Escobedo L, Wu J. A statewide nested case–control study of preterm birth and air pollution by source and composition: California, 2001–2008. Environmental health perspectives. 2016;124(9):1479–86. [DOI] [PMC free article] [PubMed] [Google Scholar]
- 40.Hu H, Ha S, Roth J, Kearney G, Talbott EO, Xu X. Ambient air pollution and hypertensive disorders of pregnancy: a systematic review and meta-analysis. Atmospheric environment. 2014;97:336–45. [DOI] [PMC free article] [PubMed] [Google Scholar]
- 41.Warren JL, Son J-Y, Pereira G, Leaderer BP, Bell ML. Investigating the impact of maternal residential mobility on identifying critical windows of susceptibility to ambient air pollution during pregnancy. American journal of epidemiology. 2018;187(5):992–1000. [DOI] [PMC free article] [PubMed] [Google Scholar]
- 42.Pennington AF, Strickland MJ, Klein M, Zhai X, Russell AG, Hansen C, Darrow LA. Measurement error in mobile source air pollution exposure estimates due to residential mobility during pregnancy. Journal of exposure science & environmental epidemiology. 2017;27(5):513–20. [DOI] [PMC free article] [PubMed] [Google Scholar]
- 43.Lupo PJ, Symanski E, Chan W, Mitchell LE, Waller DK, Canfield MA, Langlois PH. Differences in exposure assignment between conception and delivery: the impact of maternal mobility. Paediatric and perinatal epidemiology. 2010;24(2):200–8. [DOI] [PubMed] [Google Scholar]
- 44.Chen L, Bell EM, Caton AR, Druschel CM, Lin S. Residential mobility during pregnancy and the potential for ambient air pollution exposure misclassification. Environmental research. 2010;110(2):162–8. [DOI] [PubMed] [Google Scholar]
- 45.Caubel JJ, Cados TE, Preble CV, Kirchstetter TW. A distributed network of 100 black carbon sensors for 100 days of air quality monitoring in West Oakland, California. Environmental science & technology. 2019;53(13):7564–73. [DOI] [PubMed] [Google Scholar]
- 46.Raz R, Kioumourtzoglou M-A, Weisskopf MG. Live-birth bias and observed associations between air pollution and autism. American journal of epidemiology. 2018;187(11):2292–6. [DOI] [PMC free article] [PubMed] [Google Scholar]
- 47.Greenland S. Quantifying biases in causal models: classical confounding vs collider-stratification bias. Epidemiology. 2003:300–6. [PubMed] [Google Scholar]
- 48.Agency EP. Review of the Primary National Ambient Air Quality Standards for Oxides of Nitrogen Federal Register; 2018. p. 17226–78. [Google Scholar]
- 49.Board CAR. Atmospheric black carbon concentrations - Technical Report. In: Assessment OoEHH, editor. 2018. [Google Scholar]
- 50.Kirchstetter TW, Preble CV, Hadley OL, Bond TC, Apte JS. Large reductions in urban black carbon concentrations in the United States between 1965 and 2000. Atmospheric Environment. 2017;151:17–23. [Google Scholar]
- 51.Ananth CV, Keyes KM, Wapner RJ. Pre-eclampsia rates in the United States, 1980-2010: age-period-cohort analysis. Bmj. 2013;347:f6564. [DOI] [PMC free article] [PubMed] [Google Scholar]
- 52.Koman PD, Hogan KA, Sampson N, Mandell R, Coombe CM, Tetteh MM, Hill‐Ashford YR, Wilkins D, Zlatnik MG, Loch-Caruso R. Examining Joint Effects of Air Pollution Exposure and Social Determinants of Health in Defining “At-Risk” Populations Under the Clean Air Act: Susceptibility of Pregnant Women to Hypertensive Disorders of Pregnancy. World medical & health policy. 2018;10(1):7–54. [DOI] [PMC free article] [PubMed] [Google Scholar]
Associated Data
This section collects any data citations, data availability statements, or supplementary materials included in this article.
Supplementary Materials
Description of creation of analytic sample
Supplemental Table 1. Counts and prevalence of preeclampsia and preeclampsia and/or gestational hypertension overall and by race/ethnicity in Downtown and West Oakland, California.
Supplemental Table 2. Median (IQR) of pollutant exposure levels by race/ethnicity of participants in Downtown and West Oakland, California.
Supplemental Figure 1. Distributions of educational attainment and poverty rate by block group in West and Downtown Oakland.
Supplemental Figure 2. Directed Acyclic Graph of variables and their hypothesized relationships with the exposure and outcome.
Supplemental Figure 3. Estimated odds ratios and 95% confidence intervals for preeclampsia across the distribution of each pollutant.
Supplemental Figure 4. Estimated preeclampsia risk differences per 100 women and 95% CI associated with hypothetical intervention reducing NOx to the 25th percentile versus the observed levels by exposure characterization distance.
Supplemental Figure 5. Estimated preeclampsia risk differences associated with hypothetical intervention reducing the pollutant levels to the 25th percentile versus the observed levels by exposure characterization distance, limited to study years 2015-2016.
Supplemental Figure 6. Estimated preeclampsia risk differences associated with jointly increasing all exposures by one quartile, by exposure characterization distance.
Supplemental Figure 7. Estimated preeclampsia risk differences associated with hypothetical intervention reducing the pollutant levels to the 25th percentile versus the observed levels by exposure characterization distance, using the 75th percentile of exposure.
Supplemental Figure 8. Estimated preeclampsia risk differences by race/ethnicity associated with hypothetical intervention reducing the pollutant levels to the 25th percentile versus the observed levels by exposure characterization distance, using the 75th percentile of exposure.
Supplemental Figure 9. Estimated preeclampsia risk differences per 100 women and 95% CI by season of conception associated with hypothetical intervention reducing the pollutant levels to the 25th percentile versus the observed levels by exposure characterization distance.
Supplemental Figure 10. Estimated preeclampsia risk differences associated with hypothetical intervention reducing the pollutant levels to the 50th percentile versus the observed levels by exposure characterization distance.
Supplemental Figure 11. Estimated preeclampsia risk differences by race/ethnicity associated with hypothetical intervention reducing the pollutant levels to the 50th percentile versus the observed levels by exposure characterization distance.
Supplemental Figure 12. Estimated gestational hypertension and/or preeclampsia risk differences associated with hypothetical intervention reducing the pollutant levels to the 25th percentile versus the observed levels by exposure characterization distance.
Supplemental Figure 13. Estimated gestational hypertension and/or preeclampsia risk differences by race/ethnicity associated with hypothetical intervention reducing the pollutant levels to the 25th percentile versus the observed levels by exposure characterization distance.