Abstract
Nickel serves critical roles in the metabolism of E. coli and many prokaryotes. Many details of nickel trafficking are unestablished, but a nonproteinaceous low-molecular-mass (LMM) labile nickel pool (LNiP) is thought to be involved. The portion of the cell lysate that flowed through a 3 kDa cutoff membrane, which ought to contain this pool, was analyzed by size-exclusion and hydrophilic interaction chromatographies (SEC and HILIC) with detection by inductively coupled plasma (ICP) and electrospray ionization (ESI) mass spectrometries. Flow-through-solutions (FTSs) contained 11–15 μM Ni which represented most Ni in the cell. Chromatograms exhibited 4 major Ni-detected peaks. MS analysis of FTS and prepared nickel complex standards established that these peaks arose from Ni(II) coordinated to oxidized glutathione, histidine, aspartate, and ATP. Surprisingly, Ni complexes with reduced glutathione or citrate were not members of the LNiP under the conditions examined. Aqueous Ni(II) ions were absent in the FTS. Detected complexes were stable in chelator-free buffer but were disrupted by treatment with 1,10-phenanthroline or citrate. Titrating FTS with additional NiSO4 suggested that the total nickel-binding capacity of cytosol is approximately 20–45 μM. Members of the LNiP are probably in rapid equilibrium. Previously reported binding constants to various metalloregulators may have overestimated the relevant binding strength in the cell because aqueous metal salts were used in those determinations. The LNiP may serve as both a Ni reservoir and buffer, allowing cells to accommodate a range of Ni concentrations. The composition of the LNiP may change with cellular metabolism and nutrient status.
Keywords: hydrogenase, metal trafficking, NikA, NikR, RcnR, nickel reservoir, nickel buffering
Graphical Abstract
INTRODUCTION
Nickel has novel redox and catalytic properties that allow Escherichia coli and other prokaryotes to grow in diverse environments that are inaccessible to humans and other mammals. This facultative anaerobe contains 4 [Ni-Fe] hydrogenases, which allow it to respire anaerobically.1 The NikABCDE transport system specifically imports nickel from the environment (Figure 1). Soluble NikA is located in the periplasmic space and binds Ni2+(L-Histidine)2.2,3 Nickel may also be imported nonspecifically through the magnesium transporter CorA. Cytosolic Ni binds the HypA/HypB chaperone complex, which inserts the metal into a partially assembled [Ni-Fe] hydrogenase active-site. Aqueous Ni(II) ions bind this chaperone with nM affinity.4 Many details of nickel trafficking are unestablished, but a nonproteinaceous labile nickel pool (LNiP) is likely involved.2,3,5 This pool is thought to involve metabolites such as glutathione (GSH) or histidine (His) as ligands to Ni. GSH is a particularly appealing as a ligand because of its high (mM) concentration in the cytosol and high affinity for coordinating transition metals (logβ for Ni = 11–20).5 Nickel homeostasis in E. coli involves two DNA-binding metalloregulatory proteins, NikR and RcnR; NikR controls Ni import whereas RcnR controls Ni export; both bind aqueous Ni ions with nM affinities.6,7 The Kd for Ni binding to the InrS metalloregulator in cyanobacteria is in the pM range, again determined using aqueous nickel as a titrant.8 The proper functioning of these metalloregulators in Ni homeostasis is thought to require that the concentration of the LNiP be in the same nM or pM range, far less than one Ni atom per cell.
Figure 1. Proposed Ni trafficking scheme in E. coli.
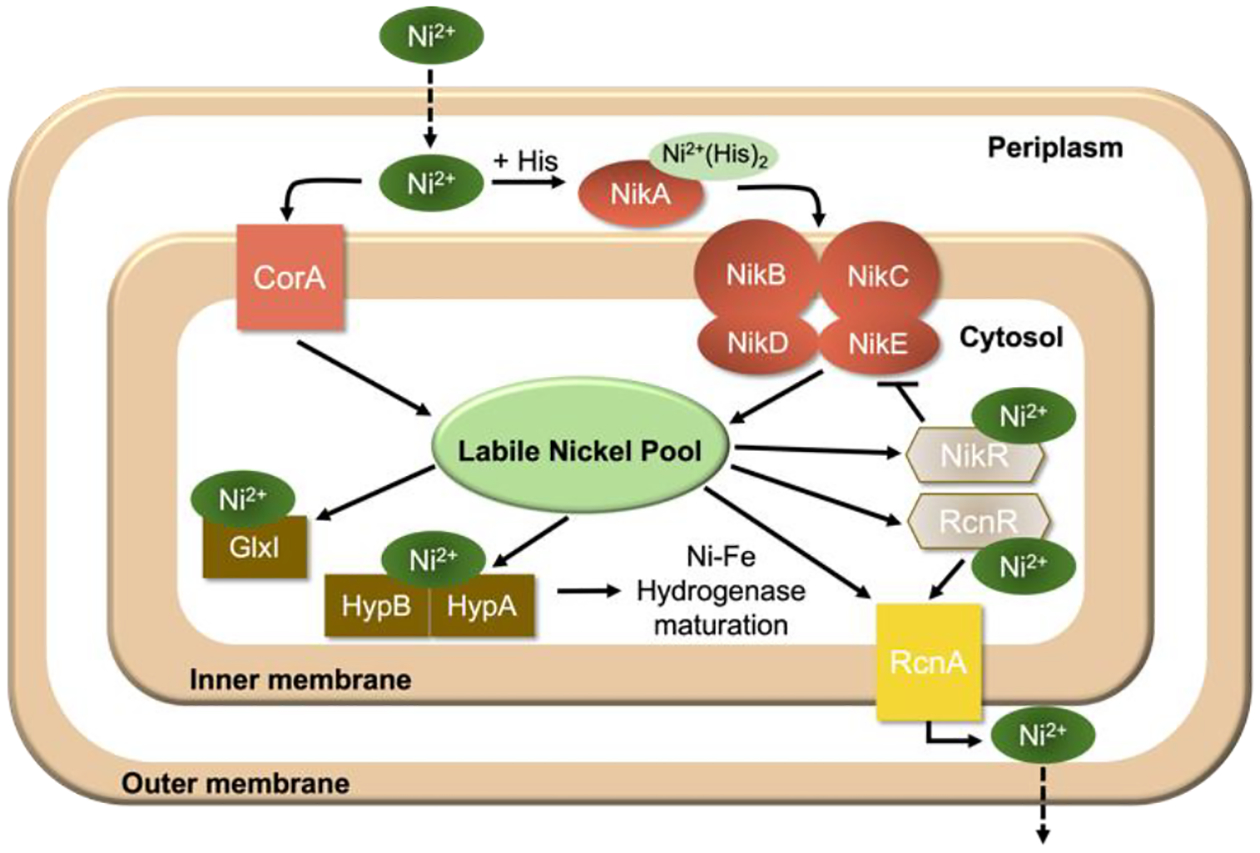
Ni enters the periplasmic space where it is transported into the cytosol through the NikABCDE import system under anaerobic conditions, presumably as Ni2+(His)2. Once in the cytosol, Ni is trafficked into a labile nickel pool (LNiP). The LNiP serves as a Ni(II) source for various Ni-containing chaperones (dark brown) and for transcription factors NikR and RcnR. Under replete conditions, the Ni-bound metallosensor NikR represses transcription of the NikABCDE import system whereas RcnR derepresses transcription of Ni exporter, RcnA.
We aim to detect, identify, and characterize labile metal pools (LMPs) in biological cells using liquid chromatography. These pools are more typically studied using fluorescence-based chelator probes that are selective for a particular metal.9,10 Such probes penetrate intact cells without disrupting them, but they destroy the sought-after endogenous metal complexes during detection. Chromatography-based methods disrupt cells, but they have the potential to separate, identify, and characterize the endogenous metal complexes that compose these labile pools. Given the inherent lability of these pools, isolating endogenous LMP complexes without altering them is a major problem. We have developed methods to deal with and/or minimize this problem but have not been able to eliminate it entirely. Our LC is in a refrigerated anaerobic glove box attached online to an ICP-MS. In this study, we utilized a custom strain of E. coli whose cells can be lysed by simple freeze-thaw, thereby eliminating the need for EDTA, a common chelator of metals.11 Cell lysates were filtered using a 3 kDa cutoff membrane, and the FTSs, which should contain LMP complexes, were subjected to LC using ICP-MS for metal detection and to ESI-MS for molecular characterization. Collected LC fractions were also characterized by ESI-MS. The SEC columns employed were pre-loaded with 67ZnSO4 to minimize other metal interactions.11
We targeted the LNiP of E. coli because large quantities of FTS could be obtained and because the cells are easily grown. Also, water-exchange rates of aqueous Ni(II) ions are slower than those of other aqueous divalent transition metal ions12 and so complex lability was anticipated to be less problematic. Additionally, Ni(II) ions adsorb less tightly to the SEC column than Zn(II) or Cu(II) ions11 potentially making our results more easily interpretable. Here we report the direct detection and characterization of the LNiP in E. coli and suggest a new perspective on such pools and their roles in biology.
EXPERIMENTAL
Cell growth:
Eleven batches of MG1655-pZa31mycR cells10 were cultured aerobically in 50 mL of M9 media containing 0.4% (w/v) glucose and 1 mM chloramphenicol (Sigma-Aldrich) overnight at 37 °C with 200 rpm shaking. NiSO4 (1 μM) was added to the growth medium of one batch. Grown cultures were transferred to 1 L of media and harvested aerobically at mid-exponential phase (OD600 ~1). Anaerobic cultures (3 batches) were transferred to 1 L of media in a 2 L round bottom flask that was then sealed, bubbled with N2 gas, and incubated as above with 100 rpm shaking. Cells were harvested anaerobically in mid-exponential phase at OD600 ~ 0.2. Three additional batches were grown anaerobically with 1 μM NiSO4 (Sigma-Aldrich) and 400 μM l-histidine (MP Biomedicals) added to media. All amino acids used were the L stereoisomer. Cytosol and FTS were isolated as described.11
Standards and pseudo-FTS:
A solution mimicking cytosol was prepared in 20 mM ammonium acetate (AA) (Sigma-Aldrich) pH 6.5 containing (final concentrations) 2 mM Na(citrate) (Fisher Chemical)13, 5 mM GSH (Sigma-Aldrich)14, 500 μM GSSG (Sigma-Aldrich)15, 5 mM Na2ATP (Sigma-Aldrich)16, 500 μM NaADP (Sigma-Aldrich)16, 200 μM Na2AMP (Sigma-Aldrich)16, 100 μM cysteine (Sigma-Aldrich)17, 50 mM Na(glutamate) (Sigma-Aldrich)13, 5 mM aspartate (MP Biomedicals)13, 70 μM histidine13, 5 mM Na2PO4 (Sigma-Aldrich)18, and 3 kDa-filtered Na(polyphosphate) (Sigma-Aldrich)18. The composition of the pFTS was designed to mimic the potential Ni-binding ligands in the cytosol and near to cytosolic concentrations. The pFTS had lower salt concentration and lacked species that were considered unlikely ligands to Ni. Individual standard nickel complexes were prepared by mixing NiSO4 and stock solutions of individual ligands (previously described in ref. 10) to a final concentration of 2 μM Ni and various desired, final concentrations of the ligand. Standards were prepared fresh on the day of analysis and stored anaerobically at 5 – 10 °C prior to injecting them onto columns.
Chromatography:
SEC-ICP-MS was performed on a single Superdex® Peptide 10/300 GL (Cytiva) SEC column housed in an anaerobic glovebox at 5–10 °C. The column eluent flowed into an online Agilent 7700x ICP-MS. The mobile phase used for SEC was 20 mM AA pH 6.5 had been filtered and degassed prior to LC use. Other experiments were performed on two such columns connected in series. 50 and 100 μL injections were made for the single and double columns for which the mobile phase flowed at 0.6 mL/min and 0.25 mL/min, respectively. Columns were zinc-loaded as described.11 Additional instrumentation parameters for SEC-ICP-MS can be found elsewehere.11
HILIC-ICP-MS was performed on a SeQuant® 4.6×150 mm (3.5 μm) ZIC®-HILIC column (Merck KGaA, Darmstadt, Germany) equilibrated in 90% acetonitrile) (HPLC grade, Fisher Chemical)/10% 10 mM AA (LC-MS grade) pH 6.5 for 30 min at a flow of 0.5 ml/min prior to analyses. Both mobile phases were filtered and degassed as described.11 Samples were diluted 5× and standards were diluted 10× or 20× with acetonitrile prior to injection (20 μL). A 90% → 40% linear acetonitrile gradient was passed through the column over a 20 min period. The ICP-MS was outfitted with Pt sampler and skimmer cones, a brass lenses base, and a 1.0 mm diameter torch. The plasma tune-parameters were: forward power, 1600 W; sample depth, 8.0 mm; nebulizer gas flow, 0.55 L/min; option gas (20% O2/ 80% Ar), 25%; spray chamber temperature, −5 °C; make-up gas flow, 0.1 L/min. Designated peaks were simulated with Fityk (fityk.nieto.pl) employing the Levenberg-Marquardt algorithm with a built-in Gaussian function.
Samples were analyzed at RT using a Thermo Scientific Q Exactive Focus MS coupled with an HPLC (Ultimate 3000 RS) not in the glovebox. Samples (20 μL) were injected onto the same column for HILIC-ICP-MS analyses. The same gradient and flow rate were applied, but the aqueous mobile phase consisted of 10 mM AA pH 7.1. The Q Exactive Focus HESI source was operated in full MS (100 – 1000 m/z) in positive and negative modes. Mass resolution was tuned to 70,000 FWHM at m/z 200. Spray voltage was 3.75 kV for positive mode and 2.80 kV for negative mode. Sheath gas and auxiliary gas flows were 35 and 10 arbitrary units, respectively, for positive mode. For negative mode, sheath gas and auxiliary gas flows were 40 and 10 arbitrary units, respectively. Transfer capillary and auxiliary gas heater temperatures were 275 and 320 °C, respectively for positive mode. In negative mode transfer and auxiliary gas heater temperatures were 320 and 350 °C, respectively. The S-Lens RF level was 50 V in both polarities. Exactive Series 2.8 SP1/Xcalibur 4.1 software was used for data acquisition and processing. Mass accuracy was ± 2 ppm.
Elemental analyses:
Seven calibration standards were prepared with ICP-MS-ISC-2 stock (high-purity standards) for Ni analyses. The most concentrated stock solution contained 20 mg/L of nickel. The remaining standards in the series were obtained by diluting the previous standard 10×. The final concentration of trace-metal grade HNO3 in each standard was 0.5% except for the stock solution which was 2% (prepared with high-purity standards). Two blanks of 0.5% HNO3 accompanied this standard set. An internal standard solution, IV-ICPMS-71D (Inorganic Ventures), was prepared in 0.5% HNO3. For elemental analysis, 3 aliquots (100 μL) of lysate, cytosol, and FTS from each batch were transferred into 15 mL polypropylene centrifuge tubes (Corning). Five hundred μL of 5% HNO3 was added to each tube. Tubes were capped, sealed with electrical tape, vortexed, and incubated at 80 °C for 24–48 hrs, depending on sample type. Samples were cooled to RT and diluted to 5 mL with high-purity water. Resulting solutions were analyzed by ICP-MS in collision mode with 3.6 mL/min He flow. To back-calculate metal concentrations of samples, the wet-cell pellet mass and reported density of E. coli (1.105 g/mL)19 were used along with an estimated packing efficiency of 0.7220 and a cytosolic fractional volume of 0.61.21,22
ESI-MS:
Ni-GSH-GSSG standards were prepared by mixing 10 μM of NiSO4 with 5 mM GSH and 250 μM, 500 μM, or 1 mM GSSG (final concentrations) in high purity water, 20 mM AA pH 6.5, or 20 mM ammonium bicarbonate (ABC) (Sigma-Aldrich) pH 7.2. Standards were diluted 20× in methanol (LC-MS grade, Fisher Chemical) prior to ESI-MS direct injection. Other samples and standards were prepared as described.11 These standards and samples were analyzed using a Thermo Scientific Q Exactive Focus MS. Samples were injected using a 10 μL loop with methanol as a mobile phase and at a flow rate of 300 μL/min. Spray voltage was 3.5 kV for positive mode and 3.3 kV for negative mode. Sheath gas and auxiliary gas flow rates were 7 and 0 arbitrary units, respectively. Transfer capillary temperature was held at 270 °C and the S-Lens RF level was 50 V. Other conditions were as above.
DFT:
The proposed geometry of Ni-GSSG was based on the structure proposed by Ágonston et al.23 The geometry was optimized to a local minimum (no imaginary frequency) in water with the SMD model using the combination of B3LYP functional with 6–31G(d) basis sets for C, H, O, N, S atoms and 6–311+G(d) for Ni with Gaussian 16, rev C01.24 GaussView was used for visualization. Other suggested chemical structures were created using ChemDraw 20.1. but were not DFT optimized.
RESULTS
FTS includes 4 – 5 labile nickel complexes:
Cytosol was isolated from 10 batches of E. coli that had been grown aerobically, and FTSs were collected. Efforts were taken to isolate cytosol without causing Ni to dissociate from Ni-bound proteins (no chelators were added to isolation buffers and the procedure was carried out quickly - within a few hrs). The resulting solutions contained 11 ± 4 μM Ni, which corresponded to nearly all Ni in the cell (Table S1). Similar E. coli Ni concentrations (3–10 μM) have been reported.25,26 SEC chromatograms of aerobic FTSs included 4 Ni peaks in the low-molecular-mass (LMM) region (Figure 2A offset), called Ni-A, Ni-B, Ni-C, and Ni-D. These peaks were simulated (Figure 2A, grey lines) using parameters in Table S2. Respective average percent intensities were 14 ± 6%: 76 ± 5%: 8 ± 1%: 2.3 ± 0.3%, suggesting cytosolic concentrations of 1.5, 8.4, 0.9, and 0.3 μM, respectively. About 20% of the Ni in FTSs adsorbed onto our zinc-loaded columns, which added additional uncertainty. FTSs exhibited 2 major sulfur-detected peaks and numerous phosphorus-detected peaks in the same region (Figure S1).11 One S peak comigrated with Ni-A, suggesting that this Ni complex was coordinated by a sulfur-containing ligand. The other S species migrated in the vicinity of Ni-B/Ni-C. The LMM sulfur pool in E. coli is composed of GSH, GSSG, methionine, and Cys with respective concentrations of 3, 0.4, 0.8, and 0.2 mM.11 These metabolites were considered potential ligands to Ni.
Figure 2. SEC-ICP-MS (single column) detection of the labile nickel pool in E. coli.
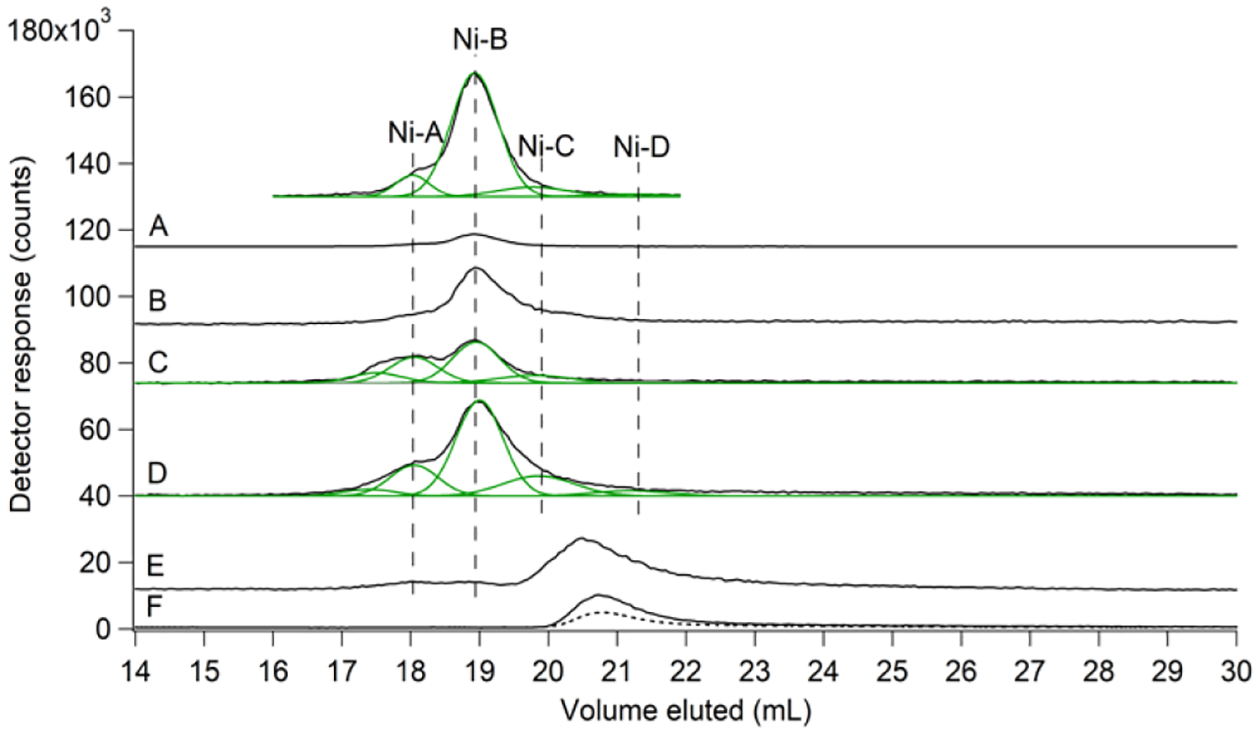
Ni (black) traces for: (A), FTS from a representative batch of cells that were grown aerobically in un-supplemented medium. Offset is (A) ×10 with simulations of peaks Ni-A…Ni-D overlaid in green; (B), FTS from cells grown aerobically in medium supplemented with 1 μM NiSO4 (×3); (C), FTS from cells grown anaerobically. A 5-peak simulation is overlaid in green (×3); (D), FTS from cells grown anaerobically in medium supplemented with 1 μM NiSO4 and 400 μM histidine. A 5-peak simulation is overlaid in green (×3); (E), same as (A) but with 100 μM 1,10-phenanthroline (final concentration) added to the FTS; (F), Standard of 2 μM NiSO4 + 20 μM 1,10-phenanthroline. Dashed line in (F) is Abs at 260 nm (×1000). Vertical dashed black lines represent positions of Ni-A…Ni-D according to simulations in (A). Throughout this paper, ×# indicates that the detected signal response was multiplied #-fold.
Cytosol was also isolated from the batch of cells grown under aerobic conditions and with the medium supplemented with NiSO4. The resulting LC trace (Figure 2B) exhibited approximately the same peaks but with greater intensities, consistent with an increased pool size in Ni-supplemented cells.
We examined anaerobically grown cells to investigate whether O2 affected the LNiP. The Ni concentration in FTS from such cells was slightly higher (15 ± 2 μM) but again corresponded to most Ni in the cell. Ni elution volumes were similar to those of Ni-A…Ni-D observed in Figure 1, A and B, but peak intensities differed and a fifth species was evident at ~17.2 mL (Figure 2, C and D). Ni intensities were higher in FTS from cells grown in medium supplemented with NiSO4 (compare Figure 2, B vs. A) and even higher when both NiSO4 and His were added to the growth medium (Figure 2D and Table S1). Detected Ni complexes were labile, as evidenced by their decline when 1,10-phenanthroline, a strong Ni(II) chelator, was added to FTS, coincident with development of a single peak that comigrated with [Ni(phen)3]2+ (Figure 2, E and F).
Metal binding capacity of FTS:
Similar Ni peaks were observed after titrating NiSO4 into FTS, but overall intensities were higher and relative intensities changed (Figure 3); specifically the relative intensities of Ni-B, Ni-C, and Ni-D increased while that of Ni-A decreased. This suggested that the product of the Ni-ligand (L) binding constant, Ka, and the free-ligand concentration (i.e. Ka·[L]) might be greater for Ni-B, Ni-C, and Ni-D ligands than for Ni-A. The FTS (and by extension, the E. coli cytosol) undoubtedly contains excess Ni-binding ligands since the intensity of these Ni peaks increased during titration. The observed “bowing” at elution volumes 21–30 mL reflected aqueous Ni(II) ions (see below) and was due to extensive interactions with the column. The first appearance of bowing in the titrations suggested that the total nickel-binding capacity of the LNiP in the cytosol (after adjusting for dilution of the cytosol in obtaining the FTS) was 20–30 μM for aerobically-grown E. coli and > 40 μM for anaerobically-grown cells. During the titration, aqueous Ni(II) ions coordinated quickly (in less than a few min) to these ligands.
Figure 3. Nickel binding capacity of aerobic and anaerobic LNiP.
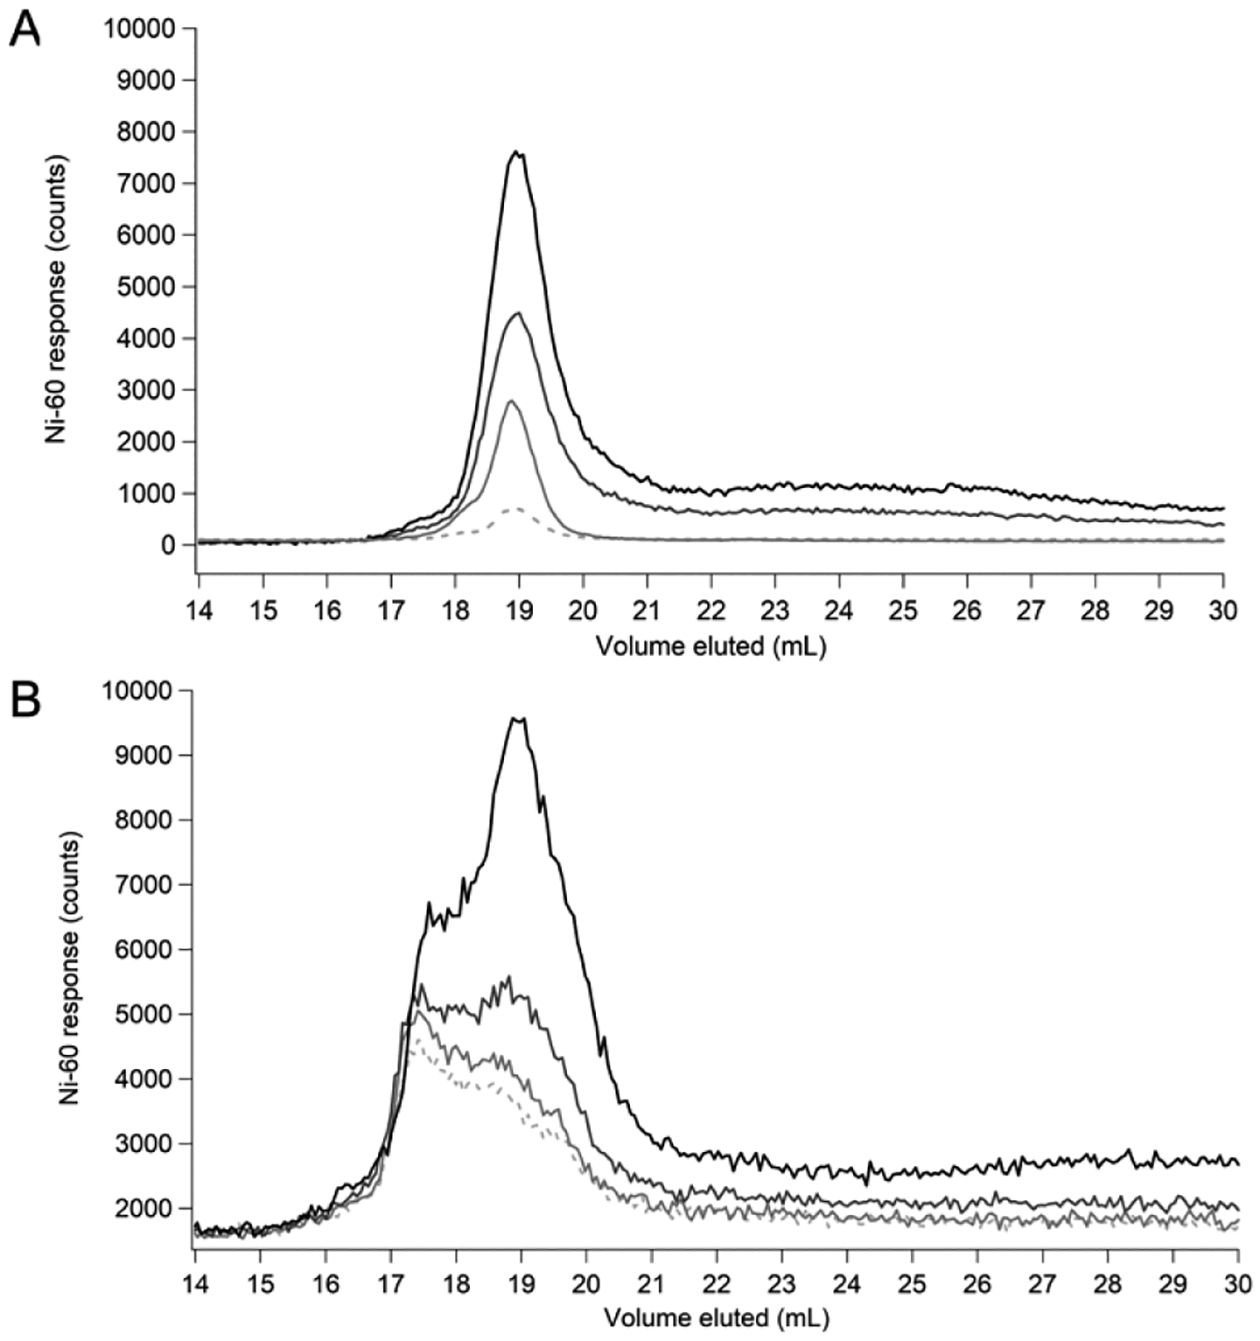
Representative FTS spiked with 0 (dashed), 1 (light grey), 2 (grey), or 5 (black) μM NiSO4 from (A) aerobically- and (B) anaerobically-grown cells.
Labile Ni complexes in FTS are not “free” aqueous Ni(II) ions:
Aqueous Ni(II) ions elute on the SEC columns as broad peaks with tailing.11 The observed elution volume depended on column conditioning as well as the mobile phase. In Figure 4A, they eluted at 25–33 mL. Highly stable complexes eluted at lower elution volumes and as sharper peaks. Ni peaks associated with very stable complexes did not shift as ligand concentrations increased (and Ni concentration remained fixed) whereas such shifts characterized metal-ligand complexes of intermediate stability.11
Figure 4. Chromatographic behavior of nickel standards.
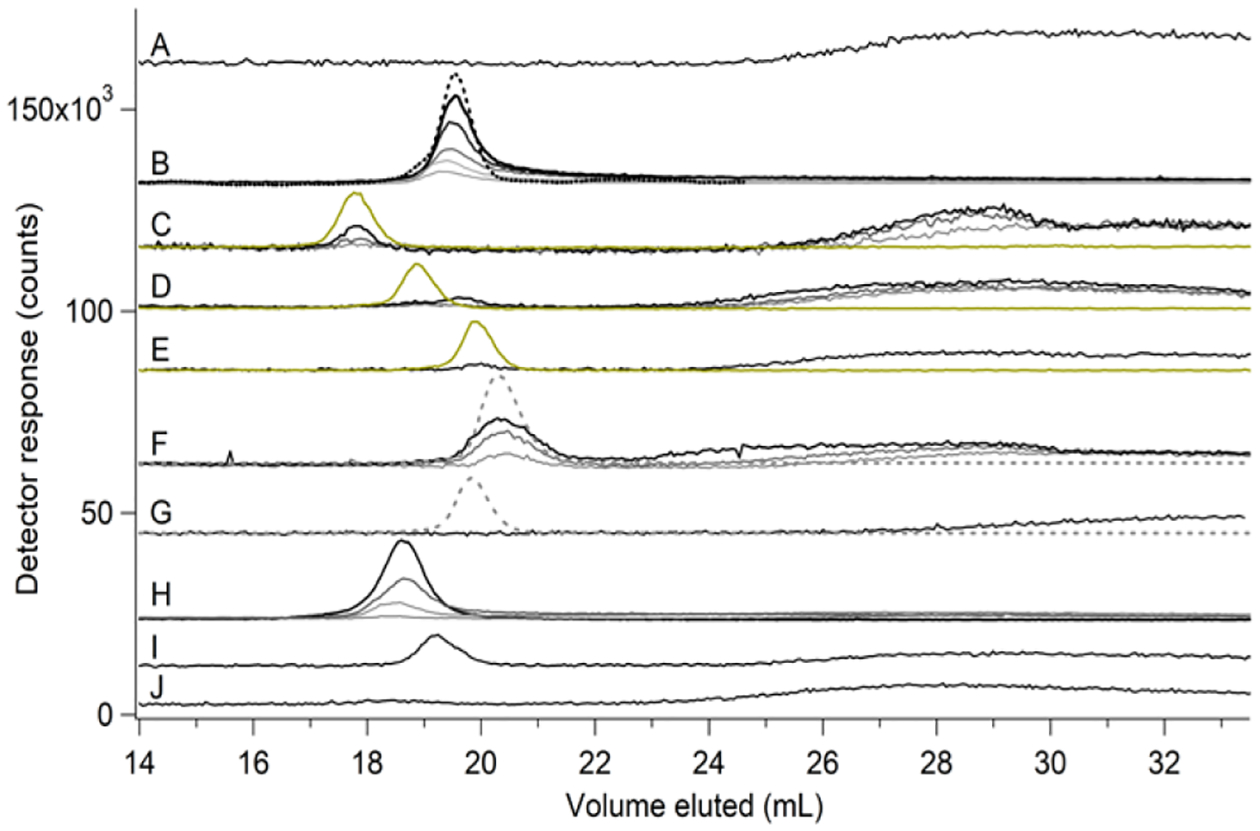
Ni-, S-, and P-detected traces are black, yellow, and grey-dashed lines, respectively, for solutions of 2 μM NiSO4 and the following ligands in mobile phase buffer (all final concentrations): (A), nothing (×10); (B), histidine (from lightest to darkest) at 25, 50, 100, 500, and 1000 μM (×2); the black-dashed line is Abs at 210 nm (×600); (C), GSSG at 1 mM (light), 5 mM (darker) with S trace (×0.25), and 10 mM (darkest) (×5); (D), GSH at 1 mM (light), 5 mM (darker) with S trace (×0.5), and 20 mM (darkest) (×5); (E), cysteine at 5 mM with S trace (×0.5) (×5); (F), ATP at 1 mM (light), 5 mM (darker) with P trace (dashed, ×0.015), and 10 mM (darkest) (×5); (G), KH2PO4 at 500 μM with P trace (dashed, ×0.025) (×5); (H), citrate (from lightest to darkest) at 100, 500, 1000, and 5000 μM; (I), aspartate at 5 mM (×5); and (J), glutamate at 5 mM (×5).
When aqueous Ni(II) ions were mixed with the amino acid histidine, a sharp peak was observed at elution volume 19.5 mL (Figure 4B). This indicated that His coordinated aqueous Ni(II) ions, forming a Ni-His complex, likely Ni(His)2.27 Due to uncertainty as to the exact composition of this and other complexes, we refer to complexes as Ni-Ligand (e.g. Ni-His) when detected by ICP-MS, but more precisely, as possible, when detected by ESI-MS (e.g. Ni2+(His)2). The complex that resulted when NiSO4 was mixed with GSSG eluted at 17.5 mL (Figure 4C), similar to the elution volume of Ni-A. Some Ni in that solution eluted as a broad peak indicating aqueous Ni(II). The intensity of the 17.5 mL peak increased with increasing [GSSG] while that associated with aqueous Ni(II) simultaneously decreased. This indicated formation of a stable Ni-GSSG complex but one that was not as stable as Ni-His.
The stability of Ni-GSSG was surprising since the GSSG ligand had not been considered as a component of LMPs. At the start of this study, GSH was our primary candidate for a LNiP ligand, but surprisingly, the Ni-GSH complex did not exhibit exceptional stability or dominance. A solution of NiSO4 + GSH exhibited a low-intensity Ni peak but only using a high concentration of GSH (20 mM); also, there was significant bowing in the aqueous Ni(II) region (Figure 4D). A solution of NiSO4 + Cys exhibited similar weak-binding complex formation (Figure 4E). NiSO4 + ATP exhibited a more intense Ni peak at 20.5 mL, which comigrated with P, indicating formation of a reasonably stable Ni-ATP complex (Figure 4F). The remaining Ni eluted similarly to aqueous Ni(II) ions but shifted to lower elution volumes at higher ATP concentrations. This behavior suggested stronger complexes and less column interactions than with aqueous Ni(II). A standard solution composed of NiSO4 + citrate exhibited an intense Ni peak at 18.5 mL elution volume, and with little bowing (Figure 4H). Slight bowing was evident when [citrate] < 1 mM, indicating that the Ni-citrate complex was less stable than Ni-His. NiSO4 + Asp formed a relatively strong complex (Figure 4I), but NiSO4 + KH2PO4 (Figure 4G) and Glu (Figure 4J) did not.
In the absence of Ni, potential ligands GSH, GSSG, His, ATP, NaH2PO4 (or K2HPO4) migrated with the same elution volume as when they were coordinated by Ni, indicating that the SEC column could not resolve Ni-bound complexes from the corresponding free ligands. This suggested that the elution volume of the complex was determined mainly by the properties of the ligand; the metal “came along for the ride.” Based on this chromatographic behavior, the apparent binding interactions between aqueous Ni(II) ions and these ligands could be ranked from most stable to least stable as follows:
Since the LMM Ni species in FTS migrated as sharp peaks and at lower elution volumes compared to aqueous Ni(II) ions, and since there was no evidence of bowing, we conclude that the endogenous LMM labile nickel complexes in E. coli cytosol are relatively strong binding; none are aqueous or “free” nickel ions. The detected Ni complexes in FTS are comparable in binding strength to Ni complexes with His, citrate, Asp, GSSG, and ATP ligands based on observed chromatographic behavior.
Initial assignments of the labile nickel pool:
Given that the elution volumes of the Ni(II) standards were comparable to those of Ni-A…Ni-D, we wondered whether they might be related. To investigate, we added each ligand into the FTS. When GSSG was added, the Ni-A intensity increased. When Asp was added, Ni-B increased. When His was added, Ni-C increased, and when ATP was added, Ni-D intensity increased (Figure 5). Surprisingly, when GSH was added to the FTS, there was no significant change in FTS speciation (Figure S2). These results suggested the assignments: Ni-A = Ni-GSSG, Ni-B = Ni-Asp, Ni-C = Ni-His, and Ni-D = Ni-ATP. When citrate was added, the Ni-A…Ni-D peaks were replaced by an intense peak at ~18.5 mL (Figure 5F). This suggested that Ni-citrate was not a major component of the LNiP, but it demonstrated that this ligand can “commandeer” Ni from the labile pool.
Figure 5. Nickel-detected SEC-ICP-MS (single column) traces of FTS after adding candidate ligands.
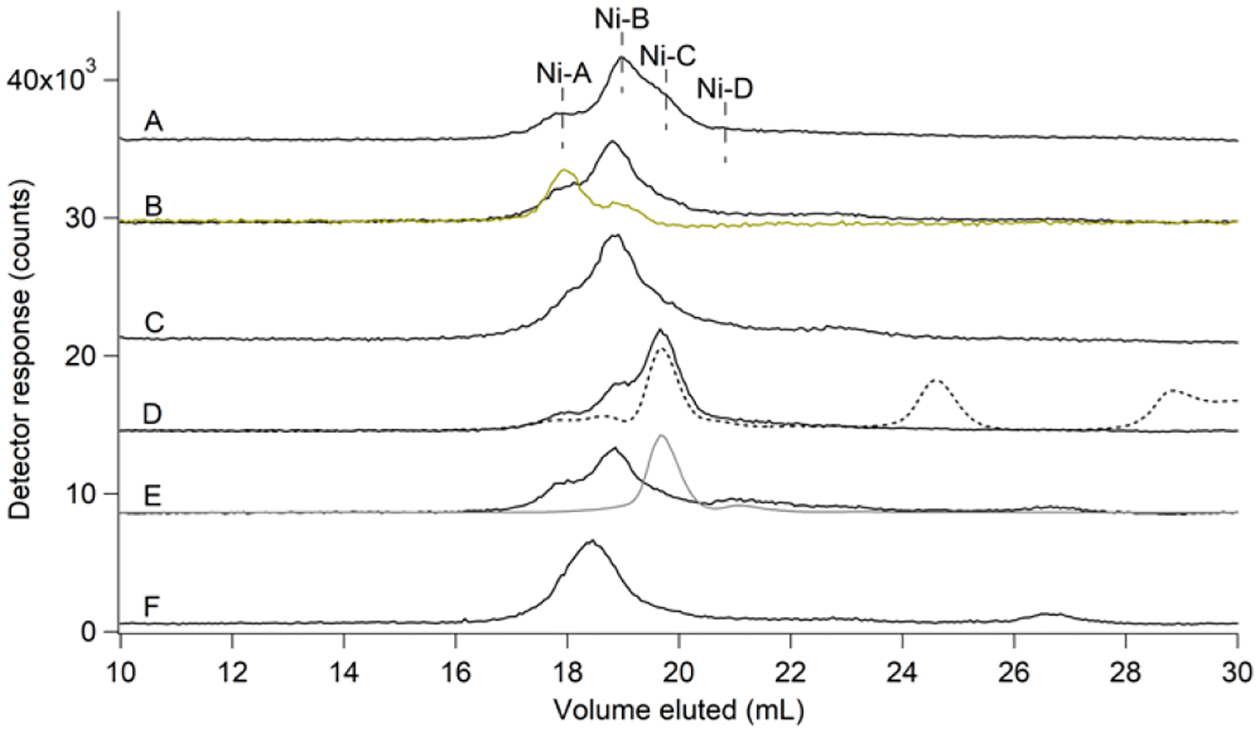
Ni (black) trace for (A), FTS with Ni peaks indicated; (B) – (F), same as plus (A) 1 mM of: (B), GSSG (S trace in yellow); (C), Asp; (D), His (dashed line is Abs at 210 nm ×15); (E), ATP (P trace in grey, ×0.05); and (F), citrate.
The double SEC column improved resolution:
FTS was passed through two SEC columns placed in series. Run-times were slower than the single column (3.5 vs. 1 hr), but resolution from salts, which suppress ESI-MS signals, was improved.10
Four major and perhaps 2 minor Ni peaks were evident (Figure 6A and Figure S3); relative intensities for the major peaks were 7:6:72:15 in one aerobic FTS replicate. Some Ni(II) standards eluted at volumes other than those expected based on results from the single column, such that Ni-A…Ni-D could not be assigned straightforwardly. Slight differences in column material and/or zinc-loading may have caused these differences. However, 3–4 major peaks were always observed, with the peak that eluted at ~ 36 mL, assigned to Ni-B, generally most intense (Figure S3).
Figure 6. SEC-ICP-MS (double column) chromatograms of FTS, pFTS, and standards.
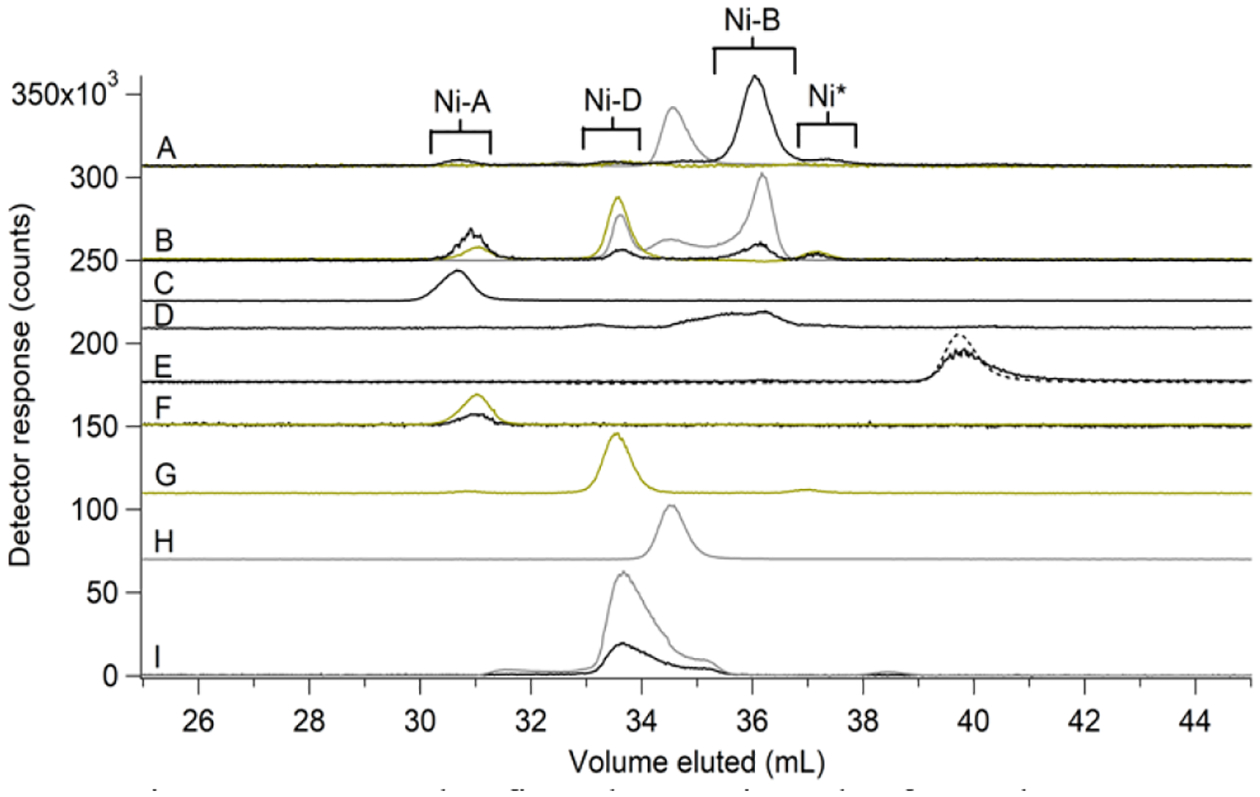
(A), FTS; (B), pFTS; (C-I), standards. (A), Ni (black, ×3), S (yellow, ×3), and P (grey, ×0.25). Brackets indicate Ni-containing fractions collected for ESI-MS analysis. Ni* represents an unassigned Ni-containing peak. (B), Ni (×3), S, and P (×0.05) traces for 2 μM NiSO4 added to the pFTS; (C) – (I), 2 μM NiSO4 plus: (C), 2 mM citrate; (D), 5 mM Asp (×5); (E), 1 mM His (×3). Green dashed line is Abs at 210 nm (×25); (F), 5 mM GSSG (×10) with S trace (×0.25); 0 μM NiSO4 plus: (G), S trace of 5 mM GSH; (H), P trace of 500 μM NaH2PO4 (×0.5); 2 μM NiSO4 plus: (I), 5 mM ATP (×5) with P trace (×0.05).
Pseudo flow-through-solution (pFTS) exhibited similar Ni peaks as FTS:
We prepared pFTS to mimic the FTS except for having a lower salt concentration (and not including species that were unlikely ligands to Ni). Remarkably, pFTS traces exhibited 4 Ni peaks that approximately comigrated with Ni-A…Ni-D (Figure 6B). By analyzing individual Ni(II) standards on the double column (Figure 6, C–I), the first three Ni peaks from the FTS were assigned, from left-to-right, as Ni-GSSG, Ni-ATP, and Ni-Asp. Ni-His could not be assigned.
ESI-MS Identification:
A low-intensity ESI-MS peak corresponding to Ni2+(GSSG) was observed in the Ni-A fraction of FTS (Figure S4A). When FTS was spiked with 5 μM of NiSO4 prior to separation on the double column, the ESI-MS peak corresponding to Ni2+(GSSG) became more intense. When 2 μM NiSO4 was added to the Ni-A fraction, the full nickel isotopologue signature of Ni2+(GSSG) was observed. No other Ni(II) complexes were observed in the ESI-MS spectra of the Ni-A fraction or in other Ni-containing fractions, possibly due to the greater dilution associated with the double column. The ESI-MS results confirmed the assignment Ni-A = Ni2+(GSSG).
Since the Ni-GSSG standard “held together” down the SEC column, the Ni2+(GSSG) complex in the FTS must have done the same, implying that it is a component of the LNiP in E. coli cytosol. Ni2+(GSSG) was also detected in FTS after lyophilization followed by chromatography on the double column, indicating that the complex had considerable stability (Figure S3B). Ni-A, Ni-B, and Ni-D fractions from pFTS were analyzed by ESI-MS, and Ni2+(GSSG), Ni2+(Asp)2, and Ni2+(ATP) were detected (Figure S5) and assigned, respectively. Moreover, the abundance of each species in the pFTS, according to ESI-MS signal intensities, was proportional to their ICP-MS intensities in double-column chromatograms, with Ni2+(GSSG) > Ni2+(Asp)2 > Ni2+(ATP).
HILIC of FTS and pFTS:
HILIC separates molecular species according to different physical properties than those of SEC, and so we used it as a complementary method to investigate the LNiP. Multiple Ni peaks were observed in HILIC chromatograms, but resolution and S/N were modest (Figure 7, A and B). Ni(II) standards again comigrated with the peaks exhibited by the FTS, with Ni-GSSG most intense followed by Ni-His and Ni-Asp. A similar pattern of Ni peaks was observed in FTS from anaerobic cells, but the Ni-His peak was more intense and additional peaks were sometimes observed (Figure 7, C and D); the peak at ~ 9.5 mL did not comigrate with any standard analyzed but could be the fifth Ni peak detected in anaerobic FTSs by SEC-ICP-MS. HILIC chromatograms of Ni-GSH and Ni-citrate standards were also obtained (Figure 7, J and K), but they did not comigrate with any Ni peaks in the FTS. Chromatograms of Ni-GSSG, Ni-His, Ni-Asp, and Ni-ATP exhibited peaks as expected (Figure 7, F – I). Ni-GSSG was dominant in HILIC chromatograms of pFTS (Figure 7E); Ni-ATP and Ni-citrate were also observed.
Figure 7. HILIC-ICP-MS chromatograms of FTS and standards.
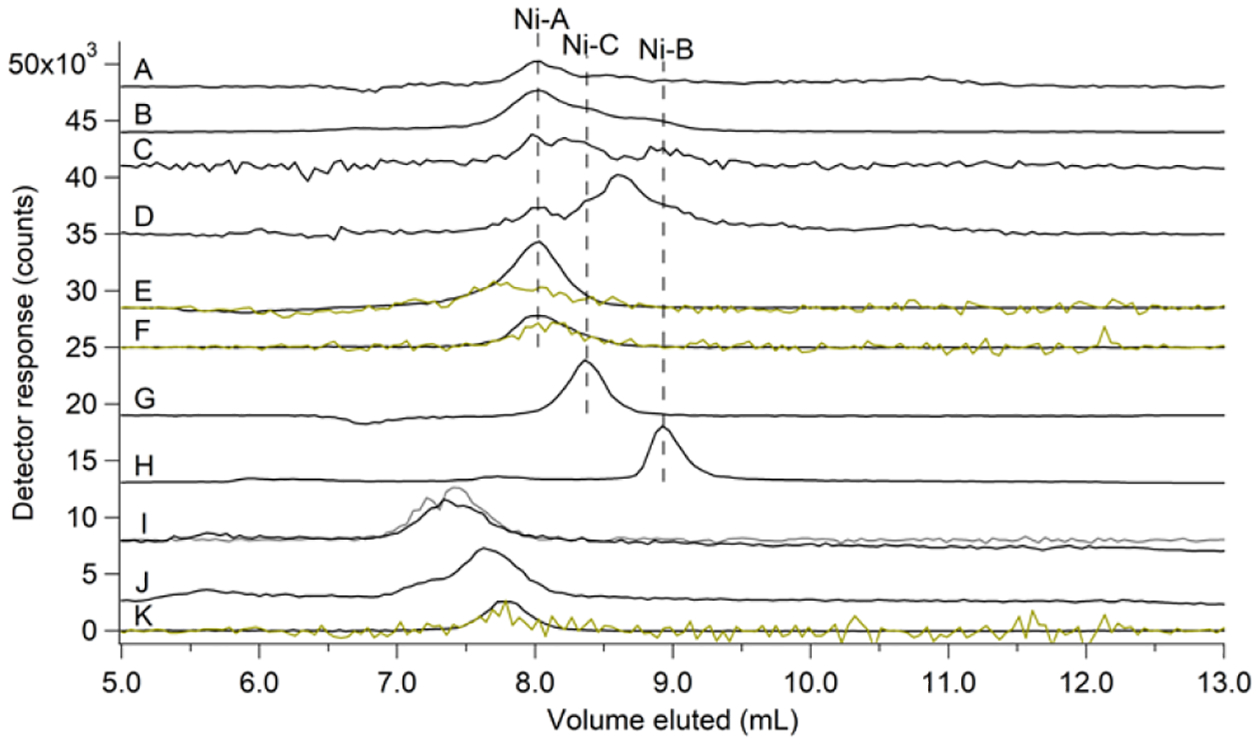
Ni (black) traces for: (A), average of 7 FTS replicates isolated from aerobically-grown cells (×10); (B), average of 2 lyophilized FTS replicates isolated from aerobically-grown cells; (C), average of 3 FTS replicates isolated from anaerobically-grown cells (×10); (D), average of 3 FTS replicates isolated from anaerobically-grown cells supplemented with 1 μM NiSO4 + 400 μM histidine in the growth media (×10); (E), pFTS (×0.5) with S (yellow, ×5); (F – L), Ni(II) standards composed of 1 μM NiSO4 plus the following ligands (all final concentrations): (F), 2 mM GSSG with S (yellow, ×5); (G), 1 mM His; (H), 2 mM Asp (×2); (I), 1 mM ATP (×3) with P (grey, ×0.25) trace; (J), 2 mM citrate (×2); and (K), 2 mM GSH with S (yellow, ×10). Dashed black lines represent position of nickel species according to standard comigration.
We then injected FTS onto the same HILIC column (not in the glovebox) with online ESI-MS detection. ESI-MS spectra were monitored at a selected m/z during a HILIC run to detect specific nickel complexes. Ni2+(GSSG) (m/z = 669.07894 predicted) was detected at m/z = 669.07732 (Figure 8A) in FTS. Once the range of elution times containing Ni2+(GSSG) was identified, the ESI-MS spectra obtained within the range were averaged; the resulting ESI-MS exhibited the full Ni2+(GSSG) isotopologue pattern (Figure 8B). Ni2+(His)2 (m/z = 367.06593 predicted) was similarly detected at m/z = 367.06527, albeit at lower intensity. The Ni2+(His)2 complex eluted at 20–21 min; the ESI-MS spectrum obtained by averaging during these times (Figure 8C) exhibited two isotopic peaks from this complex. Ni2+(Asp)2 (m/z = 323.00199 predicted) and Ni2+(ATP) (m/z = 563.92272 predicted) peaks were detected (m/z = 323.00124 and 563.92991, respectively) in some but not all replicates and at lower intensities (Figure 8, D and E). Again, only some of the isotopic peaks expected for these complexes were observed. These complexes eluted relatively early from the HILIC column (15–17 min, Figure 8A). Adding NiSO4 to the FTS caused peak intensities for the complexes to increase in the following order
These results suggested that Ni(II) in FTS preferred binding to GSSG, folloed by His, Asp, and ATP. Only Ni2+(GSSG) and Ni2+(His)2 complexes were detected in FTS isolated from anaerobically grown cells, perhaps because those batches were more dilute than FTSs from aerobic cells.
Figure 8. HILIC chromatogram with ESI-MS detection of FTS from aerobically-grown cells.
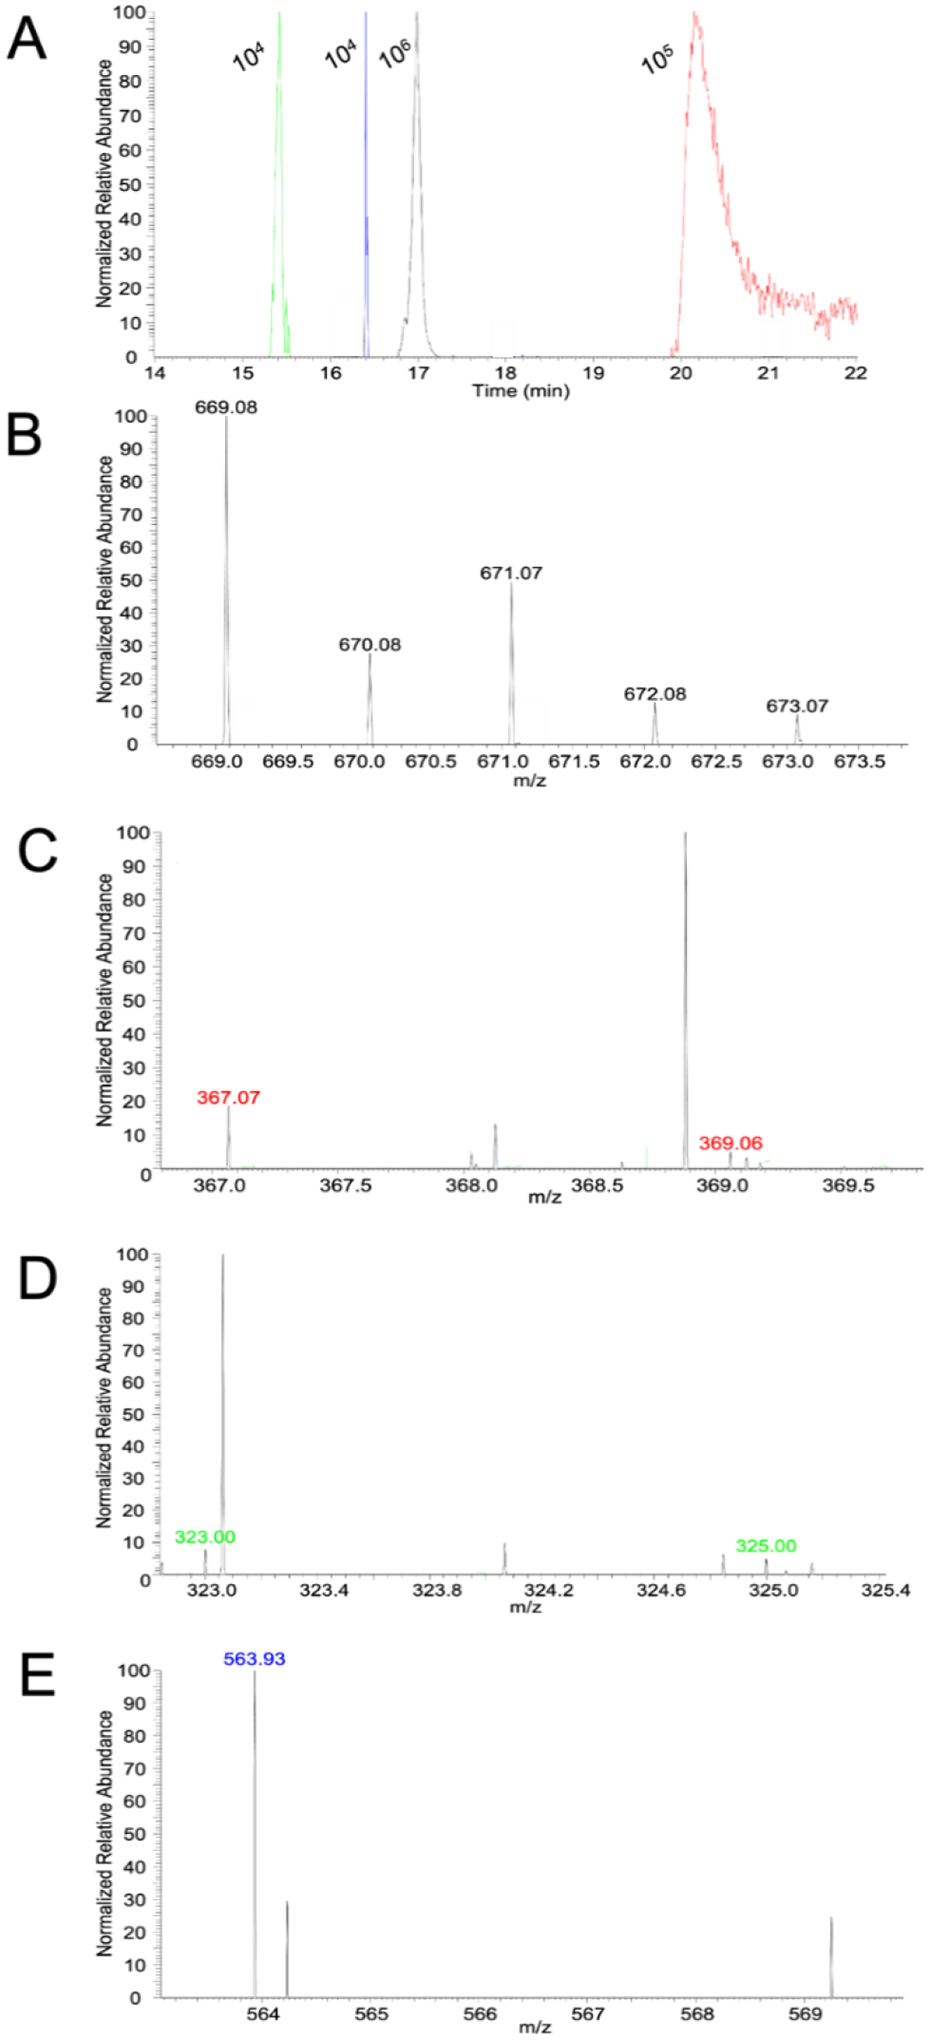
(A) HILIC chromatogram with ESI detection of: Ni2+(Asp)2 (green, m/z = 323.00 – 323.01), Ni2+(ATP) (blue, m/z = 563.92 – 563.93), Ni2+(GSSG) (black, m/z = 669.075 – 669.085), and Ni2+(His)2 (red, m/z = 367.06 – 367.07). Respective intensities area indicated. (B) – (E), positive mode ESI-MS singly-charged spectra corresponding to: (B), Ni2+(GSSG); (C), Ni2+(His)2; (D), Ni2+(Asp)2; (E), Ni2+(ATP). Spectra were obtained by signal-averaging over the entirety of the peaks in (A). Color-coded labels indicate the isotopologue peaks predicted by simulation and correspond to the colored chromatograms in (A). All labeled peaks in (B) are isotopologue predictions for Ni2+(GSSG).
One concern with HILIC was the need to dilute aqueous metal complexes in organic solvents prior to column-loading. To examine the possibility of solvent-induced ligand exchange, FTS was diluted 1.25×, 2×, and 5× in acetonitrile. Elution volumes of Ni peaks shifted relative to untreated FTS (Figure S6), and diluting Ni(II) standards caused similar shifts. However, ESI-MS of the shifted peaks verified that the original complexes remained intact. Shifts probably arose from solvent mismatch between sample and mobile phase rather than from ligand-exchange reactions.
GSSG and GSH compete for Ni(II) ions under near physiological conditions:
We prepared three solutions of NiSO4 mixed with 5 mM GSH and various (lower concentrations of GSSG) and subjected these solutions to HILIC-ESI-MS (Figure S7). Ni2+(GSSG) and Ni2+(GSH)2 were both detected (m/z = 671.09459 predicted for Ni2+(GSH)2; m/z = 671.09333 observed) in each solution at approximately equal intensities, indicating that complex detection was independent of the GSH/GSSG ratio within the range examined. These results suggested that under near physiological concentrations of GSH/GSSH and conditions (pH 7.1), Ni(II) ions bind both GSSG and GSH to similar degrees. Since FTS contained similar relative concentrations of these ligands, we are uncertain why Ni2+(GSH)2 was not observed in ESI-MS spectra of FTS whereas Ni2+(GSSG) dominated.
DISCUSSION
LMPs have historically been thought to represent a tiny proportion of the metal content of cells – only enough for trafficking and homeostatic regulation.28 Such miniscule concentrations were thought to minimize deleterious side-reactions. Previous estimates of the size of the LNiP were based on nM dissociation constants reported for Ni binding to transcription factors NikR and RcnR. For example, Musiani et al. suggested a cytosolic Ni concentration in E. coli of 10–500 nM.29 The proper functioning of these metalloregulators in Ni homeostasis seemed to require that the concentration of the LNiP be in the same nM range.8
Surprisingly, we found that most Ni in E. coli cells is present as the LNiP and with a concentration orders-of-magnitude higher than previous estimates. This apparent discrepancy can be explained by our demonstration that aqueous Ni(II) – erroneously called “free” Ni – is not a component of the LNiP and is not present in E. coli cells. The chromatographic behavior of aqueous Ni(II) ions is distinct and obvious – a broad bowing of Ni-detection at high elution volumes. Such bowing was not observed in any (un-spiked) FTS. Rather, the Ni complexes detected in FTS exhibited sharp peaks and lower elution volumes, indicating stabilities comparable to those of the standards tested.
Given this, previously reported Keq values obtained by titrating with aqueous Ni(II) ions may be unreliable. Titrations of NikR and RcnR, were performed using aqueous Ni(II) salts. This was reasonable at the time because the composition of the LNiP was unknown. Nevertheless, reported affinity constants likely overestimated the actual binding constants associated with the reactions occurring in the cell. We hypothesize that Ni is directly transferred from the LNiP complexes (indicated by L in the scheme below) to the acceptor protein (indicated by P) rather than through an aqueous Ni(II) intermediate. In chemical terms,
rather than
If so, the magnitude of the overestimate should be comparable to the Keq of aqueous Ni(II) ions binding the ligands associated with the LNiP (i.e. Kactual ≈ Kreported/KNi-L). The same situation might hold for other LMPs since similar titrations are routinely performed using aqueous metal salts.30 That metals might be transferred by an associative mechanism has been suggested previously.31 There is precedence for a one-step transmetallation reaction; e.g. a long-lived intermediate [Fe(citrate)(deferasirox)2] in the transfer of Fe from Fe(citrate)2 to defarasirox has been observed.32
The labile zinc pool in Bacillus subtilis seems to be organized similarly. The pool is dominated by Zn-bound bacillithiol, a LMM metal complex present at ~ 80 μM.33 In contrast, “free” Zn is present at ~ 2.5 pM, corresponding to far less than one Zn atom per cell.
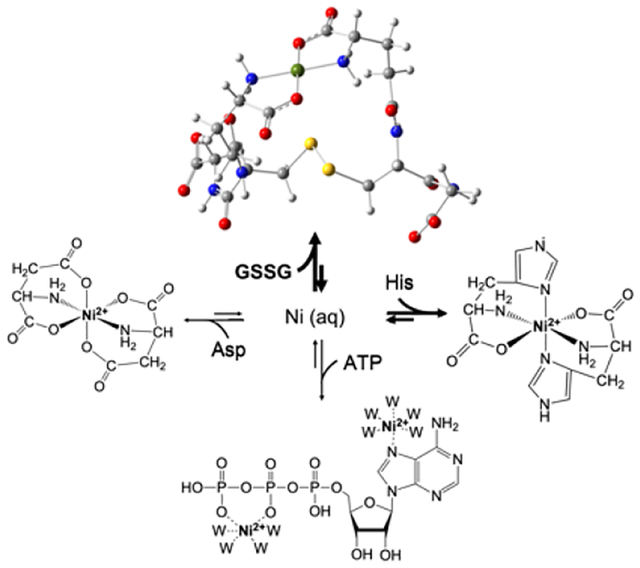
Our results indicate that the LNiP in E. coli is composed of Ni2+(GSSG) (dominant), Ni2+(His)2, Ni2+(Asp)2, and Ni2+(ATP) (minor). Ni2+(GSSG) was the major constituent under the conditions used, followed by Ni2+(His)2. Both complexes were routinely and unambiguously detected in FTSs. NikA binds Ni2+(His)2 in the periplasmic space3, and our results suggest that this complex is also part of the LNiP in the cytosol. Ni2+(Asp)2 and Ni2+(ATP) are probably components of the LNiP but perhaps at lower concentrations under the conditions used. Ni binds GSH (and we can detect the complex in prepared standards by ESI-MS), but we do not detect it in the FTS. Previous ranking of Ni complexes, from most to least stable, based on literature values for stability constants would be
Our ranking (see Results) is not based on reported stability constants but rather on observed chromatographic behavior. There are many experimental variables, e.g. ionic strength, that may be responsible for the observed differences.
That metal-GSH complexes are dominant member of LMPs was based on calculations involving the concentrations of candidate ligands and metal ions and their corresponding thermodynamic binding affinities.38 The affinities of nickel (and iron) for binding GSH are indeed strong5, and the cytosolic concentration of GSH in E. coli is indeed high (~ 3 mM).11 Nevertheless, we did not detect a Ni-GSH complex in FTS. This could have been due to salt suppression, unoptimized pH conditions (the pH of the FTS was 6.5 whereas the pKa of GSH is ~8.8), or the competitive binding of GSH to other metals in the FTS.
Likewise, we had expected that Ni-citrate would be an important member of the LNiP, but this does not seem to be the case for the conditions examined – even though we found that Ni-citrate complexes are very stable. The concentration of free citrate available for Ni(II) complexation in the cell may be low since it rapidly consumed by the TCA cycle and/or because it is competitively complexed by other metals. Future investigations are needed to establish whether or under what conditions Ni-GSH and Ni-citrate become major constituents of the LNiP of E. coli.
A New Perspective on LMPs:
Our results suggest a new perspective regarding the nature of LMPs. First, the components of the LNiP appear to be in rapid equilibrium with each other as illustrated in Figure 9. When different ligands were used to spike the FTS, the distribution of detected species shifted in favor of the Ni complex involving the added ligand, suggesting that all components of the LNiP are in rapid equilibrium. Understanding this behavior quantitatively will require not only knowledge of the coordinating ligands but their binding affinities to the metal and ligand/metal concentrations in the cytosol. There are likely more contributing species than are included in the figure, including the possibility of mixed-ligand complexes.
Figure 9. Rapid equilibrium model of the LNiP in E. coli.
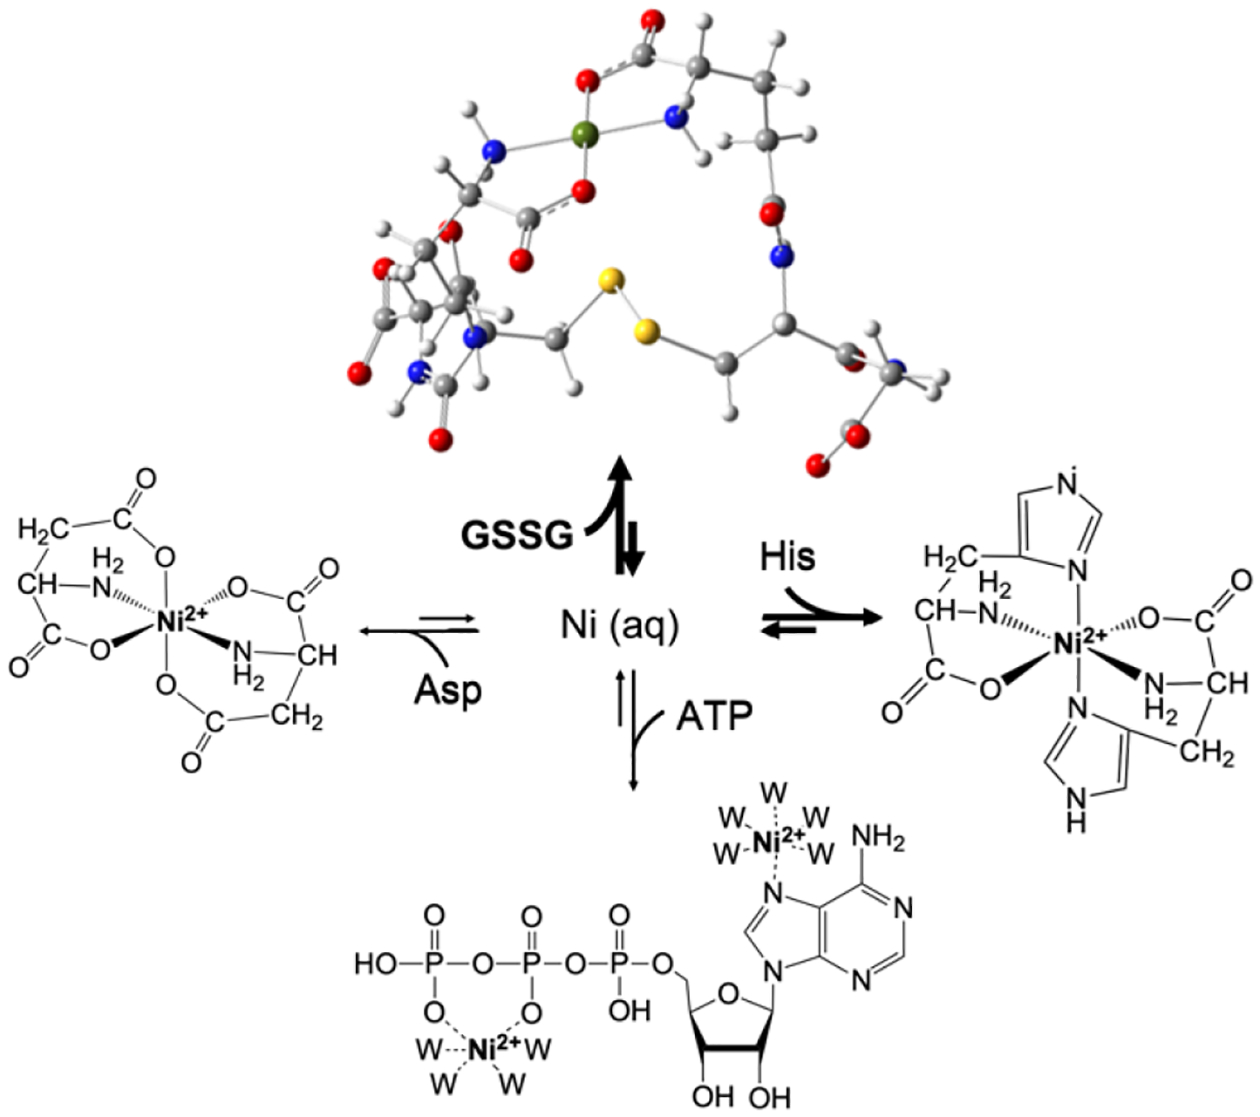
Nickel imported into the cytosol from the environment is sequestered into the LNiP composed of Ni2+(GSSG), Ni2+(His)2, Ni2+(Asp)2, and Ni2+(ATP), which are in rapid equilibrium. Other minor complexes may contribute to the LNiP, and the distribution may change with metabolic conditions. Displayed structures are based on known structures of related complexes39–41; W represents water. The Ni2+(GSSG) structure was optimized using DFT and visualized using GaussView. Two options are suggested for how Ni2+ might bind ATP.
Our results also suggest that the chemical composition of the LNiP changes with metabolism and/or with nutrient medium. This follows from the use of metabolites for ligands to the LNiP complexes and from the likelihood that the concentrations of those metabolites change according to the conditions used (media composition, dissolved O2 concentration, temperature, and genetic strain). Any characterization of a LMP should include a description of cell’s genotype and growth conditions.
Our results also suggest that the LNiP is both a reservoir and a buffer for nickel in E. coli. The notion of a reservoir follows from our discovery that most or nearly all Ni in the cell is present as the LNiP. Stably coordinating Ni(II) ions to the ligands of the pool may protect and prevent them from engaging in deleterious side reactions. The notion of a buffer follows from the sizeable metal-binding capacity of the pool. This capacity likely allows the cell to accommodate a range of Ni concentrations without “spill-over” of aqueous Ni(II) ions, which might otherwise cause deleterious side reactions. Other LMPs may have a similar reservoir and buffering functions.
Whether the members of the LNiP (or in general of LMPs) have distinct individual cellular functions remains debatable. The binding of one member of the pool (e.g. Ni2+(His)2) to a particular client protein (e.g. NikA) suggests individual roles, whereas the notion that all members of the pool are in rapid equilibrium suggests the opposite. If individual Ni complexes bind to particular client apo-proteins, thermodynamic binding affinities and kinetics would determine the function of each complex. Individual reactions like these might be followed by a rapid reestablishment of equilibria. Thus, some aspects of the pool may be properly understood by considering the distinct roles of individual member complexes; other aspects may best be understood as a collective process. The nature of LMPs has been investigated for the past 50 years without affording a clear description of these pools. We hope that the insights presented here clarify some misunderstandings in this field and thus provide a more secure foundation for studying labile metal pools in the future.
CONCLUSION
The objective of this study was to identify the major nickel complexes that compose the labile nickel pool in the cytosol of E. coli. Cytosol was isolated and passed through a 3 kDa cutoff membrane. The resulting protein-free flow-through-solution was subjected to chromatography and metal associated peaks were detected by inductively coupled plasma mass spectrometry. Traces of numerous candidate nickel complexes standards were also collected. Fractions containing nickel were investigated by mass spectrometry. Four major nickel species were detected, including Ni bound to oxidized glutathione, histidine, ATP and aspartic acid. Surprisingly, reduced glutathione and citrate were not major pool components. However, the composition of the pool is likely in a dynamic equilibrium which changes with metabolism and other conditions. The size of the nickel pool is 11 – 14 μM which is substantially greater than expected. Previously reported binding constants to various metalloregulators may have overestimated the relevant binding strength in the cell because aqueous metal salts were used in those titrations. The labile nickel pool may serve as both a reservoir of the metal and a buffer that can accommodate a wide range of cytosolic nickel concentrations without generating aqueous nickel ions which could be deleterious to the cell.
Supplementary Material
ACKNOWLEDGMENT
We thank Yohannes Rezenom of the Chemistry Mass Spectrometry Laboratory (TAMU) for ESI-MS data collection and assistance in HILIC method development. We also extend thanks to Xin Yang of the Laboratory for Molecular Simulation (TAMU) for DFT calculations.
Funding Sources
This work was funded by the National Institutes of Health (GM127021), the National Science Foundation (MCB-1817389), and the Robert A. Welch Foundation (A1170). The content of this article is solely the responsibility of the authors and does not necessarily represent the official views of the NIH, NSF, or the Welch Foundation.
ABBREVIATIONS
- AA
ammonium acetate
- FTS
flow-through-solution
- GSH
reduced glutathione
- GSSG
oxidized glutathione
- LMM
low-molecular-mass
- LMP
labile metal pool
- LNiP
labile nickel pool
- pFTS
pseudo flow-through-solution
Footnotes
Supporting Information. Table S1, Nickel concentration in E. coli whole cell (WC) lysates and cytosolic replicates; Table S2, Parameters used to fit chromatography peaks; Figure S1, SEC-ICP-MS (single column) chromatogram of averaged FTS; Figure S2, Effect of exogenous GSH on the labile nickel pool (single column); Figure S3, Nickel-detected SEC-ICP-MS (double column) chromatograms of FTS replicates; Figure S4, ESI-MS of fractions (double column) from FTS; Figure S5, ESI-MS of fractions (double column) from pFTS; Figure S6, Nickel-detected SEC-ICP-MS (single column) chromatograms showing the effect of acetonitrile; Figure S7, HILIC-ESI-MS spectra of nickel plus GSH and GSSG standards. This material is available free of charge via the Internet at http://pubs.acs.org.
REFERENCES
- (1).Sargent F The Model [NiFe]-Hydrogenases of Escherichia Coli. Adv Microb Physiol 2016, 68, 433–507. [DOI] [PubMed] [Google Scholar]
- (2).Chivers PT; Benanti EL; Heil-Chapdelaine V; Iwig JS; Rowe JL Identification of Ni-(L-His)2 as a Substrate for NikABCDE-Dependent Nickel Uptake in Escherichia Coli. Metallomics 2012, 4 (10), 1043–1050. [DOI] [PubMed] [Google Scholar]
- (3).Lebrette H; Iannello M; Fontecilla-Camps JC; Cavazza C The Binding Mode of Ni-(L-His)2 in NikA Revealed by X-Ray Crystallography. J Inorg Biochem 2013, 121, 16–18. [DOI] [PubMed] [Google Scholar]
- (4).Lacasse MJ; Douglas CD; Zamble DB Mechanism of Selective Nickel Transfer from HypB to HypA, Escherichia Coli [NiFe]-Hydrogenase Accessory Proteins. Biochemistry 2016, 55 (49), 6821–6831. [DOI] [PubMed] [Google Scholar]
- (5).Krężel A; Bal W Studies of Zinc(II) and Nickel(II) Complexes of GSH, GSSG and Their Analogs Shed More Light on Their Biological Relevance. Bioinorg Chem Appl 2004, 2 (3–4), 293–305. [DOI] [PMC free article] [PubMed] [Google Scholar]
- (6).Huang H-T; Maroney MJ Ni(II) Sensing by RcnR Does Not Require an FrmR-Like Intersubunit Linkage. Inorg Chem 2019, 58 (20), 13639–13653. [DOI] [PubMed] [Google Scholar]
- (7).Diederix REM; Fauquant C; Rodrigue A; Mandrand-Berthelot M-A; Michaud-Soret I Sub-Micromolar Affinity of Escherichia Coli NikR for Ni(II). Chem. Commun 2008, No. 15, 1813–1815. [DOI] [PubMed] [Google Scholar]
- (8).Foster AW; Pernil R; Patterson CJ; Scott AJP, Palsson LO; Pal R; Chivers PT Pohl E and Robeinson NJ A tight tunable range for Ni(II) sensing and buffering in cells. Nature Chem. Biol 2017, 13, 409–414. [DOI] [PMC free article] [PubMed] [Google Scholar]
- (9).Aron AT; Ramos-Torres KM; Cotruvo JA; Chang CJ Recognition- and Reactivity-Based Fluorescent Probes for Studying Transition Metal Signaling in Living Systems. Acc. Chem. Res 2015, 48 (8), 2434–2442. [DOI] [PMC free article] [PubMed] [Google Scholar]
- (10).Dodani SC; He Q; Chang CJ A Turn-On Fluorescent Sensor for Detecting Nickel in Living Cells. J Am Chem Soc 2009, 131 (50), 18020–18021. [DOI] [PMC free article] [PubMed] [Google Scholar]
- (11).Brawley HN; Lindahl PA Low-Molecular-Mass Labile Metal Pools in Escherichia Coli: Advances Using Chromatography and Mass Spectrometry. J Biol Inorg Chem 2021, 26 (4), 479–494. [DOI] [PMC free article] [PubMed] [Google Scholar]
- (12).Phillips CSG; Williams RJP Inorganic Chemistry Volume II; Oxford University Press, 1965, p. 430, Fig. 29.1. [Google Scholar]
- (13).Bennett BD; Kimball EH; Gao M; Osterhout R; Van Dien SJ; Rabinowitz JD Absolute Metabolite Concentrations and Implied Enzyme Active Site Occupancy in Escherichia Coli. Nature Chemical Biology 2009, 5 (8), 593–599. [DOI] [PMC free article] [PubMed] [Google Scholar]
- (14).Lushchak VI Glutathione Homeostasis and Functions: Potential Targets for Medical Interventions. Journal of Amino Acids 2012, 2012, e736837. [DOI] [PMC free article] [PubMed] [Google Scholar]
- (15).Masip L; Veeravalli K; Georgiou G The Many Faces of Glutathione in Bacteria. Antioxid Redox Signal 2006, 8 (5–6), 753–762. [DOI] [PubMed] [Google Scholar]
- (16).Zborníková E; Knejzlík Z; Hauryliuk V; Krásný L; Rejman D Analysis of Nucleotide Pools in Bacteria Using HPLC-MS in HILIC Mode. Talanta 2019, 205, 120161. [DOI] [PubMed] [Google Scholar]
- (17).Smirnova GV; Tyulenev AV; Bezmaternykh KV; Muzyka NG; Ushakov VY; Oktyabrsky ON Cysteine Homeostasis under Inhibition of Protein Synthesis in Escherichia Coli Cells. Amino Acids 2019, 51 (10), 1577–1592. [DOI] [PubMed] [Google Scholar]
- (18).McCleary WR Molecular Mechanisms of Phosphate Homeostasis in Escherichia Coli. Escherichia coli - Recent Advances on Physiology, Pathogenesis and Biotechnological Applications 2017, 333–335. [Google Scholar]
- (19).Martínez-Salas E; Martín JA; Vicente M Relationship of Escherichia Coli Density to Growth Rate and Cell Age. J Bacteriol 1981, 147 (1), 97–100. [DOI] [PMC free article] [PubMed] [Google Scholar]
- (20).Hudder BN; Morales JG; Stubna A; Münck E; Hendrich MP; Lindahl PA Electron Paramagnetic Resonance and Mössbauer Spectroscopy of Intact Mitochondria from Respiring Saccharomyces Cerevisiae. J Biol Inorg Chem 2007, 12 (7), 1029–1053. [DOI] [PubMed] [Google Scholar]
- (21).Schaechter M Escherichia Coli and Salmonella 2000: The View From Here. Microbiol Mol Biol Rev 2001, 65 (1), 119–130. [DOI] [PMC free article] [PubMed] [Google Scholar]
- (22).Kubitschek HE; Friske JA Determination of Bacterial Cell Volume with the Coulter Counter. J Bacteriol 1986, 168 (3), 1466–1467. [DOI] [PMC free article] [PubMed] [Google Scholar]
- (23).Ágoston CG; Várnagy K; Bényei A; Sanna D; Micera G; Sóvágó I Solution Equilibria and Structural Characterisation of the Transition Metal Complexes of Glycyl-l-Cysteine Disulfide. Polyhedron 2000, 19 (15), 1849–1857. [Google Scholar]
- (24).Gaussian 16, Revision C.01, Frisch MJ et al. , Gaussian, Inc., Wallingford, CT, 2016. [Google Scholar]
- (25).Xu Z; Wang P; Wang H; Yu ZH; Au-Yeung HY; Hirayama T; Sun H; Yan A Zinc Excess Increases Cellular Demand for Iron and Decreases Tolerance to Copper in Escherichia Coli. J Biol Chem 2019, 294 (45), 16978–16991. [DOI] [PMC free article] [PubMed] [Google Scholar]
- (26).Finney LA; O’Halloran TV Transition Metal Speciation in the Cell: Insights from the Chemistry of Metal Ion Receptors. Science 2003, 300 (5621), 931–936. [DOI] [PubMed] [Google Scholar]
- (27).Zhang Y; Akilesh S; Wilcox DE Isothermal Titration Calorimetry Measurements of Ni(II) and Cu(II) Binding to His, GlyGlyHis, HisGlyHis, and Bovine Serum Albumin: A Critical Evaluation. Inorg. Chem 2000, 39 (14), 3057–3064. [DOI] [PubMed] [Google Scholar]
- (28).Williams R; Silva JJR The Distribution of Elements in Cells. Coordination Chemistry Reviews 2000, 200–202, 247–348. [Google Scholar]
- (29).Musiani F; Zambelli B; Bazzani M; Mazzei L; Ciurli S Nickel-Responsive Transcriptional Regulators. Metallomics 2015, 7 (9), 1305–1318. [DOI] [PubMed] [Google Scholar]
- (30).Krężel A; Maret W The Biological Inorganic Chemistry of Zinc Ions. Arch Biochem Biophys 2016, 611, 3–19. [DOI] [PMC free article] [PubMed] [Google Scholar]
- (31).Osman D; Martini MA; Foster AW; Chen JJ; Scott AJP; Morton RJ; Steed JW; Lurie-Luke E; Huggins TG; Lawrence AD; Deery E; Warren MJ; Chivers PT; and Robinson NJ Bacterial sensors define intracellular free energies for correct enzyme metalation. Nature Chem. Biol 2019, 15, 241–249. [DOI] [PMC free article] [PubMed] [Google Scholar]
- (32).Gaur K; Perez Otero SC; Bengamin-Rivera JA; Rodriguez I; Loza-Rosas SA; Vazquez Salgador AM; Akam EA; Hernandez-Matias L, Sharma RK, Alicea N, Kowaleff M; Washington AV; Astashkin AV; Tomat E; Tinoco AD Iron chelator transmetalative approach to inhibit human ribonucleotide reductase. J. Am. Chem. Soc. Au 2021, 1, 865–878. [DOI] [PMC free article] [PubMed] [Google Scholar]
- (33).Ma Z; Chandragsu P; Helmann TC; Romsang A; Gaballa A; and Helmann JD Bacillithiol is a major buffer of the labile zinc pool in Bacillus subtilis. Mol. Microbiol 2014, 94, 756–770. [DOI] [PMC free article] [PubMed] [Google Scholar]
- (34).Altun Y, Köseoĝlu F Stability of Copper(II), Nickel(II) and Zinc(II) Binary and Ternary Complexes of Histidine, Histamine and Glycine in Aqueous Solution. J Solution Chem 2005, 34, 213–231 (2005). [Google Scholar]
- (35).Rani RS Rao GN Stability of Binary Complexes of L-Aspartic acid in dioxan-water mixtures. Bull. Chem. Soc. Ethiopia 2013, 27, 367–376. [Google Scholar]
- (36).Zelenin OY Interaction of the Ni2+ ion with citric acid in an aqueous solution. Russ J Coord Chem 2007, 33, 346–350. [Google Scholar]
- (37).Azab HA, Hassan A, El-Nady AM et al. Ternary complexes of nickel(II) with AMP,ADP and ATP as primary ligands and some biologically important polybasic oxygen acids as secondary ligands. Monatsh Chem 1993, 124, 267–276. [Google Scholar]
- (38).Hider R; Aviles MV; Chen Y-L; Latunde-Dada GO The Role of GSH in Intracellular Iron Trafficking. Int J Mol Sci 2021, 22 (3), 1–13. [DOI] [PMC free article] [PubMed] [Google Scholar]
- (39).Fraser KA; Harding MM The Crystal and Molecular Structure of Bis(Histidino)Nickel(II) Monohydrate. J. Chem. Soc. A 1967, No. 0, 415–420. [Google Scholar]
- (40).Aiyelabola TO; Isabirye DA; Akinkunmi EO; Ogunkunle OA; Ojo I a. O. Synthesis, Characterization, and Antimicrobial Activities of Coordination Compounds of Aspartic Acid. Journal of Chemistry 2016, 2016, e7317015. [Google Scholar]
- (41).Gasowska A Coordination Centres of Purine Nucleotides: Adenosine-5′-Diphosphate and Adenosine-5′-Triphosphate in Their Reactions with Nickel(II), Cobalt(II) and Tetramines. Zeitschrift für anorganische und allgemeine Chemie 2006, 632 (14), 2281–2287. [Google Scholar]
Associated Data
This section collects any data citations, data availability statements, or supplementary materials included in this article.


