

Abstract
We here report on the assessment of the model refinement predictions submitted to the 12th Experiment on the Critical Assessment of Protein Structure Prediction (CASP12). This is the fifth refinement experiment since CASP8 (2008) and, as with the previous experiments, the predictors were invited to refine selected server models received in the regular (nonrefinement) stage of the CASP experiment. We assessed the submitted models using a combination of standard CASP measures. The coefficients for the linear combination of Z-scores (the CASP12 score) have been obtained by a machine learning algorithm trained on the results of visual inspection. We identified eight groups that improve both the backbone conformation and the side chain positioning for the majority of targets. Albeit the top methods adopted distinctively different approaches, their overall performance was almost indistinguishable, with each of them excelling in different scores or target subsets. What is more, there were a few novel approaches that, while doing worse than average in most cases, provided the best refinements for a few targets, showing significant latitude for further innovation in the field.
Keywords: CASP, CASP12, enhanced sampling algorithms, model refinement, molecular dynamics, protein structure prediction
1 |. INTRODUCTION
The refinement category of CASP (Critical Assessment of protein Structure Prediction) was introduced in the eighth round of the experiment to address the challenge of refining selected server models from the regular CASP experiment to better represent the native structure.1
It is now recognized that a number of applications, ranging from rational drug discovery to crystallography (molecular replacement) require high accuracy models.2–6 Thus, a reliable computational approach for refinement is highly desirable. In this respect, the CASP refinement experiment can be very useful, by highlighting the best practices and progress in the field.
As discussed in previous CASP experiments,7 refinement is challenging, as predictors need to further improve the best server models both on a global and local scale. Indeed, since many of the starting models are already close to the native structures, the refinement methods need to be exquisitely sensitive to introduce subtle changes into the original structures, such as repacking of side chains. At the same time, these methods should be also capable of significant rearrangement of proteins, including rerouting of the backbone or changes to the secondary structure elements.
Many methods (i.e., CASP groups) participating in the mainstream CASP prediction already perform some degree of refinement, although the time constraint might prevent the use of computationally-intensive strategies. Analogously, a few groups participating in the refinement challenge might attempt a partial reconstruction of the fold from the sequence, blurring the distinction between the traditional modeling and refinement. Finding the balance between small changes that only locally perturb the starting structure, and more substantial rearrangements that refold whole sub-domains is the essence of the refinement task itself. As refinement assessors have already pointed out in the past,7 improving more fine-grained features of model quality such as side-chain positioning and physicality is seldom useful without a correct backbone positioning. This turned out to be the case also in CASP12.
Historically, a broad variety of methods have been used in protein structure refinement, ranging from knowledge-based and fragment-based approaches to molecular dynamics (MD) with physics-based force fields.8–15 Lately, due to increasingly accurate physics-based force fields10,16–21 and faster parallel computers and GPUs, MD in combination with physics-based force fields and smart constraints is increasingly used in successful refinement pipelines.11 Starting from a clear disadvantage, where such approaches would in most cases make the starting model worse, they have been so successful that they are now used in most top-performing CASP12 methods. Eight out of top ten CASP12 refinement methods use MD with recently developed physics-based potentials (alone or in combination with other approaches), while the remaining two use MD with a hybrid knowledge-based/physics-based potential. The increasing success of MD methods might seem unsurprising given that they have been shown to reversibly fold small proteins, recovering their native structure.22 However, due to a combination of computationally prohibitive sampling times (especially in the context of CASP), missing information on structure-determining contacts (e.g., cofactors, ligands and protein-protein contacts) as well as residual force-field inaccuracies, refinement with MD simulations works best when light positional restraints are applied to the starting structure.10 The strength of these restraints appear to be a crucial parameter for a successful refinement and concurs to differentiate the performance of the best approaches in the CASP refinement challenge. The use of restraints might also explain the difficulties encountered by MD-only pipelines in refining starting models that are far (in terms of GDT_HA and RMSD) from the target.
Enhanced sampling algorithms, which are increasingly used to address the time-scale problem of atomistic MD simulations,23–26 also allow the inclusion of heuristic information about protein folds without the need for explicit constraints. Approaches such as MELD (Modeling Employing Limited Data),26 which sample important conformational states by combining structural and heuristic information with atomistic MD simulations, show promise.
As an alternative to physics-based force-fields, knowledge-based potentials are highly attractive for structure refinement, due to their more direct relation with protein structures and lower computational cost.27–29 They are generally derived from knowledge of atom- or residue-specific interactions and have been shown to be able to refine near-native structures.30
As the CASP12 refinement targets span a wide range of sizes (from 54 to 396 residues) and accuracies of starting models (GDT_HA scores ranging from 23 to 76), a battery of numerical evaluation measures sensitive both to subtle local changes and more global structural features needed to be used. For a well-rounded assessment, we combined conceptually different evaluation measures tested in previous CASP editions. The coefficients used to combine various accuracy metrics have been automatically determined with genetic algorithms (GA) and a Monte Carlo (MC) approach to best correlate with the ranking obtained by visual inspection. Reassuringly, the CASP12 score is robust upon restraining individual metrics to <20%. The ranking of the top 10 methods is very similar to that obtained by applying the CASP11 and CASP10 scores (Supporting Information Table S1).7,31 Still, we believe that the visual inspection of a considerable fraction of submissions enabled us to better distinguish subtle differences in the submitted structures and reward the most successful ones. Overall, the analysis of the CASP12 refinement predictions shows a consolidation of the trend started in CASP10 and continued in CASP11. The top methods excel in a number of metrics, but the prediction accuracy is in many respects similar across different methods, and for most targets incremental. While some methods are relatively more conservative, providing a reliable but small refinement, other approaches are more adventurous providing significant improvement of the global and local structure for some targets while making a few others worse. Finally, a few new approaches that trail the top scoring methods for most targets occasionally provided striking refinements.
2 |. MATERIALS AND METHODS
2.1 |. Target selection
The overall setup of the refinement experiment in CASP12 is similar to previous CASPs.1,7,31,32 Refinement targets are selected from amongst the main challenge targets. One of the major concerns of the organizers and assessors is to provide as many interesting targets as possible, while discarding cases where the experimental structure is dictated by extensive multimeric interactions, or where submitted models are already good and not much room is left for the refinement, or, on the contrary, where the models are too poor and the improvement would require substantial conformational rearrangements in the global structure. After careful analysis and visual inspection, we selected a total of 42 targets for the CASP12 refinement challenge. Of these, 23 (55%) were easier tertiary structure prediction targets (or TBM, see the domain classification article elsewhere in this issue), 13 (31%) were intermediate (or TBM/FM) and 6 (14%) were difficult for tertiary structure prediction targets (FM). Differently from CASP11, a large portion of CASP12 refinement targets were the FM and TBM/FM targets, which were included in the scope of the refinement experiment to follow the recent progress in the free modeling (FM) prediction and test the abilities of the refinement methods on this kind of targets. In addition, some targets in CASP12 were considerably larger than those in previous CASP refinement experiments, likely contributing to the difficulty of their refinement. As in previous CASP experiments, for each target, one of the best server-submitted models was suggested as the starting model for the refinement. The accuracy of the model’s backbone (GDT_HA score, the main criterion) and its compliance to the known protein stereochemical rules (MolProbity score, secondary criterion) were used in the selection process. The accuracy scores for the initial structures are reported in Table 1, together with their CASP IDs.
TABLE 1.
The 42 targets with corresponding starting structure scores
| Target | Residues | Starting model ID | GDT_TS | GDT_HA | RMS CA | SphGr | QCS | LDDT | CAD AA | MolPrb |
|---|---|---|---|---|---|---|---|---|---|---|
| TR520 | 321 | T0920TS220 4 | 79.1 | 58.4 | 1.9 | 88.5 | 93.6 | 0.71 | 0.70 | 1.85 |
| TR594 | 89 | T0894TS001 4 | 55.0 | 34.0 | 4.7 | 53.0 | 73.2 | 0.50 | 0.50 | 2.90 |
| TR694 | 263 | T0894TS001 4 | 39.3 | 24.3 | 8.7 | 52.8 | 78.6 | 0.49 | 0.53 | 2.73 |
| TR862 | 101 | T0862TS183 3 | 58.6 | 40.6 | 5.6 | 63.4 | 69.4 | 0.51 | 0.60 | 2.13 |
| TR866 | 115 | T0866TS005 2 | 79.6 | 62.5 | 3.3 | 84.6 | 90.1 | 0.71 | 0.68 | 1.55 |
| TR868 | 116 | T0868TS005 1 | 80.9 | 62.6 | 2.0 | 91.4 | 88.8 | 0.72 | 0.72 | 0.50 |
| TR869 | 104 | T0869TS220 2 | 38.9 | 28.8 | 12.3 | 39.90 | 46.6 | 0.38 | 0.50 | 1.81 |
| TR870 | 123 | T0870TS444 2 | 42.4 | 25.2 | 7.6 | 40.4 | 53.8 | 0.39 | 0.48 | 3.44 |
| TR872 | 88 | T0872TS432 3 | 73.0 | 56.0 | 5.6 | 76.0 | 93.1 | 0.60 | 0.60 | 0.50 |
| TR874 | 118 | T0874TS005 1 | 52.7 | 36.9 | 7.4 | 63.1 | 71.7 | 0.51 | 0.60 | 1.25 |
| TR875 | 122 | T0875TS005 2 | 43.1 | 30.1 | 9.1 | 40.1 | 61.0 | 0.44 | 0.52 | 1.15 |
| TR876 | 120 | T0876TS005 2 | 73.0 | 56.9 | 5.1 | 76.0 | 91.0 | 0.62 | 0.67 | 0.50 |
| TR877 | 142 | T0877TS220 1 | 70.2 | 49.1 | 3.0 | 73.9 | 89.0 | 0.62 | 0.64 | 1.29 |
| TR879 | 220 | T0879TS016 1 | 79.2 | 64.2 | 5.5 | 73.6 | 93.1 | 0.70 | 0.66 | 3.44 |
| TR881 | 202 | T0881TS092 1 | 69.4 | 49.0 | 3.4 | 56.9 | 86.0 | 0.56 | 0.53 | 2.68 |
| TR882 | 79 | T0882TS005 1 | 87.0 | 70.0 | 2.1 | 72.0 | 95.0 | 0.70 | 0.70 | 0.50 |
| TR884 | 71 | T0884TS183 1 | 65.0 | 45.0 | 3.7 | 68.0 | 76.1 | 0.50 | 0.50 | 2.40 |
| TR885 | 114 | T0885TS005 2 | 92.0 | 78.3 | 1.1 | 89.4 | 93.5 | 0.77 | 0.74 | 0.88 |
| TR887 | 163 | T0887TS432 4 | 68.1 | 46.1 | 3.0 | 91.9 | 59.5 | 0.68 | 0.70 | 1.38 |
| TR890 | 188 | T0890TS250 3 | 45.4 | 32.8 | 12.2 | 46.5 | 48.2 | 0.46 | 0.53 | 2.01 |
| TR891 | 119 | T0891TS220 5 | 91.3 | 76.3 | 1.6 | 87.9 | 94.4 | 0.75 | 0.71 | 1.40 |
| TR893 | 169 | T0893TS220 5 | 87.2 | 69.7 | 2.3 | 88.8 | 95.2 | 0.74 | 0.71 | 1.51 |
| TR894 | 54 | T0894TS001 4 | 74.0 | 54.0 | 2.2 | 83.0 | 87.8 | 0.60 | 0.50 | 2.50 |
| TR895 | 120 | T0895TS001 4 | 70.2 | 52.0 | 4.4 | 63.7 | 90.0 | 0.61 | 0.59 | 2.31 |
| TR896 | 86 | T0896TS220 5 | 60.0 | 47.0 | 8.2 | 40.0 | 58.9 | 0.40 | 0.50 | 2.10 |
| TR898 | 106 | T0898TS432 1 | 37.0 | 25.2 | 13.9 | 33.0 | 41.6 | 0.37 | 0.51 | 0.66 |
| TR901 | 223 | T0901TS220 2 | 51.9 | 32.6 | 5.6 | 41.2 | 77.1 | 0.44 | 0.50 | 2.03 |
| TR905 | 353 | T0905TS220 4 | 51.4 | 33.5 | 7.0 | 45.4 | 76.4 | 0.47 | 0.52 | 2.33 |
| TR909 | 340 | T0909TS092 1 | 60.1 | 42.9 | 7.2 | 46.5 | 77.9 | 0.51 | 0.51 | 3.30 |
| TR910 | 317 | T0910TS005 2 | 85.7 | 70.8 | 1.6 | 88.4 | 86.4 | 0.80 | 0.74 | 0.75 |
| TR912 | 414 | T0912TS005 1 | 63.5 | 46.2 | 9.7 | 56.0 | 82.6 | 0.55 | 0.55 | 1.52 |
| TR913 | 338 | T0913TS005 1 | 66.2 | 46.0 | 5.0 | 62.1 | 81.4 | 0.56 | 0.59 | 1.32 |
| TR917 | 391 | T0917TS005 5 | 85.7 | 65.6 | 1.7 | 90.8 | 95.4 | 0.77 | 0.73 | 1.36 |
| TR920 | 241 | T0920TS220 4 | 79.7 | 61.0 | 2.4 | 82.0 | 90.8 | 0.65 | 0.65 | 1.57 |
| TR921 | 138 | T0921TS220 1 | 69.0 | 48.4 | 3.5 | 67.0 | 84.3 | 0.57 | 0.58 | 1.61 |
| TR922 | 74 | T0922TS005 2 | 89.0 | 76.0 | 1.5 | 94.0 | 96.8 | 0.80 | 0.70 | 0.80 |
| TR928 | 381 | T0928TS349 1 | 63.2 | 43.7 | 6.0 | 57.3 | 72.7 | 0.48 | 0.53 | 3.56 |
| TR942 | 387 | T0942TS183 2 | 52.3 | 33.9 | 10.2 | 71.8 | 69.7 | 0.57 | 0.61 | 2.26 |
| TR944 | 270 | T0944TS220 2 | 74.1 | 56.3 | 3.9 | 77.9 | 90.1 | 0.68 | 0.67 | 1.75 |
| TR945 | 396 | T0945TS220 1 | 59.2 | 41.9 | 8.4 | 70.0 | 76.7 | 0.61 | - | 2.31 |
| TR947 | 175 | T0947TS446 1 | 66.4 | 52.3 | 13.0 | 51.43 | 83.8 | 0.53 | 0.57 | 0.86 |
| TR948 | 161 | T0948TS251 1 | 76.7 | 60.2 | 4.7 | 69.8 | 88.2 | 0.65 | 0.66 | 1.59 |
Many targets for the CASP12 main challenge are large multidomain complexes. This makes the refinement of the corresponding single domain structures very challenging, as many inter-domain contacts might stabilize the observed X-ray arrangement. To retain as many targets as possible while providing a rigorous assessment, we removed from the evaluation some regions of targets clearly affected by interdomain and protein-protein contacts (pertaining to TR866, TR868, TR870, TR876, TR885, TR887, and TR922). In TR866, for example, the C-terminal helix (V142-Y152) at the oligomerization interface is stabilized by contacts with the other proteins forming a hexamer and therefore was excluded from the evaluations. Analogously, in TR868, which is a dimer of heterodimers, residues Q65-F75 were removed since they form part of the dimerization interface. A visual summary of the regions removed from the seven targets is reported in Figure 1. Target TR887 is a special case of a swapped dimer in the X-ray structure. Refining the swap segment in the absence of the other monomer (Figure 1) and of correctly swapped templates, makes little sense. Instead, when defining the target structure of TR887, we replaced the region with the respective swapped segment from the second monomer (in green in Figure 1), as predicted by the servers in the main category.
FIGURE 1.

Target structures with interdomain or interchain contacts. The domains to be refined are in cyan, additional domains are in gray. The interacting regions that were removed from the assessment are shown in red. These are Q65-F75 in TR868, I8-S21 in TR870, F107-A124 in TR876, V142-Y152 in TR866. In the case of TR887, the green region represents the swap segment added to the target structure from the second monomer
2.2 |. Model accuracy measures
A number of accuracy scores are automatically calculated by the Protein Structure Prediction Center; we refer to the documentation therein for further details.34,36 Here, in line with previous CASP refinement experiments, we based our analysis on the following metrics: the Root Mean Square Deviation of the Cα atoms (RMSD), the Global Distance Test33,35 (GDT_TS and GDT_HA), SphereGrinder36 (SphGr), the Local Distance Difference Test (LDDT),37 and the MolProbity score (MolPrb)38 to assess the model stereochemistry. In addition to these, we also considered the Contact Area Difference score (CAD)39 and the Quality Control Score (QCS).40
The Cα RMSD measure calculates the average distance between the corresponding Cα atoms in the model and target after their optimal least-square superposition. The GDT_TS score is a measure of model’s backbone accuracy. The model is superposed (using LGA33) to the target structure in multiple trials, maximizing the number of Cα atoms within a certain cut-off distance. The GDT_TS value is the average percentage of well-fit Cα atoms calculated at four different cut-off values (1.0, 2.0, 4.0, and 8.0 Å). The GDT_HA is the high-accuracy version of the latter metric, for which the cut-offs are halved. SphereGrinder is a local-based measure of similarity introduced in CASP10. For every residue, the RMSD score is calculated on sets of corresponding atoms inside the spheres of a selected radius (6 Å in CASP) centered on the same Cα atoms in the model and target. The average percentage of spheres fitting under 2 and 4 Å RMSD cutoffs is reported as the SG-score. The LDDT is a superposition-free measure based on the comparison of all-atom distance maps of model and target structures. For each residue pair within a distance cutoff of 15 Å, the difference between the corresponding distances in the model and in the target is calculated. The LDDT score reports the average fraction of the differences below four different threshold values (0.5, 1, 2, and 4 Å). The CAD-score39 is based on a similar concept, but uses the difference in residue-residue contact surfaces as derived by the Voronoi tessellation, instead of a set of cut-offs. The QCS score was developed by Grishin and coworkers40 as a result of their experience as evaluators of the CASP9 FM category and is the average of six individual scores that take into account the length, position and reciprocal orientation of secondary structure elements and Cα-Cα contacts. We observed that adding QCS to the final score led to a better agreement with the manually curated rankings. Finally, the MolProbity score is a target-independent measure of the model stereochemistry accuracy. It is derived from an extensive analysis of deposited PDB structures38 and reports the presence of clashes, the rotameric state of the side-chains, and the number of residues with backbone torsions φ and ψ outside the high-density Ramachandran regions.
The scatter plot and correlation of the different metrics for all the submissions is reported in Figure 2. Since most quality scores are highly correlated (except MolProbity), after extensive trials with our machine learning algorithm trained on the ranking obtained from our manually curated evaluations, we retained the RMSD, GDT_HA, SphGr, QCS, and MolPrb in our final score (see below).
FIGURE 2.

Correlation between eight evaluation metrics for all targets and all submissions. Pair-wise scatter plots are in the left lower triangular part of the table; the correlation coefficients are in the upper one
For ranking purposes, all the metrics were converted to Z-scores in a two-step procedure. First, Z-scores were calculated from the distribution of raw scores for all models submitted on a target. Then, models with a Z-score lower than −2 were excluded and Z-scores were re-calculated based on the mean and standard deviation of the outlier-free model set. Finally, models with Z-scores lower than −2 (in both calculation stages) were assigned a value of −2 not to over-penalize the groups attempting novel strategies. The cumulative ranking scores were obtained by summing the target-based Z-scores for each group, assigning a Z-score of −2 every time a target was not predicted by a particular group.
To estimate the overall added value of the refinement, we compared the results of CASP12 groups to those of the artificial “naïve group,” which always resubmits unchanged starting model, as proposed by the past CASP assessors.7
3 |. ASSESSMENT OF THE CASP12 REFINEMENT CATEGORY RESULTS
3.1 |. General overview of targets and predictions
A total of 39 groups took part in the CASP12 refinement challenge. Twenty groups submitted predictions for all the 42 targets and further seven for 41 targets. CASP12 refinement results spanned a wide range of scores. Figure 3 shows general statistics of the accuracy of first submitted models with respect to the accuracy of the corresponding starting models (in terms of GDT_HA) for targets of different lengths and different accuracies of starting models. The best potential for improvement was observed for smaller targets (top left panel) and those in the medium range of starting GDT_HAs (bottom middle panel). Overall, 34% of the models improved over the initial structure. A similar conclusion can be drawn from the ΔRMSD-based analysis (see Supporting Information Figure S1). As expected, the median score change is close to zero, with ~ 70% of the predictions having a ΔGDT_HA between −5 and 5 (Figure 3). This suggests a prevalence of conservative predictions. While more potential for worsening the starting structure is observed, with 23% of models taking a loss of 5 or more GDT_HA units, 3% of the models showed remarkable examples of refinement improving starting structures by 5–20 GDT_HA units.
FIGURE 3.
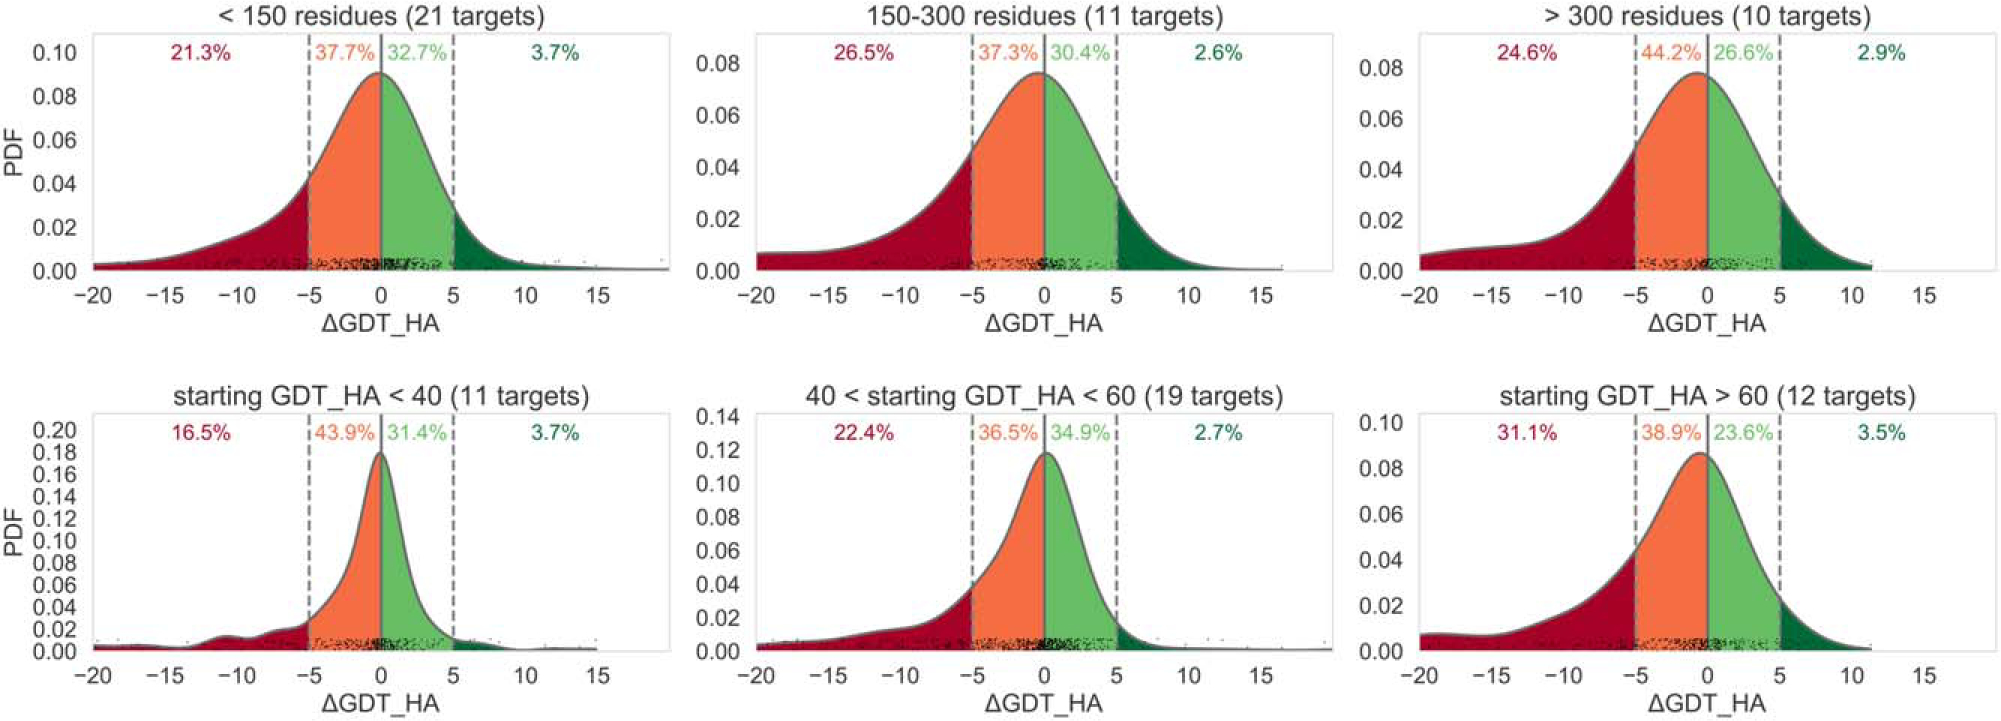
Normalized probability distributions of ΔGDT_HA differences between the refined and starting models for different target lengths (top row of graphs) and different starting GDT_HA (bottom row). Data for first submitted models are presented; y axis shows values of the probability density function (PDF) of the distribution
3.2 |. Performance of methods according to various assessment measures
We used several conceptually different measures for the refinement assessment (see Methods). This allowed us to analyze models from different perspectives (e.g., overall accuracy of the backbone, all-atom accuracy of local substructures, or stereochemical accuracy).
Figure 4 shows the results according to one of the most widely used CASP measures, GDT_HA, which is used here to evaluate accuracy of the protein backbone refinement. Using this metric, it is clear that a number of groups are able on average to refine the targets, with the best groups significantly refining some targets, while still worsening a few. Eight groups—SVMQA, Seok, FEIG, GOAL_COMPLEX, BAKER, Kiharalab, Seok-server, and GOAL—on average improve over the starting model (top panel). The largest average accuracy increase, however, is very modest and constitutes only 1.3 GDT_HA points (by the SVMQA group). In the bottom three panels, we report the results binned for different accuracies of starting models. In contrast to the general results (showing that the highest improvement potential is for targets with medium-range starting GDT_HAs), the top performing groups achieved better results on targets with low initial GDT_HA scores. For example, BAKER, the best group on targets with starting GDT_HA<40, improved the GDT_HA by 2 units on average. The average refinement of structures close to the target (high initial GDT_HA) is more modest, even though 10 out of 39 groups stayed in the positive average ΔGDT_HA territory.
FIGURE 4.
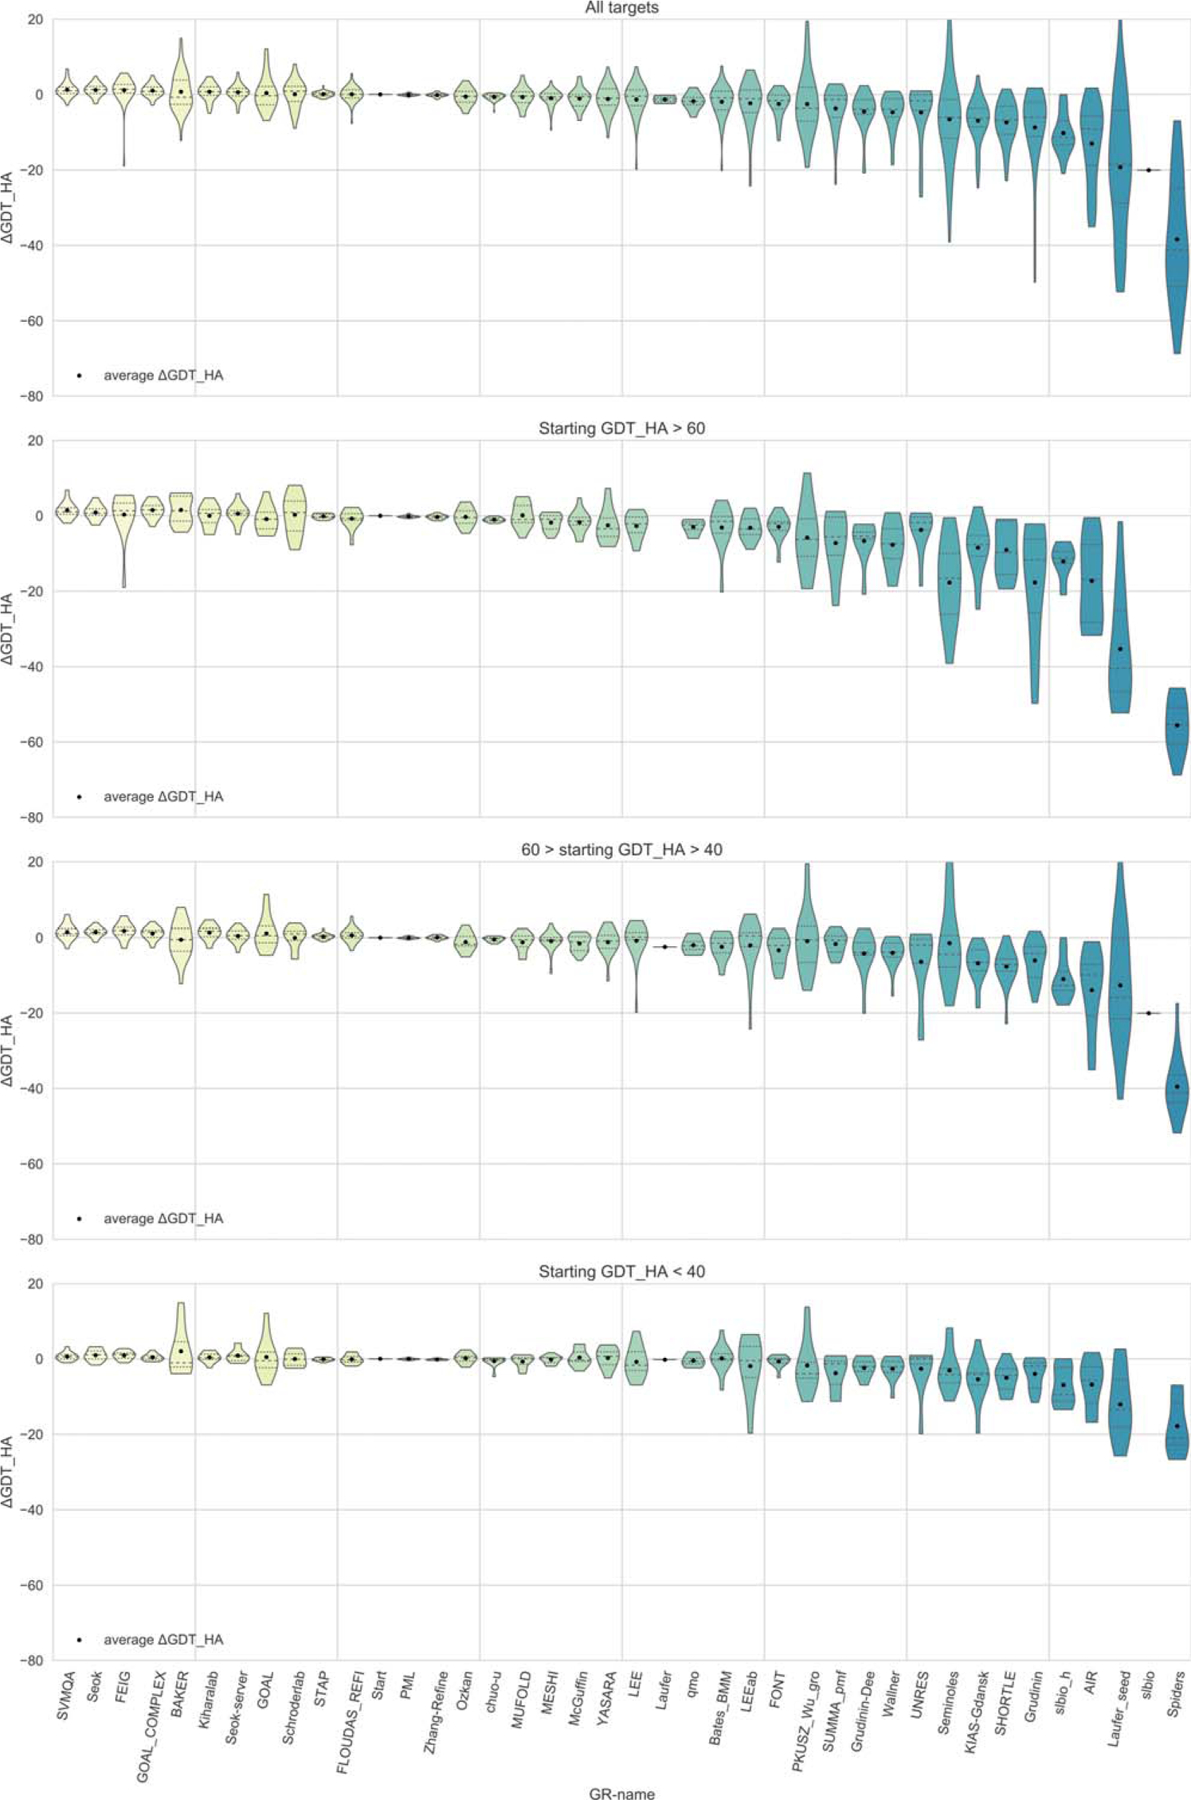
Performance of CASP12 groups as evaluated by the differences in GDT_HA scores between the refined and starting models. The data are shown for all targets (top panel) and for three target subclasses with different GDT_HA scores of starting models (that is, different difficulties of original targets for tertiary structure prediction). Only models ranked as #1 by the predictors are considered. The quartiles are shown as dotted lines in the violin plots. Groups are sorted according to decreasing ΔGDT_HA mean on all targets (top panel)
We also performed the analyses similar to the one reported in Figure 4 according to all other evaluation measures. In Supporting Information Figure S2, we show the distributions of GDT_TS scores of refined models (model 1) for all CASP12 refinement targets. Supporting Information Figures S3 and S4 show examples of the analyses according to the RMSD_CA and GDT_TS metrics. It can be seen that the results are conceptually similar to the GDT_HA-based data—a number of groups are able to improve on average, but in most cases only marginally.
To analyze the relative performance of CASP12 groups, we converted raw evaluation scores into the corresponding Z-scores (see Methods). Figures 5 and Supporting Information Figure S5 illustrate the performance of the participating groups as measured by the normalized RMSD, GDT_HA, SphGr, QCS, scores (Figure 5) and normalized GDT_TS, LDDT, CAD scores (Supporting Information Figure S5). While the ranking changes when different metrics are used, some CASP groups remain consistently in the top. These include the following four groups: GOAL (from J. Lee’s research group), Seok (from C. Seok’s research group), BAKER (from D. Baker’s research group), and FEIG (from M. Feig’s research group).
FIGURE 5.

Overall performance by group as measured by RMSD, GDT_HA, SphGr and QCS Z-scores. Each panel shows boxplots of per-target Z-scores for a specific measure. Groups are ordered left to right by the sum of RMSD Z-scores (top panel, higher is better). Missing predictions are assigned a value of −2 for each target. The number of submitted targets for each group are reported in gray on top of the box plots for MolPrb
Figure 6 reports how many times the best CASP12 groups appear among the best 10 according to eight evaluation metrics (RMSD, GDT_HA, GDT_TS, SphGr, LDDT, CAD, QCS, and MolPrb). Seok and GOAL have the best cumulative score according to three metrics each: GDT_TS, LDDT, and CAD for Seok; RMSD, QCS, and SphGr for GOAL. FEIG and BAKER appear as the best in one metric each (GDT_HA and MolPrb, respectively). Some methods such as SVMQA, LEE, LEEab GOAL_COMPLEX (all from J. Lee’s research group and similar to GOAL) and Seok-server (similar to Seok) as well as FLOUDAS REFINESERVER (herein referred to as FLOUDAS_REFI), Kiharalab and STAP also appear among the first 10 groups. Moreover, BAKER, Seok, Seok-server, and SVMQA on average perform better than the “naïve method,” regardless of the metric used. The “best 10” methods according to each single metric are reported in Supporting Information Figure S6.
FIGURE 6.
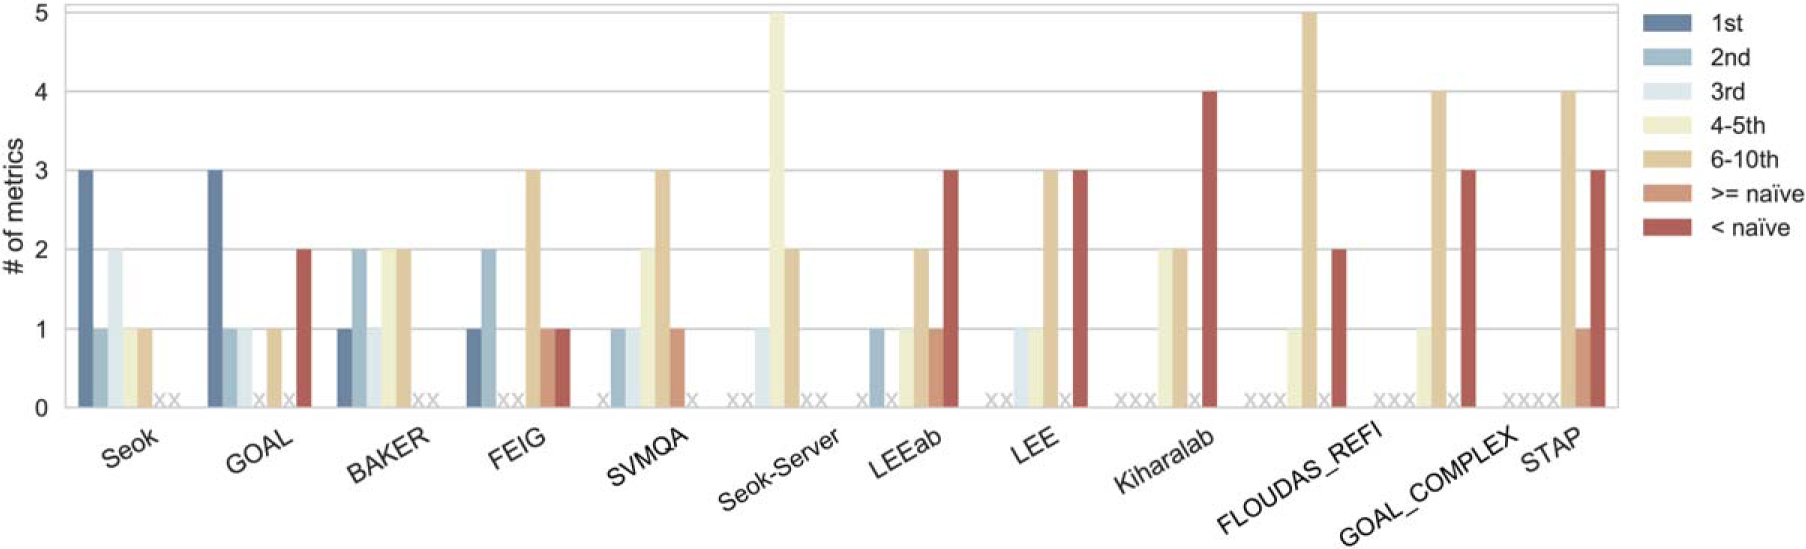
Cumulative group ranking for the eight selected metrics. The plot shows the number of times a group appears with a particular ranking in the best 10 models according to the various metrics considered separately. When a group is not in the best 10, we report whether the score is better or worse than that of the “naïve” submission. Thus, the sum of all bar heights for each group is always equal to eight (total number of metrics). Only groups appearing among the best 10 according to at least 2 metrics are shown
3.3 |. The CASP12 score
The assessor’s formula for ranking groups in CASP is generally defined as a combination of different metrics. As discussed in previous CASP experiments,7,31 this is due to two considerations: single standard scores, such as RMSD and GDT_HA, may miss promising models40,41 and different metrics may suggest different rankings (as shown in Supporting Information Figures S6–S8). Examples of discrepancies in rankings according to different metrics are shown in Figure 7 for targets TR882 and TR948. It can be seen that different models scored very high with respect to either SphGr (left) or GDT_HA (right) metrics and at the same time very low with respect to the other score.
FIGURE 7.

Discrepancies between the GDT_HA and SphereGrinder scores for two different models on two refinement targets—TR882 and TR948. The target structure is colored blue, the starting model—gray and the prediction—based on per-residue distances (A) between the corresponding Ca atoms in the superposition, ranging from green (improved over starting model) to yellow (no improvement) and red (worse). For clarity, part of the structure has been removed from target TR948
In CASP12, we had a high percentage of FM and FM/TBM targets (45%). Manual inspection41 has been traditionally used to evaluate this kind of targets in CASP. The main reason behind this was the reduced reliability of standard scores in FM. It is for instance well known that GDT_HA score may give preference to models containing small but precisely modeled substructures over those with a good topology and general fold.40,41 Manual assessment, on the contrary, is better suited to assess the general fold, the relative arrangement of secondary structure elements and local hydrogen bond networks. However, it requires significant time investment and might suffer from being subjective.
To benefit from manual assessment while minimizing the pitfalls of subjectiveness and avoiding the definition of arbitrary weights for the different metrics, we used a machine learning approach to devise a linear combination of standard scores based on the visual inspection. Four assessors (LH, VO, HY, and GS) visually inspected all “model 1” predictions for 14 targets (33%) and each independently scored them. The visually inspected targets have the same fraction of FM, TBM/FM, and TBM targets as the complete set of targets.
The targets were divided in 2–4 regions (depending on the length of the target) and each evaluator carefully assessed their global and local structure, with specific focus on features (such as the length, position, and reciprocal orientation of secondary structure elements and hydrogen bond networks) that might increase the usefulness of the refined structure for docking, molecular replacement, and so forth. The final scores from different evaluators (ranging from −5 to +5) were in remarkable agreement (see an example of target TR876 in Figure S9 in Supporting Information). We then converted the raw manual scores to standard Z-scores, and derived optimal weights for Z-scores Zm of each metric m in our subset, defining the final score as:
under the normalization condition: , where n is the number of metrics selected (8 in our case). For the purpose of optimizing the coefficients, we used both an MC simulation and a GA. Ultimately, the GA was able to push the optimization further in preliminary analysis and was used exclusively. The procedure involves the iterative generation of N = 1000 sets of trial coefficients (with i = 1…,N) and defining a fitness function , which selects the best sets. In the first iteration, all 1000 sets are randomly generated. At every subsequent iteration, the best 5% (50) sets of coefficients are retained and a further 250 random sets are randomly generated. To have an ensemble of 1000 sets again, 700 {cm} sets are generated by averaging the coefficients between randomly chosen pairs of sets. As we are interested in reproducing the ranking obtained with our manual assignment, we defined f (c;) as the Spearman rank correlation coefficient calculated using the ranking resulting from our manual assignment and the one resulting using the current score:
where the are the coefficients at the current step. After some trials with various combinations, we considered only the rank of the six best models according to our manual assignment and the proposed score, for every manually evaluated target. After 100 iterations, the weights converged, resulting in formula:
where the weights for ZLDDT and ZCAD were manually excluded from the final score as they were approaching zero and GDT_TS was very strongly correlated with GDT_HA.
As expected, the ranking obtained by the final score correlates better with the ranking obtained by visual inspection than those obtained by CASP10 and CASP11 scores (Supporting Information Figure S10).
We were initially surprised by the high coefficient of the RMSD. However, the ranking is robust upon constraining RMSD to 20% or less. Fixing the coefficient for ZRMSD at 0.2 and that for ZMolPrb at 0.02, the ranking with this “restricted” CASP12 score is very similar to the original CASP12 ranking (see Supporting Information Table S2).
It should also be noted that the inclusion of MolProbity worsens the correlation with the manual assessment. By excluding ZMolPrb and reoptimizing the coefficients, the Spearman rank correlation coefficient increases to 0.491 from the 0.467 of . This shows that the local stereochemistry of the models is not a priority for most groups. Thus, we decided to retain the MolProbity score, albeit with a small coefficient, to continue encouraging predictors to fix the local stereochemistry of their models.
The performance of different groups according to the score is reported in Figure 8 and Table 2. GOAL ranks narrowly first, followed by Seok and BAKER with almost indistinguishable scores, Seok_server (similar to Seok, see description below), SVMQA (similar to GOAL) and FEIG. For comparison, the rankings on CASP10 and CASP11 assessor-defined scores are reported in Supporting Information Figure S11 and Table S1.
FIGURE 8.

Overall performance by group as measured by the assessors score. Groups are ordered left-to-right by their rank (i.e., decreasing sum of over all targets)
TABLE 2.
Group ranking
| Rank | Model 1 | Best model |
|---|---|---|
| 1 | GOAL | GOAL |
| 2 | Seok | BAKER |
| 3 | BAKER | Seok |
| 4 | Seok-server | SEOK-server |
| 5 | SVMQA | LEEAB |
| 6 | FEIG | LEE |
| 7 | LEEab | FEIG |
| 8 | Kiharalab | SVMQA |
| 9 | GOAL_COMPLEX | KIHARALAB |
| 10 | LEE | GOAL_COMPLEX |
The final rankings by CASP12 and CASP11 scores are similar. For instance, only in 10 of the 42 targets does the highest scoring model 1 according to the CASP12 score differ from the highest scoring model according to the CASP11 score (Supporting Information Table S3). In 4 of these 10 cases, the highest scoring models according to the CASP12 score are clearly more accurate than the highest scoring models according to the CASP11 score (Supporting Information Figures S12–15), in one case the highest scoring model according to CASP11 is marginally better than the one of CASP12 and in the remaining six cases the difference is negligible. We also tested if applying the score to CASP11 targets would yield different top models. For most targets, the top-ranking predictions are the same, with the exception of six targets (TR217, TR288, TR280, TR760, TR774, and TR795). In three cases (TR217, TR288, and TR280) the highest scoring model according to the CASP12 score are more accurate, while in the remaining three cases the differences are too small to be significant (see Supporting Information Table S4 for detailed analysis).
All top 10 refinement methods outperformed the naïve submission in CASP12 improving both the backbone conformation and the side-chain positioning. The difference between the top six methods is very small. This is confirmed by both a pair-wise Wilcoxon signed-rank test and a global Friedman test that concur that their performances are marginally different.
Based on the results, we can roughly classify the methods in two categories: “conservative” and “adventurous.” The conservative methods typically yield structures that are close to the initial ones and which score in a narrow range around the starting model’s score. Seok and FEIG’s approaches belong to this category. Adventurous methods seem to have the ability to substantially improve the structures in some cases, counterbalanced by a significant worsening in other cases (e.g., BAKER).
3.4 |. Details of the best methods
The GOAL method uses the similarity between the given refinement model and a list of templates generated by their fold recognition methods to select the best template and generate a new starting model, on which a refinement protocol similar to Princeton_Tigress MD-only is used.42 A number of minimization steps with gradually reduced positional restraints and short restrained MD simulations are performed. At difference with Princeton_Tigress, GOAL uses the AMBER ff14SB18 force field and explicit TIP3P water.43 GOAL’s variant, LEE, uses modeling server models for initial clustering and the same refinement protocol. SVMQA and GOAL_COMPLEX use the same initial structures as GOAL, but perform a series of shorter MD simulations (5 ns in total) using positional restraints. SVMQA complements the force-field with the DFIRE statistical energy term.29
The Seok method first predicts the inaccurate regions of the starting model and then, it performs an extended structural sampling on those regions by normal mode analysis and secondary structure perturbations/hybridization, followed by short MD relaxation with a hybrid potential.44 The difference between the Seok and Seok-server methods is that the latter submitted server predictions with no human intervention, while in the Seok predictions some of the final conformations are manually selected and the error estimation results are modified after human inspection.44
The BAKER group performs a large scale conformational sampling using the Rosetta hybridization protocol followed by restrained MD simulations with the AMBER ff12SB force field and explicit TIP3P water on selected candidates. Depending on the distance of the starting structure from the target, either a high-resolution or a low-resolution protocol is used. In the former, Rosetta hybridization is only applied to rebuild local regions estimated to be less accurate, while in the low-resolution protocol, the iterative version is applied to rebuild the whole structure. For each of five selected Rosetta-refined models, 5 independent 10 ns-long MD simulations are performed and MD-refined models are ranked by the ensemble-average Rosetta energy.
The FEIG group uses by far the most extensive weakly restrained MD simulations (2–8 μs per target) with explicit solvent and the recently reparameterized CHARMM36m force field.21 From the MD structural ensembles a subset of structures is selected and averaged before finishing with detailed refinement of the local stereochemistry using “locPREFMD.”45
Kiharalab uses a combination of energy minimization, short and long MD simulations with the CHARMM22/CMAP force field and an implicit solvent.
As it can be seen from Figure 9, the GOAL method works best on targets with intermediate starting GDT_HA (40 < GDT_HA < 60) and those longer than 300 residues (see Figure 10 for an example). It also provides some well-refined targets in the GDT_HA < 40 range where the initial structure is far from the experimental structure. Seok’s approach ranks second in three categories (Starting GDT_HA>60; 40<Starting GDT_HA<60 and 150< Residues<300) and on average has the best GDT_TS (Supporting Information Figure S5). BAKER remarkably comes on top in targets with extreme starting GDT_HA (either >60 or <40), submitting a number of strikingly refined structures (see Figure 11 for an example). FEIG’s approach has on average the best GDT_HA scores (Figure 5) and ranks clearly first for smaller targets (<150 residues). This might reflect the fact that a strategy based purely on long MD simulations with accurate physics-based force fields and weak restrains (FEIG) is effective in exploring the conformational landscape of small proteins. However, large targets or those with low initial GDT_HA clearly benefit from combined methods where backbone-rebuilding methods are used before MD. Alternatively, enhanced sampling MD has clear potential, as shown by the remarkable refinement of some more complex targets by the group Laufer_seed (Figure 10).
FIGURE 9.
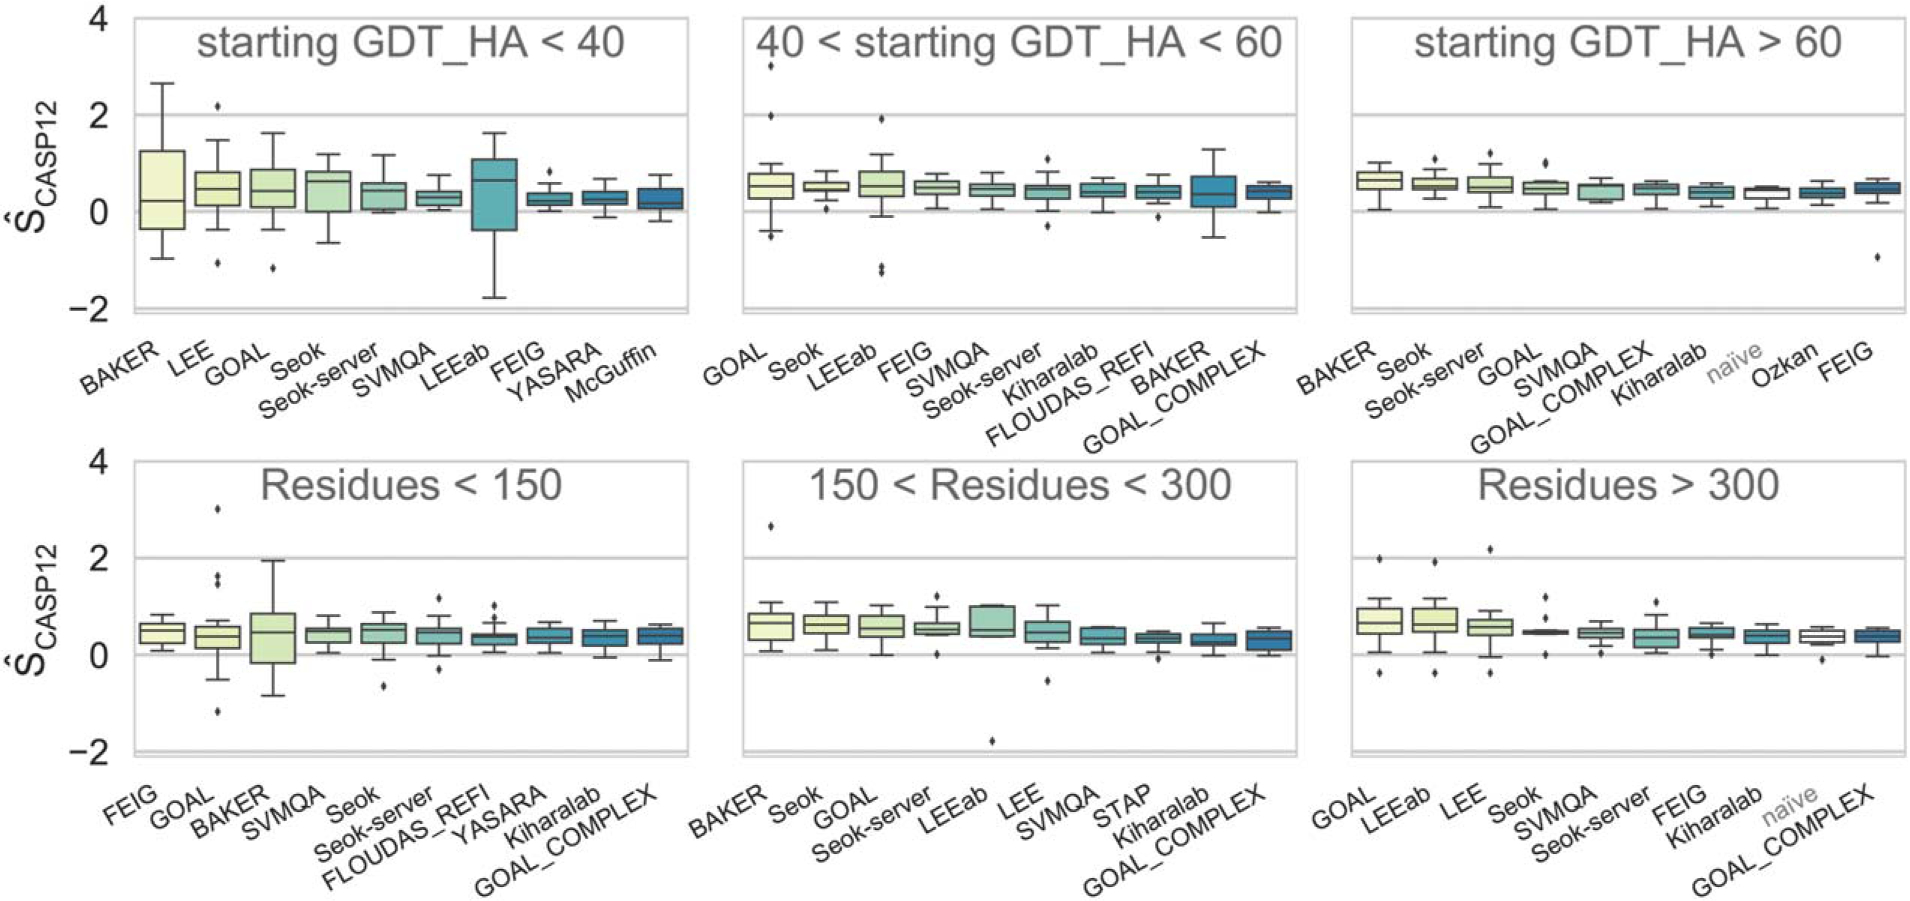
Overall performance by group as measured by the assessors score on the targets grouped into three bins based on the starting model’s GDT_HA (top row) and target size (lower row). Groups in each panel are ordered left-to-right by their rank (decreasing sum of over all targets). Only the first submitted models are considered
FIGURE 10.
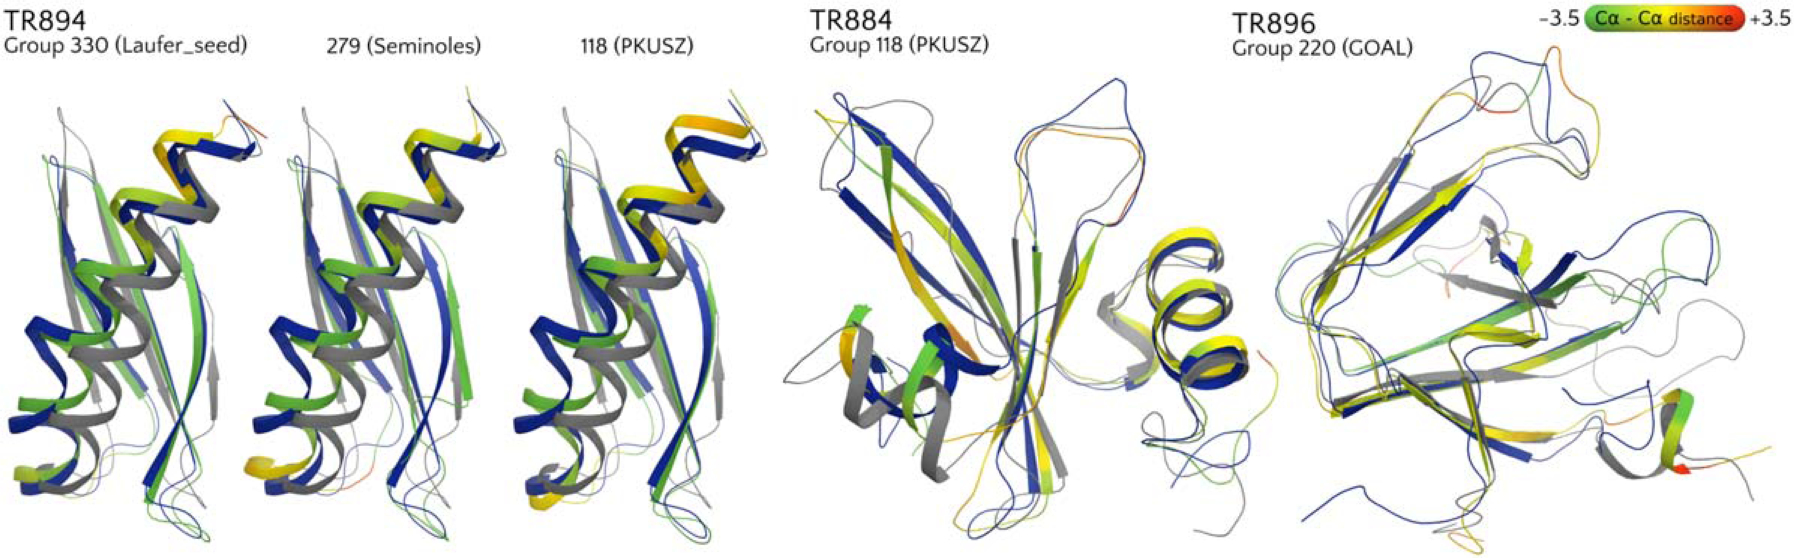
Some examples of notable refinement. The target structure is shown in blue, the starting model in gray and the prediction with a color scale based on per-residue distances (A) between the corresponding Ca atoms in the superposition, ranging from green (improved over starting model) to yellow (no improvement), and red (worse)
FIGURE 11.

Four predictions that improved over the starting model for target TR594 by >10 GDT_HA points The target structure is shown in blue, the starting model in gray and the prediction with a color scale based on ΔRMSD ranging from green (improved over starting model) to yellow (no improvement) and red (worse)
3.5 |. Accuracy of model 1 compared with the other models
CASP12 participants were allowed to submit five models per target. The additional submissions allow predictors to test different models, different versions of their methods or even completely different strategies. As in previous CASP experiments, we assessed the ability of different groups to identify their best models and protocols (tentatively model 1) out of the submitted ones. This is often an important task, as many approaches provide a number of structures and some methods include a final MD simulation, which generates a large ensemble of structures. A few methods based on structure selection and averaging have been developed to this end.11,46 GOAL, the top scoring approach according to the CASP12 score, uses a combination of trajectory averaging of atomistic explicit solvent MD simulations and energy minimization with an implicit solvent to address this issue. BAKER combines large scale conformational search using Rosetta with multiple 10 ns-long MD simulations, run with the AMBER ff12SB force field and explicit TIP3P water. Structural averaging was used to obtain the representative conformation from the MD simulations.
In Figure 12, we report the ability of each group to correctly identify their best model (or protocol). On average, the groups were not able to correctly identify the best model (they did little better than random by identifying the best model in 30% of the cases). The best groups in this component of the analysis, MESHI and Kiharalab, succeeded in >60% of the targets. GOAL and Seok identified their best models/protocols in about 30% of cases, while BAKER identified the best model only in 24% of cases. The BAKER group would have ranked second according to the CASP12 score if the best models (instead of Model 1) were considered, showing further potential for improvement of their protocol.
FIGURE 12.
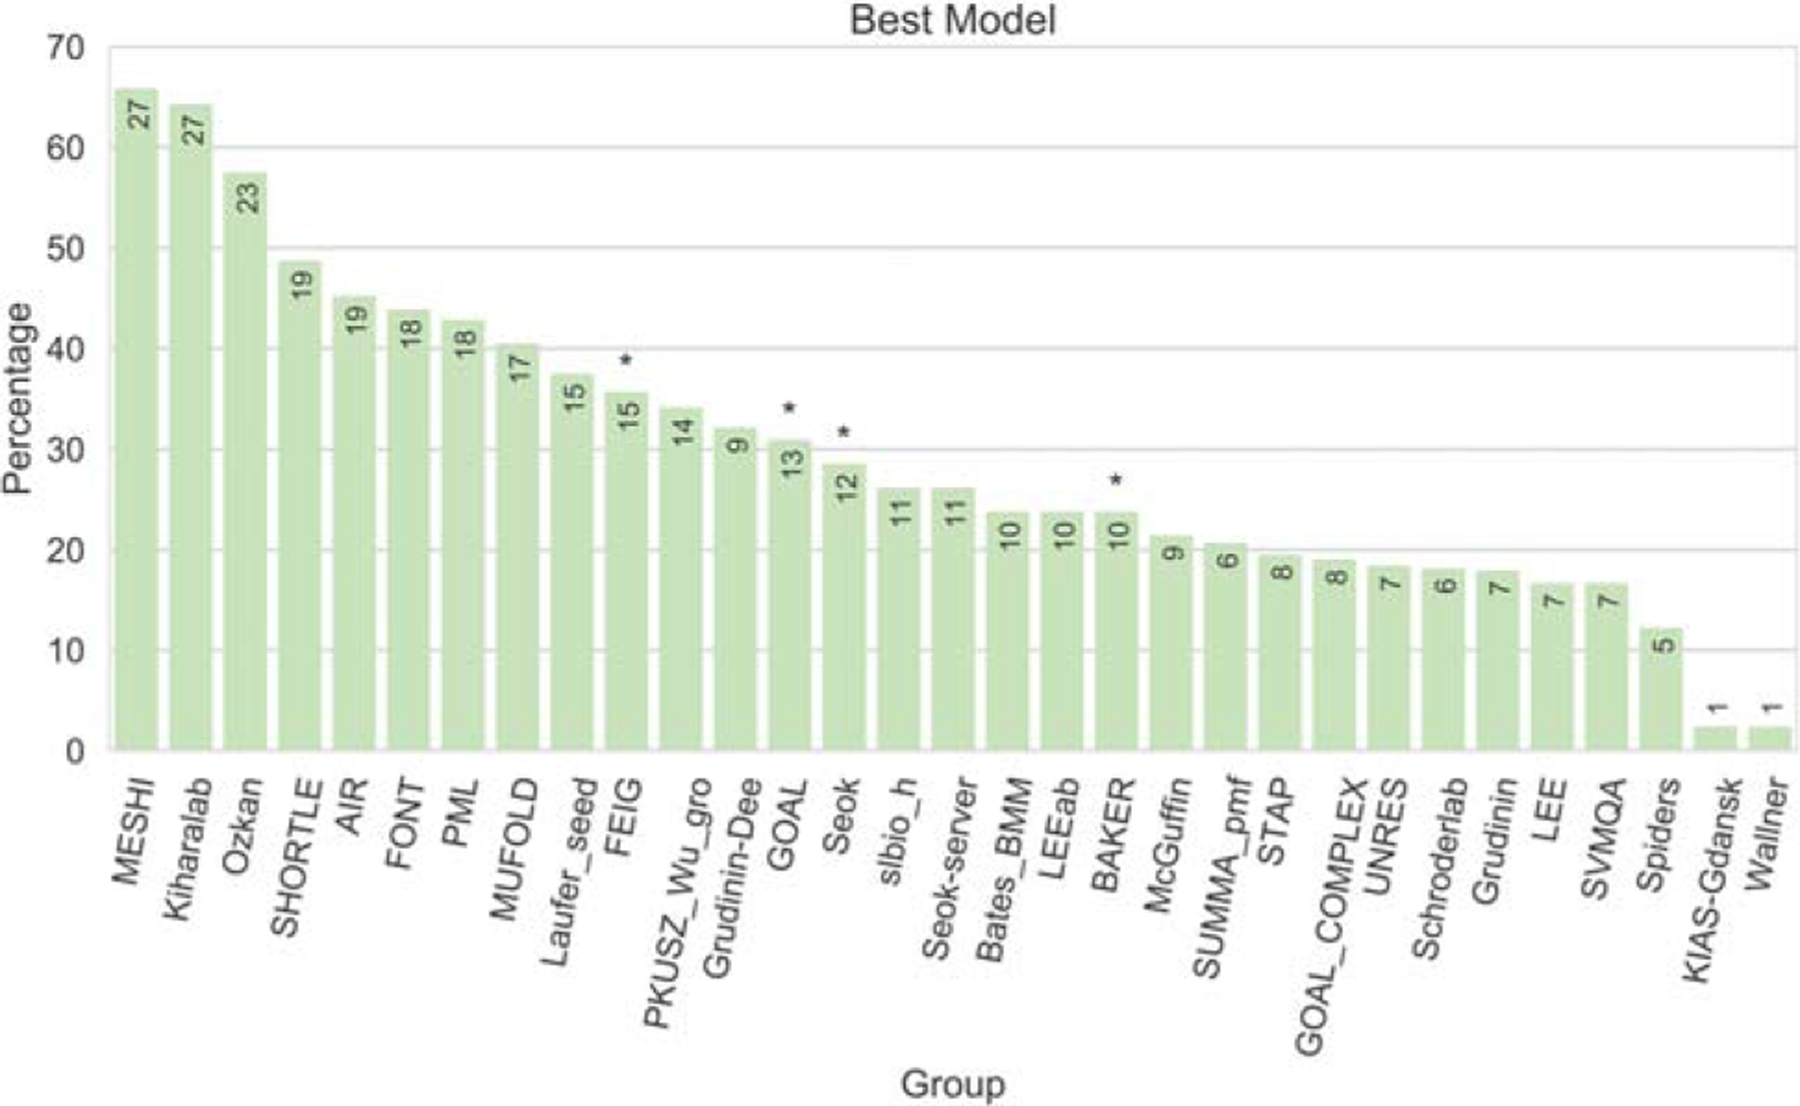
Best model or method selection. The plot reports the percentage of submitted models #1 that correspond to the best of the five submitted models. The numbers on top of the bars report the number of model 1 s corresponding to the best models (not all groups submitted models for all targets). The asterisks mark the CASP12 top performers
FEIG submitted as model 1 the predictions from the most comprehensive and expensive MD-based protocol. This reassuringly resulted in 36% of models 1 being the best model, showing that longer MD sampling indeed helps the refinement (and perhaps combining it with enhanced sampling algorithms might help even more).
3.6 |. Progress since CASP11
An important question addressed at every CASP meeting is the progress since last CASP. Comparison of the CASP12 results with those from two previous experiments is reported in Figure 13. The comparison shows the considerable improvement observed in CASP11 over CASP10, which, in turn, had already shown the most remarkable results since the inception of the refinement category in CASP8. CASP12 appears to consolidate the results of CASP11, showing similar global refinement when all submissions are considered. However, it is important to bear in mind that the targets are different in each CASP experiment, and we believe that the targets we released in this edition were more challenging, being both larger (including targets longer than 300 amino acids), more diverse and requiring more local refinement. In particular, six CASP12 targets were especially challenging: TR869, TR870, and TR898 had starting GDT-HA <30 and protein size larger than 100 amino acids, while targets TR890, TR901, and TR905 had a starting GDT_HA <35 and protein size larger than 180 amino acids. It is thus reassuring to observe that the CASP12 predictions were as good as or better than CASP11 predictions.
FIGURE 13.
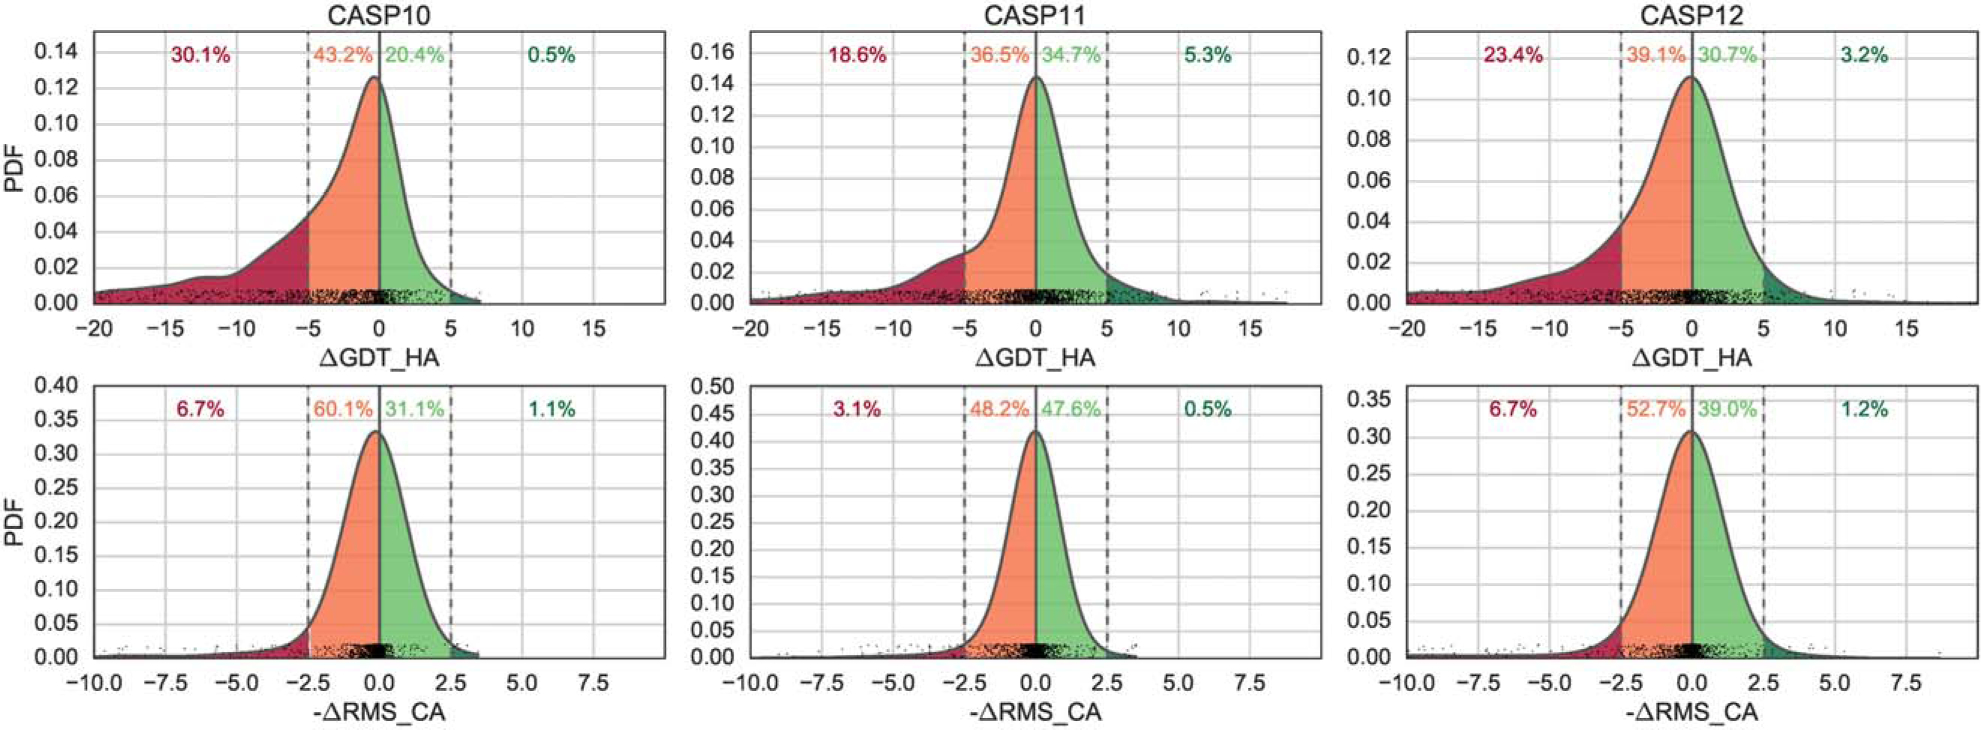
Normalized probability distributions of ΔGDT HA and ΔRMSD scores in the latest three CASPs; y axis shows values of the probability density function of the distribution
4 |. DISCUSSION AND CONCLUSIONS
In the CASP12 refinement experiment, we have assessed the performance of 39 groups in refining 42 targets.
For ranking purposes, we used a combination of standard Z-scores provided by the Structure Prediction Center. We used a machine learning algorithm to select the weights for combining Z-scores so that they correlate in the best way with the manually curated rankings performed by 4 independent evaluators on 33% of the targets. Although the final ranking is similar to that obtained with the CASP11 score, we believe that the new score is better able to distinguish useful refinements (see Supporting Information Figures S11–S14).
CASP12 witnessed yet another step forward in the development of effective refinement algorithms. The methods were tested on the most diverse set of targets ever used in the refinement-CASP. Despite the challenging refinement target set, the CASP12 results proved to be on par with those from the previous CASP.
The best CASP12 methods can be roughly categorized as “conservative” (Seok and FEIG) and “adventurous” (BAKER and, to some extent, GOAL and similar methods from Lee’s research group), with the first group of methods consistently refining the initial structures by a small amount and worsening few structures and the second group submitting some spectacular refinement but worsening a larger number of targets.
All best performing groups use restrained MD simulations, alone (FEIG and Kiharalab) or in combination with other approaches (GOAL, Seok, and BAKER). Seven out of ten run MD simulations with physics-based force fields (AMBER ff12SB, ff14SB, and CHARMM36m) and explicit solvent, while three (Seok, Seok-server, and Kiharalab) use a hybrid potential or an implicit solvent.
The GOAL method was the top performer according to the CASP12 score. This excellent result was obtained by combining an effective strategy to select the best templates to remodel the initial structures provided, followed by short MD runs with a good protein force field (AMBER ff14SB) and explicit solvent. As almost 30% of the starting structures for refinement came from the GOAL server, there was a risk of diminishing returns for the starting model rebuilding strategy. Indeed, Figure 14 shows the difference in performance depending on the origin of the starting structure as measured by increase in GDT_HA. As expected, the median is clearly affected (and goes below zero) when the starting structure comes from the group itself. Still, even in these cases, GOAL was capable of some significant refinements, up to 13 GDT_HA units, showing the effectiveness of the MD refinement approach.
FIGURE 14.

Comparison of the refinement achieved by group 220 (GOAL) on targets for which the starting structure was provided by GOAL itself (“start”) or by other groups (“not-start”)
The BAKER method proved to be capable of generating striking refinements for difficult targets. The method ranked easier first on the targets in the difficult GDT_HA <40 category and in the easier GDT_HA >60 category. According to the authors, the method was in part limited by insufficient sampling and by failure of correcting sequence alignment errors,47 showing a clear potential to emerge as a very robust and reliable refinement method across all categories. Seok’s approach showed the ability to reliably refine almost all targets, albeit by a smaller amount. It is currently the best choice in terms of reliability. FEIG’s approach does extremely well for small targets (<150 residues) and provides the best GDT_HA improvement on average. However, being based on weakly restrained MD with a physics-based potential, it is penalized to a greater extent for missing structure-defining contacts (ligands, multimeric protein-protein contacts) and needs more extensive sampling and perhaps a different restraint strategy on larger and more difficult targets. Indeed, the use of positional restraints and plain (nonenhanced) MD keeps the refined structure close to the initial one and makes it particularly difficult to refine targets with low starting GDT-HA. Interestingly, the authors convincingly show that increasing the MD sampling yields better refined models.45 An additional group that did better than the naïve method is Kiharalab, again with an MD-based protocol and an implicit solvent model.
It is worth bearing in mind that missing contacts are almost unavoidable in larger CASP targets, thus penalizing the strategies based on pure-MD. However, a special “high resolution” category might be introduced in future CASPs to address this problem.
Even among the second-tier groups, a few approaches delivered remarkably refined models for a subset of the targets, while performing modestly overall (see Figures 4 and 5). These include groups PKUSZ, Seminoles, Schroderlab, and Laufer_seed. The latter uses MD with an enhanced sampling approach (MELD).26 Indeed, when considering the number of times their models ranked first for a target (Supporting Information Figure S7), or had a Z-score >1.5 units (Supporting Information Figure S8), these groups perform as well as the top ones and provide a number of remarkably refined structures, see for instance Figure 10. With further development, any of these approaches has the potential of ranking very highly in future CASP refinement experiments, especially if a “high-resolution” category is introduced.
Although the combination of restrained MD simulations with accurate force-fields is clearly useful in protein structure refinement and has been adopted by most top-ranking groups, the larger and more difficult targets introduced in the CASP12 refinement challenge made clear the limits of this approach. When the starting structure is large or far from the target, restrained-MD works best when combined with methods that perform a more extensive sampling of the backbone conformational space. Indeed, limited sampling has been cited by the top performing research groups as a common cause of concern. According to their authors, both Feig’s “pure-MD” and Baker’s hybrid method might have benefited from more extensive conformational sampling. In this respect, the use of enhanced sampling methods might be very beneficial, as shown by some remarkable refinements already obtained by some groups (such as Laufer_Seed). Methods combining coevolutionary data and MD simulations with hybrid force fields and enhanced sampling algorithms48 might also lead to further progress.
4.1 |. Ideas for future CASP refinement experiments
The experience in assessing the CASP12 refinement category has led us to propose a subdivision in two categories along the lines of high and low resolution refinement. The former category should include smaller targets providing all structure defining contacts (including ligands and co-factors). In this category, the use of starting structures different from the ones provided by the organizers should be strongly discouraged. This should provide a level ground and allow a fair comparison of MD-based and similar “pure refinement” approaches, including those avoiding explicit restraints and using enhanced-sampling algorithms, with hybrid methods. The low-resolution category (low starting GDT_HA) should cater to more adventurous methods and reward pipelines that include a systematic effort to locally rebuild the backbone of FM predictions with knowledge-based approaches that might do well even in the absence of important structure-defining contacts. An additional consideration arises by the lack of correlation of the MolProbity score with all the other quality scores. It is desirable that the role of this score in the future assessments is discussed before the start of the next experiment.
Supplementary Material
ACKNOWLEDGMENTS
This article is dedicated to Anna Tramontano.
The authors thank the CASP organizers and the Structure Prediction Center for their support. They thank and applaud the predictors for their participation, achievements, and useful comments at the CASP12 meeting. They thank Lucas Siemons for useful discussions. Support for this work was provided by BBSRC (PhD CASE Studentship to VO and London Interdisciplinary Doctoral Programme Fellowship to HY), A*STAR (Joint UCL-MAPS PhD studentship to LH) and the Wellcome Trust (PhD studentship to LS). GS and FLG acknowledge EPSRC [grant no EP/M013898/1; EP/P011306/1 and EP/P022138/1] for financial support. VO and FLG acknowledge BBSRC [grant no BB/L502388/1] for financial support. HY acknowledges BBSRC [grant no. BB/M009513/1] for financial support. AK acknowledges support of the US National Institute of General Medical Sciences (NIGMS/NIH), grant GM100482.
Funding information
BBSRC (PhD CASE Studentship and London Interdisciplinary Doctoral Programme Fellowship), Grant/Award Numbers: BB/L502388/1 and BB/M009513/1; A*STAR (Joint UCL-MAPS PhD studentship); Wellcome Trust (PhD studentship); EPSRC, Grant/Award Numbers: EP/M013898/1, EP/P011306/1, and EP/P022138/1
Footnotes
SUPPORTING INFORMATION
Additional Supporting Information may be found online in the supporting information tab for this article.
REFERENCES
- [1].MacCallum JL, Hua L, Schnieders MJ, Pande VS, Jacobson MP, Dill KA. Assessment of the protein-structure refinement category in CASP8. Proteins. 2009;77(S9):66–80. [DOI] [PMC free article] [PubMed] [Google Scholar]
- [2].Zhang Y Protein structure prediction: when is it useful? Curr. Opin. Struct. Biol. 2009;19(2):145–155. [DOI] [PMC free article] [PubMed] [Google Scholar]
- [3].Sliwoski G, Kothiwale S, Meiler J, Lowe EW. Computational Methods in Drug Discovery. Pharmacol. Rev. 2014;66(1):334–395. [DOI] [PMC free article] [PubMed] [Google Scholar]
- [4].Becker OM, Dhanoa DS, Marantz Y, et al. An integrated in silico 3D model-driven discovery of a novel, potent, and selective amidosulfonamide 5-HT1A agonist (PRX-00023) for the treatment of anxiety and depression. J. Med. Chem. 2006;49:3116–3135. [DOI] [PubMed] [Google Scholar]
- [5].Giorgetti A, Raimondo D, Miele AE, Tramontano A. Evaluating the usefulness of protein structure models for molecular replacement. Bioinformatics. 2005;21(Suppl 2):ii72–ii76. [DOI] [PubMed] [Google Scholar]
- [6].Qian B, Raman S, Das R, et al. High-resolution structure prediction and the crystallographic phase problem. Nature. 2007;450(7167):259–264. [DOI] [PMC free article] [PubMed] [Google Scholar]
- [7].Nugent T, Cozzetto D, Jones DT. Evaluation of predictions in the CASP10 model refinement category. Proteins. 2014;82:98–111. [DOI] [PMC free article] [PubMed] [Google Scholar]
- [8].Xu D, Zhang J, Roy A, Zhang Y. Automated protein structure modeling in CASP9 by I-TASSER pipeline combined with QUARK-based ab initio folding and FG-MD-based structure refinement. Proteins. 2011;79(S10):147–160. [DOI] [PMC free article] [PubMed] [Google Scholar]
- [9].Park H, Ko J, Joo K, Lee J, Seok C, Lee J. Refinement of protein termini in template-based modeling using conformational space annealing. Proteins. 2011;79(9):2725–2734. [DOI] [PubMed] [Google Scholar]
- [10].Raval A, Piana S, Eastwood MP, Dror RO, Shaw DE. Refinement of protein structure homology models via long, all-atom molecular dynamics simulations. Proteins. 2012;80:2071–2079. [DOI] [PubMed] [Google Scholar]
- [11].Mirjalili V, Feig M. Protein structure refinement through structure selection and averaging from molecular dynamics ensembles. J. Chem. Theory Comput. 2013;9(2):1294–1303. [DOI] [PMC free article] [PubMed] [Google Scholar]
- [12].Park H, DiMaio F, Baker D. CASP11 refinement experiments with ROSETTA. Proteins. 2016;84:314–322. [DOI] [PMC free article] [PubMed] [Google Scholar]
- [13].Feig M, Mirjalili V. Protein structure refinement via molecular-dynamics simulations: what works and what does not? Proteins. 2016;84:282–292. [DOI] [PMC free article] [PubMed] [Google Scholar]
- [14].Lee GR, Heo L, Seok C. Effective protein model structure refinement by loop modeling and overall relaxation. Proteins. 2016;84: 293–301. [DOI] [PubMed] [Google Scholar]
- [15].Della Corte D, Wildberg A, Schröder GF. Protein structure refinement with adaptively restrained homologous replicas. Proteins. 2016;84:302–313. [DOI] [PubMed] [Google Scholar]
- [16].Lindorff-Larsen K, Piana S, Palmo K, et al. Improved side-chain torsion potentials for the Amber ff99SB protein force field. Proteins. 2010;78:1950–1958. [DOI] [PMC free article] [PubMed] [Google Scholar]
- [17].Best RB, Buchete NV, Hummer G. Are current molecular dynamics force fields too helical? Biophys J. 2008;95(1):L07–L09. [DOI] [PMC free article] [PubMed] [Google Scholar]
- [18].Maier JA, Martinez C, Kasavajhala K, Wickstrom L, Hauser KE, Simmerling C. ff14SB: improving the accuracy of protein side chain and backbone parameters from ff99SB. J. Chem. Theory Comput. 2015; 11(8):3696–3713. [DOI] [PMC free article] [PubMed] [Google Scholar]
- [19].Robertson MJ, Tirado-Rives J, Jorgensen WL. Improved peptide and protein torsional energetics with the OPLSAA Force Field. J. Chem. Theory Comput. 2015;11(7):3499–3509. [DOI] [PMC free article] [PubMed] [Google Scholar]
- [20].Best RB, Zhu X, Shim J, et al. Optimization of the Additive CHARMM All-Atom Protein Force Field Targeting Improved Sampling of the Backbone φ, ψ and Side-Chain χ 1and χ 2Dihedral Angles. J. Chem. Theory Comput. 2012;8(9):3257–3273. [DOI] [PMC free article] [PubMed] [Google Scholar]
- [21].Huang J, Rauscher S, Nawrocki G, et al. CHARMM36m: an improved force field for folded and intrinsically disordered proteins. Nat Chem Biol. 2017;14:71–73. [DOI] [PMC free article] [PubMed] [Google Scholar]
- [22].Lindorff-Larsen K, Piana S, Dror RO, Shaw DE. How Fast-Folding Proteins Fold. Science. 2011;334(6055):517–520. [DOI] [PubMed] [Google Scholar]
- [23].Sutto L, Marsili S, Gervasio FL. New advances in metadynamics. WIREs Comput. Mol. Sci. 2012;2(5):771–779. [Google Scholar]
- [24].Cavalli A, Spitaleri A, Saladino G, Gervasio FL. Investigating Drug-Target Association and Dissociation Mechanisms Using Metadynamics-Based Algorithms. Acc. Chem. Res. 2014;8:277–285. [DOI] [PubMed] [Google Scholar]
- [25].Pan AC, Weinreich TM, Piana S, Shaw DE. Demonstrating an order-of-magnitude sampling enhancement in molecular dynamics simulations of complex protein systems. J. Chem. Theory Comput. 2016;12(3):1360–1367. [DOI] [PubMed] [Google Scholar]
- [26].Perez A, Morrone JA, Simmerling C, Dill KA. Advances in free-energy-based simulations of protein folding and ligand binding. Curr. Opin. Struct. Biol. 2016;36:25–31. [DOI] [PMC free article] [PubMed] [Google Scholar]
- [27].Samudrala R, Moult J. An all-atom distance-dependent conditional probability discriminatory function for protein structure prediction. J. Mol. Biol. 1998;275:895–916. [DOI] [PubMed] [Google Scholar]
- [28].Lu H, Skolnick J. A distance-dependent atomic knowledge-based potential for improved protein structure selection. Proteins. 2001;44 (3):223–232. [DOI] [PubMed] [Google Scholar]
- [29].Zhou H, Zhou Y. Distance-scaled, finite ideal-gas reference state improves structure-derived potentials of mean force for structure selection and stability prediction. Protein Sci. 2009;11(11):2714–2726. [DOI] [PMC free article] [PubMed] [Google Scholar]
- [30].Chopra G, Kalisman N, Levitt M. Consistent refinement of submitted models at CASP using a knowledge-based potential. Proteins. 2010;78(12):2668–2678. [DOI] [PMC free article] [PubMed] [Google Scholar]
- [31].Modi V, Dunbrack RL. Assessment of refinement of template-based models in CASP11. Proteins. 2016;84:260–281. [DOI] [PMC free article] [PubMed] [Google Scholar]
- [32].MacCallum JL, Perez A, Schnieders MJ, Hua L, Jacobson MP, Dill KA. Assessment of protein structure refinement in CASP9. Proteins. 2011;79(S10):74–90. [DOI] [PMC free article] [PubMed] [Google Scholar]
- [33].Zemla A LGA: A method for finding 3D similarities in protein structures. Nucleic Acids Res. 2003;31(13):3370–3374. [DOI] [PMC free article] [PubMed] [Google Scholar]
- [34].Kryshtafovych A, Monastyrskyy B, Fidelis K. CASP11 statistics and the prediction center evaluation system. Proteins. 2016;84:15–19. [DOI] [PMC free article] [PubMed] [Google Scholar]
- [35].Zemla A, Venclovas C, Moult J, Fidelis K. Processing and analysis of CASP3 protein structure predictions. Proteins. 1999;37:22–29. [DOI] [PubMed] [Google Scholar]
- [36].Kryshtafovych A, Monastyrskyy B, Fidelis K. CASP prediction center infrastructure and evaluation measures in CASP10 and CASP ROLL. Proteins. 2014;82:7–13. [DOI] [PMC free article] [PubMed] [Google Scholar]
- [37].Mariani V, Kiefer F, Schmidt T, Haas J, Schwede T. Assessment of template based protein structure predictions in CASP9. Proteins. 2011;79(S10):37–58. [DOI] [PubMed] [Google Scholar]
- [38].Chen VB, Arendall WB, Headd JJ, et al. MolProbity: all-atom structure validation for macromolecular crystallography. Acta Crystallogr. D. Biol. Crystallogr. 2010;66:12–21. [DOI] [PMC free article] [PubMed] [Google Scholar]
- [39].Olechnovič K, Kulberkytė E, Venclovas Č. CAD-score: a new contact area difference-based function for evaluation of protein structural models. Proteins. 2013;81(1):149–162. [DOI] [PubMed] [Google Scholar]
- [40].Cong Q, Kinch LN, Pei J, et al. An automatic method for CASP9 free modeling structure prediction assessment. Bioinformatics. 2011; 27(24):3371–3378. [DOI] [PMC free article] [PubMed] [Google Scholar]
- [41].Jauch R, Yeo HC, Kolatkar PR, Clarke ND. Assessment of CASP7 structure predictions for template free targets. Proteins. 2007;69(8):57–67. [DOI] [PubMed] [Google Scholar]
- [42].Khoury GA, Tamamis P, Pinnaduwage N, Smadbeck J, Kieslich CA, Floudas CA. Princeton_TIGRESS: protein geometry refinement using simulations and support vector machines. Proteins. 2014;82(5):794–814. [DOI] [PubMed] [Google Scholar]
- [43].Cheng Q, Joung I, Lee J. A Simple and Efficient Protein Structure Refinement Method J. Chem. Theory Comput. 2017;13(10):5146–5162. [DOI] [PubMed] [Google Scholar]
- [44].Lee GR, Heo L, Seok C. Simultaneous refinement of inaccurate local regions and overall structure in the CASP12 protein model refinement experiment. Proteins, in press. doi: 10.1002/prot.25404 [DOI] [PubMed] [Google Scholar]
- [45].Heo L, Feig M. What makes it difficult to refine protein models further via molecular dynamics simulations? Proteins, in press. doi: 10.1002/prot.25393 [DOI] [PMC free article] [PubMed] [Google Scholar]
- [46].Mirjalili V, Noyes K, Feig M. Physics-based protein structure refinement through multiple molecular dynamics trajectories and structure averaging. Proteins. 2014;82:196–207. [DOI] [PMC free article] [PubMed] [Google Scholar]
- [47].Ovchinnikov S, Park H, Kim D, DiMaio F, Baker D. Protein structure prediction using Rosetta in CASP12. Proteins, in press. doi: 10.1002/prot.25390 [DOI] [PMC free article] [PubMed] [Google Scholar]
- [48].Sutto L, Marsili S, Valencia A, Gervasio FL. From residue coevolution to protein conformational ensembles and functional dynamics. Proc. Natl. Acad. Sci. USA 2015;112(44):13567–13572. [DOI] [PMC free article] [PubMed] [Google Scholar]
Associated Data
This section collects any data citations, data availability statements, or supplementary materials included in this article.