
FIGURE 12.
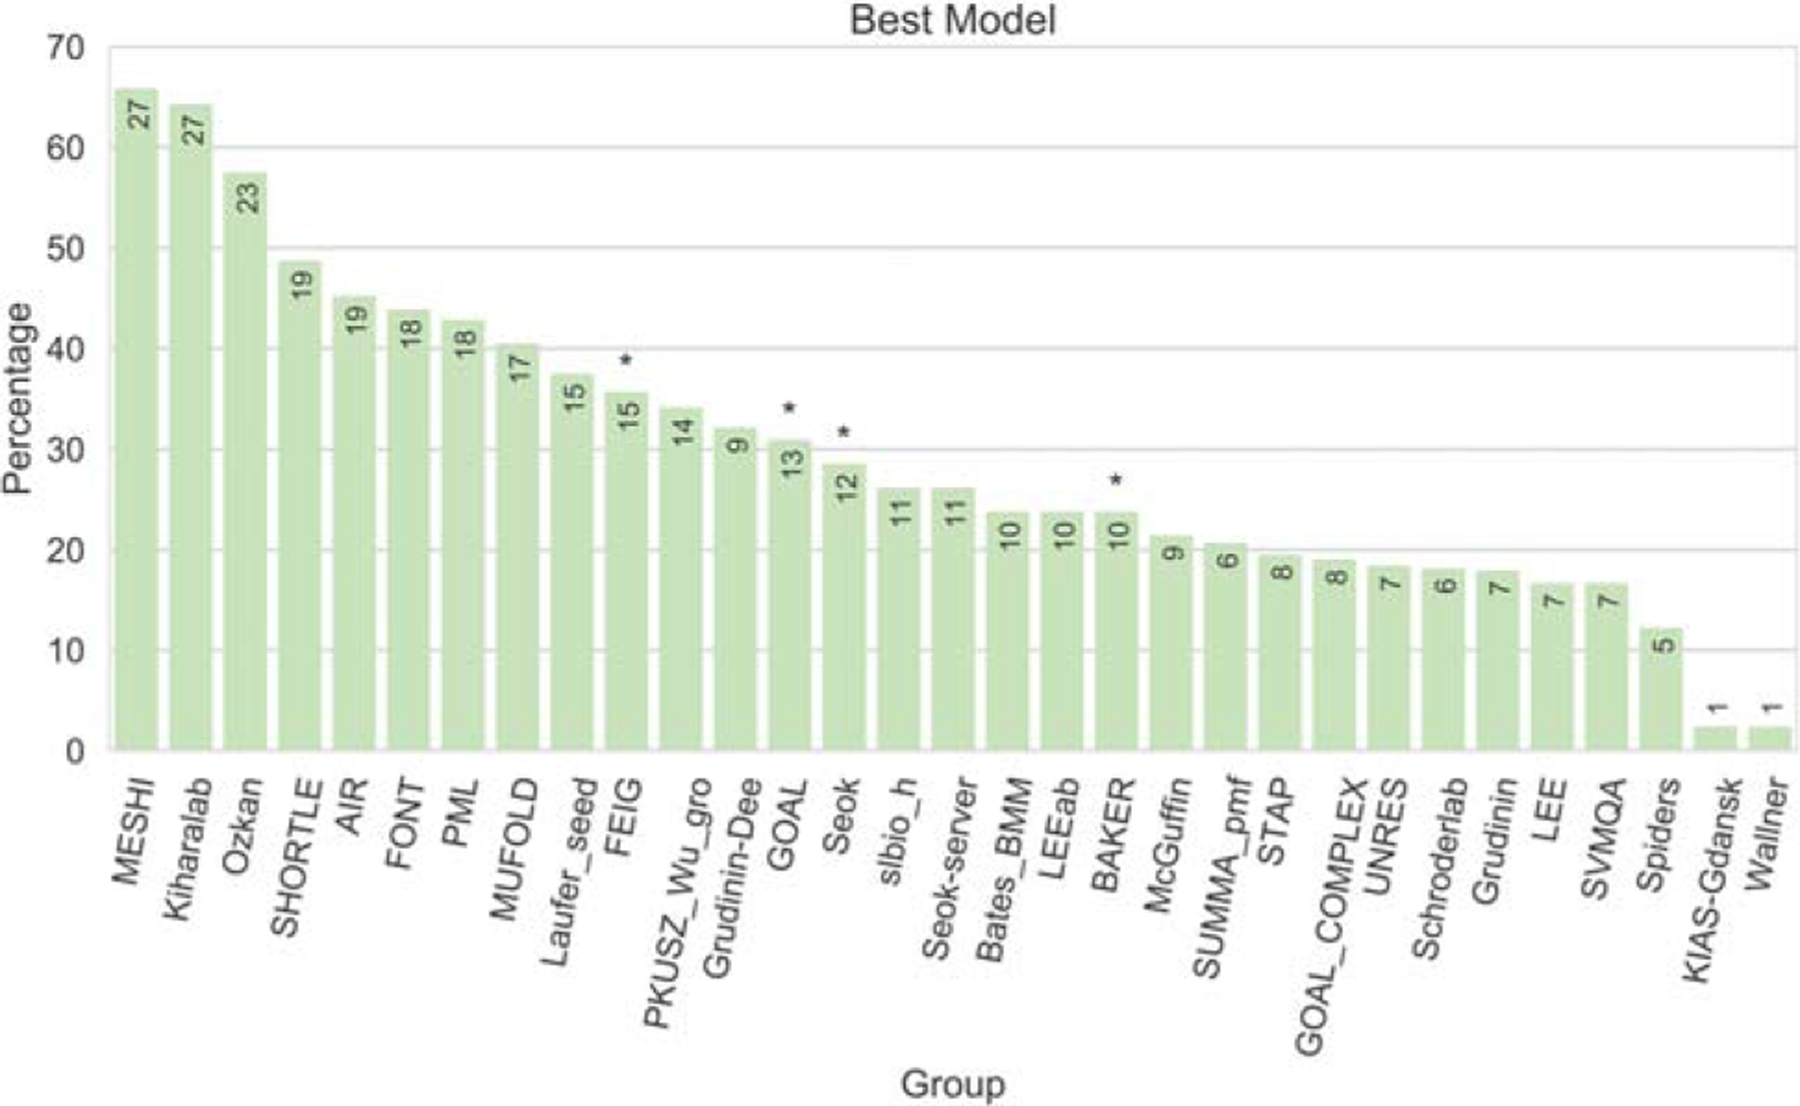
Best model or method selection. The plot reports the percentage of submitted models #1 that correspond to the best of the five submitted models. The numbers on top of the bars report the number of model 1 s corresponding to the best models (not all groups submitted models for all targets). The asterisks mark the CASP12 top performers