
FIGURE 3.
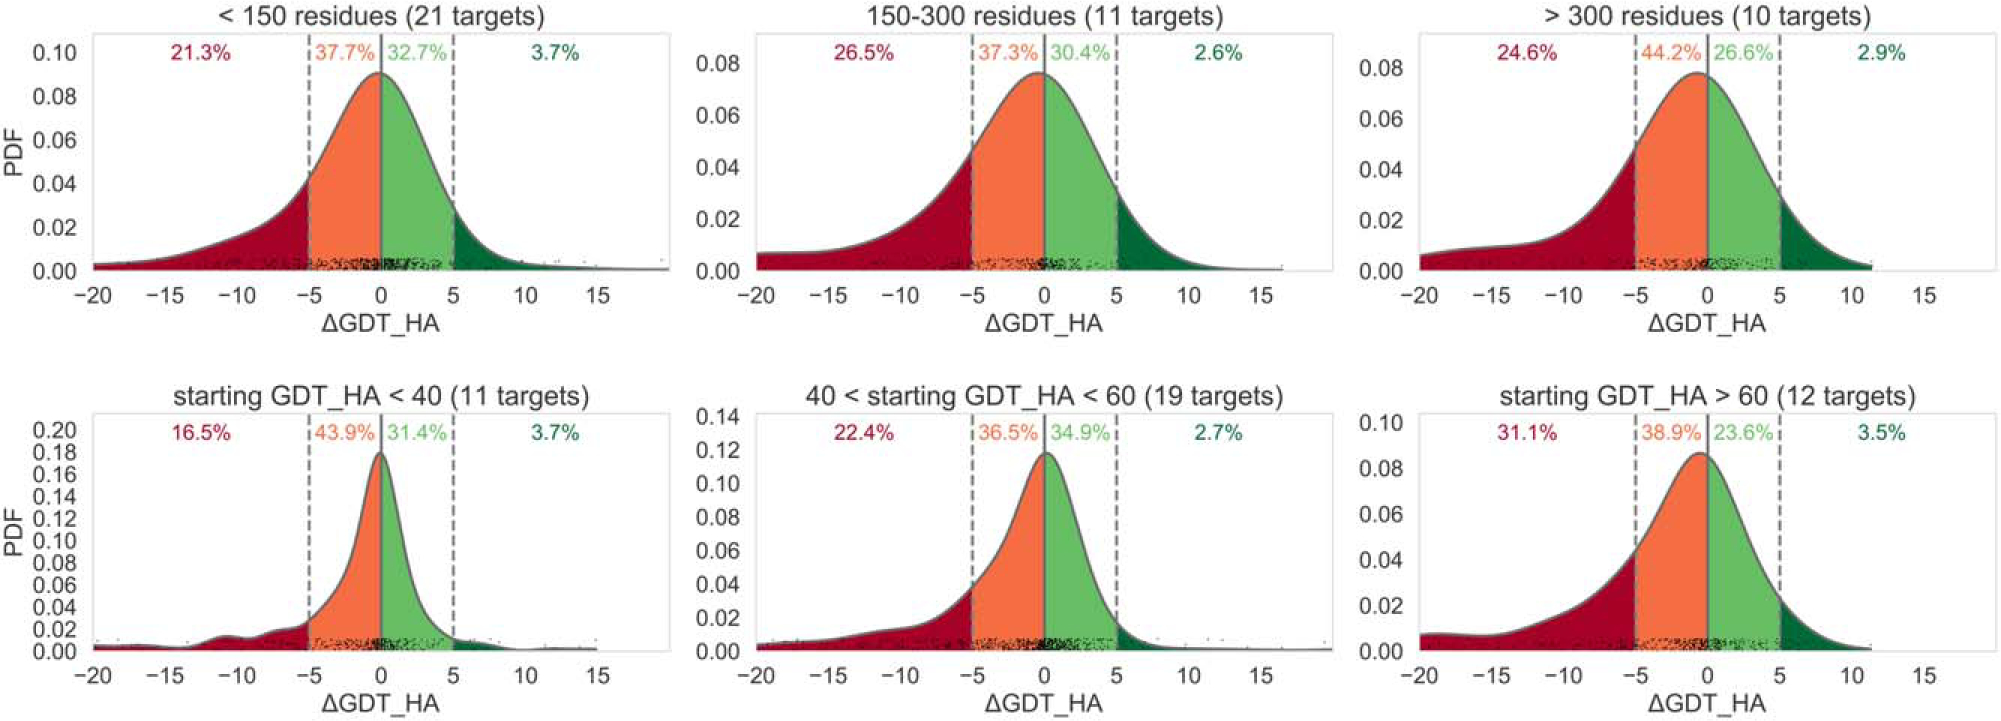
Normalized probability distributions of ΔGDT_HA differences between the refined and starting models for different target lengths (top row of graphs) and different starting GDT_HA (bottom row). Data for first submitted models are presented; y axis shows values of the probability density function (PDF) of the distribution