
FIGURE 4.
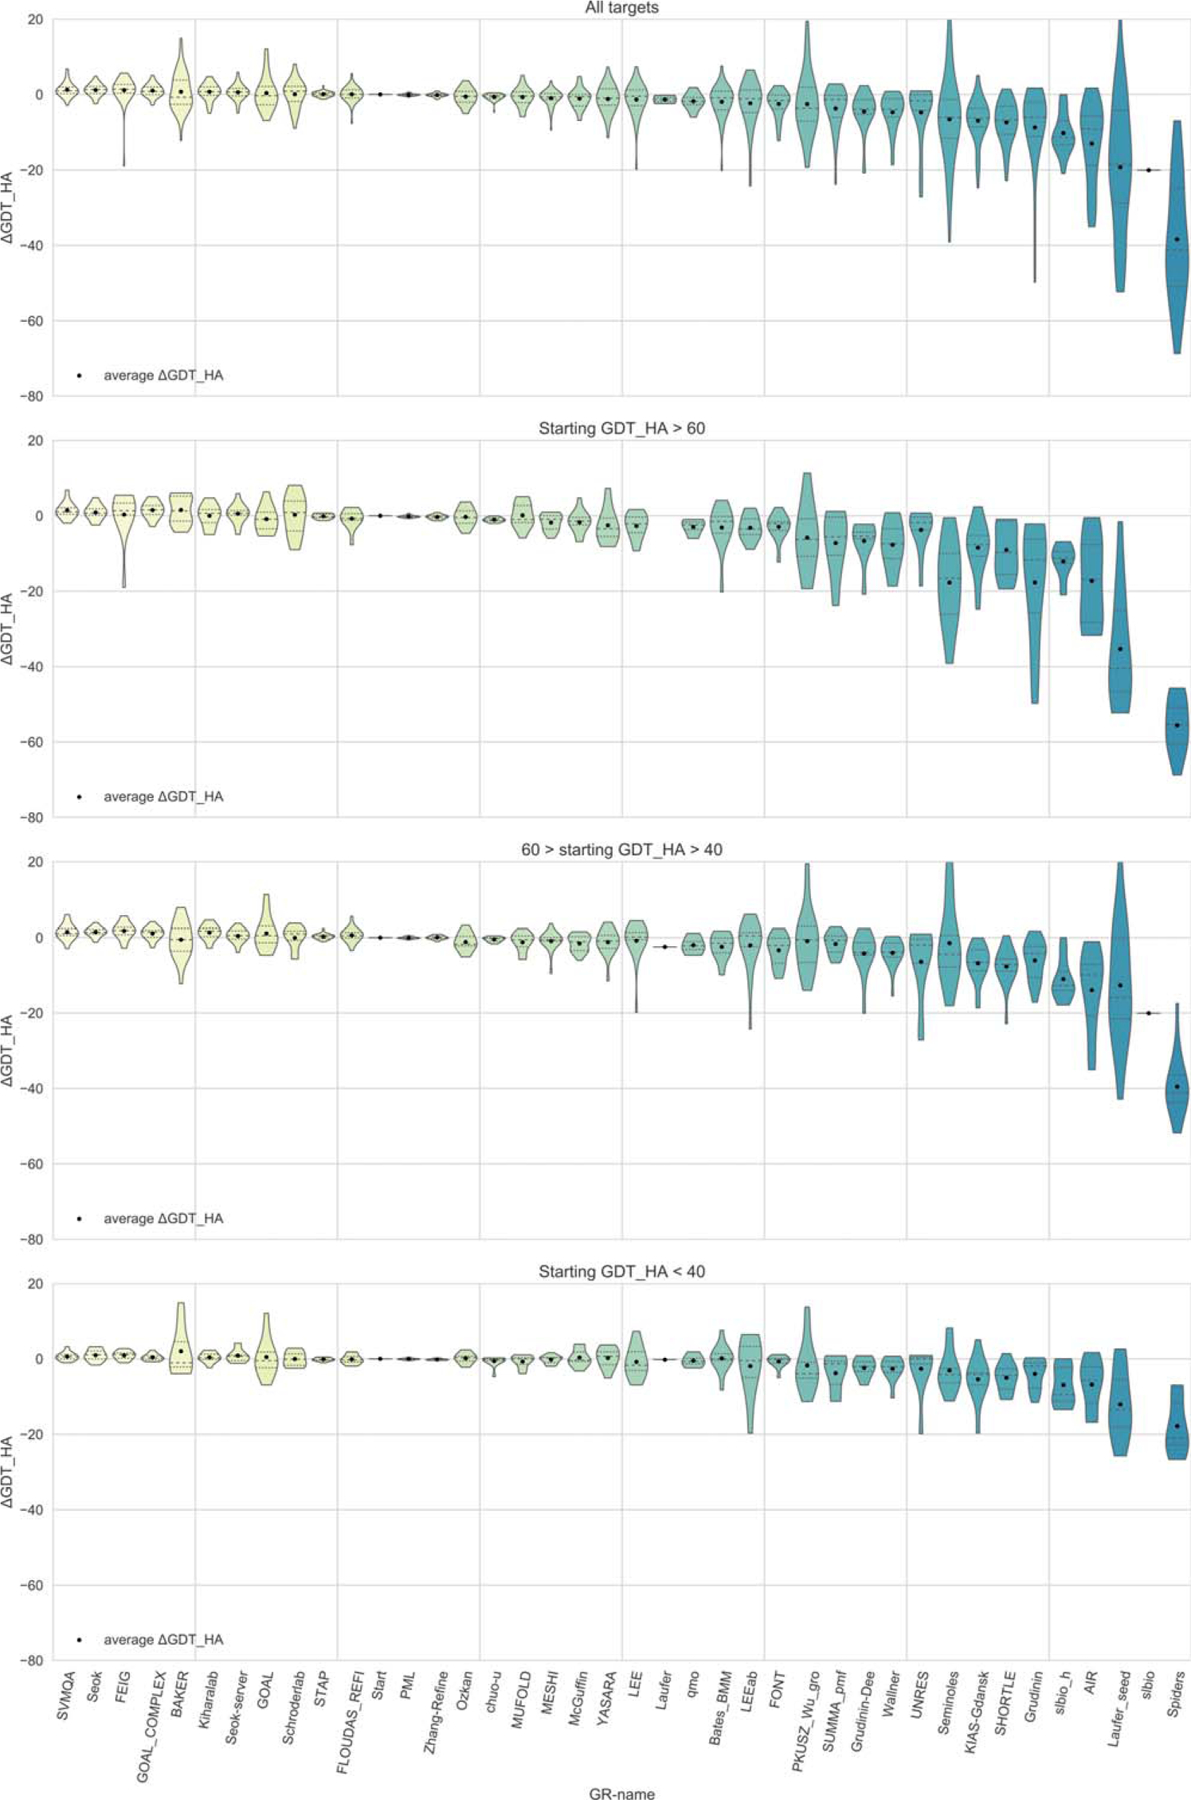
Performance of CASP12 groups as evaluated by the differences in GDT_HA scores between the refined and starting models. The data are shown for all targets (top panel) and for three target subclasses with different GDT_HA scores of starting models (that is, different difficulties of original targets for tertiary structure prediction). Only models ranked as #1 by the predictors are considered. The quartiles are shown as dotted lines in the violin plots. Groups are sorted according to decreasing ΔGDT_HA mean on all targets (top panel)