

Abstract
Background:
This study addressed shortcomings in existing research on pediatric dental care access using rigorous data and methods for identifying statistically significant disparities in dental care access for children.
Methods:
The study population included children, differentiated by insurance status (Medicaid, CHIP, private, or none). Provider-level supply was measured as the number of dental care visits, stratified by provider type and urbanicity/rurality. Demand was defined as the number of dental visits for children. Demand and supply were mainly derived from 2019–2020 data. Using statistical modeling, we evaluated where disparities in travel distance across communities or by insurance status were statistically significant.
Results:
While Dental Health Professional Shortage Areas are primarily rural, our study found that the proportions of suburban/rural and urban communities identified for access interventions ranged from 24% to 66% and 8% to 86%, respectively. For some states (Florida, Louisiana, Texas), rural and suburban communities showed a need for interventions for all children, whereas in the remaining states, the lack of Medicaid/CHIP access mainly contributed to these disparities. Variations in access disparities with respect to insurance status across states or by rurality/urbanicity were extensive, with the rate of communities identified for reducing disparities ranging from 1% to 100%.
Conclusions:
All states showed a need for access interventions and for reducing disparities due to geographic location or insurance status. The sources of disparities were different across states, suggesting different policies and interventions across the 10 states.
Practical Implications:
The study findings support the need for policies towards reducing disparities in dental care access.
Keywords: healthcare access, community dentistry, decision-making, dental public health, pediatric dentistry
Introduction
The Centers for Medicare and Medicaid Services advanced the 2020 Oral Health Initiative to increase the utilization of dental services, citing lack of dental care access as the most frequently reported reason for children not receiving dental care1, 2. Lack of access was found to be associated with poor oral health3, in turn associated with diminished overall health4.
The Health Policy Institute of the American Dental Association (HPI-ADA) was the first to report estimates on geographic proximity to dental care offices for children on public insurance nationwide. Public insurance programs for children in the United States include Medicaid and Children’s Health Insurance Program (CHIP), providing dental and medical insurance for children in low-income families, with Medicaid also covering children with disabilities, or in foster care. Medicaid has higher minimum comprehensive coverage requirements, while states can design CHIP coverage around its minimum coverage requirements and choose to include (or not) benefits covered under Medicaid. There are no premiums for Medicaid by a federal mandate, but states may impose premiums for CHIP. Each state decides whether to manage Medicaid and CHIP separately or together. States may apply differential policies for the two programs, resulting in different participation of the dentists in these programs.
The HPI-ADA study found that the majority of children with public insurance live near a dentist participating in public insurance5, 6. This work also stated that geographic proximity does not necessarily indicate dental care access7. The HPI-ADA approach used limited data on supply and demand of dental care (e.g., not distinguishing by rural and urban communities, or by pediatric, general, and specialized dentists); did not differentiate between public insurance programs; was based on unrealistic assumptions about access barriers (e.g., not accounting for limited caseload dedicated to public-insured children); and used methodology that did not capture system constraints (e.g. Medicaid and CHIP have different participating dentists)8.
To address these limitations, in this study, we developed a rigorous analysis of dental care access for children in ten southeast states. We selected the southeast states because of their low ratio of the number of dentists per-population, ranging between Florida’s rank 38 and Alabama’s rank 489. The states selected also vary in the implementation of state-level health policy. Some of the ten states have recently passed legislation to relax policies on reimbursement and direct access of dental hygienists, for example, in Georgia, Tennessee, and North Carolina. Other states proposed recent legislation facilitating dental care access, for example, through reimbursement of mobile units, direct supervision of dental hygienists, teledentistry, scope of practice of dental therapists, including the 2018–2019 Mississippi House Bill 510, the 2019–2020 Florida House Bill 979, the 2019–2020 South Carolina House Bill 5321, the 2019–2020 Tennessee Senate Bill 609 and the 2019–2020 Texas Senate Bill 79. These legislative initiatives could benefit from a better understanding of a systematic analysis of access to dental care for children.
Methods
Overview
The methods consisted of multiple steps, following an existing access measurement approach10: 1. Establishing the study population, divided by dental insurance status; 2. Estimating demand (number of visits) for dental care within each community; 3. Estimating supply (caseload) for dental care for each dental office; 4. A statistical framework accounting for uncertainties in the supply and demand data; and 5. An access model matching supply and demand subject to a series of constraints.
The access model was an optimization model matching the underlying networks of demand and supply10–14. The access estimates used granular data on dentists’ participation in public insurance programs, caseload by provider type, and practice urbanicity/rurality15 and differentiated the child population by insurance status10. The access model assumed uncertainty in the data inputs, specifically, the demand and supply for dental care, resulting in uncertainty in the access measures10. The estimation of the access measure (one-way travel distance) was accompanied by statistical inference on disparities in access to identify communities for targeting interventions.
Study Population
The study population consisted of children (18 years old and younger) in ten southeast states: Alabama, Arkansas, Florida, Georgia, Louisiana, Mississippi, North Carolina, South Carolina, Tennessee, and Texas, and was provided by the 2019 American Community Survey (ACS). We differentiated the child population into four categories: uninsured and without affordability to pay out-of-pocket expenses for dental care (without financial access); Medicaid-insured; CHIP-insured; or with other affordability, including commercial insurance or out-pocket expenses (defined herein as private financial access or privately insured). Those without financial access were deemed as not having spatial access, referring to accessibility (travel distance within access standards) and availability (caseload dedicated to sub-populations of children) together - hence our further analysis did not include this population.
Dental Care Demand
We assumed a fixed average demand per child equal to 1.5 per-year dental care visits, an average of the number of recommended dental care visits per year across children with low-risk vs high-risk for cavities17. The assumption of 1.5 visits per year on average for providing preventive dental care and cavities treatment is supported by prior research on the dental care utilization of Medicaid-insured children18. We accounted for the demand uncertainty using a sampling distribution for the child population similar to prior research14. Further details are in Web-Appendix A.
Dental Care Supply
To characterize dental practices, specifically, identify the types of dentists at each dental practice, we used data from the 2019–2020 Board of Dentistry (BOD) acquired from each state, and 2020 National Provider Plan and Enumeration System (NPPES). We linked these datasets to the 2020 InsureKidsNow.gov (IKN) data to derive the providers’ participation in Medicaid and CHIP. We further derived the full-time equivalent (FTE) for each unique practice address, where the FTE was derived for each provider type (general, pediatric, and specialized dentist). Specialized dentists (excluding pediatric dentists) were not included in the supply of pediatric dental care because they have a limited caseload dedicated to routine dental care for children15. For providers with multiple practice offices according to the IKN data, we divided the FTE of the dentist into equal proportions across the practice locations.
Dental care supply was defined as the caseload measured by the number of visits dedicated to children, assumed as an FTE percentage19 and differentiated by provider type15. The caseload for Medicaid and CHIP was informed by multiple data sources including the 2012–2013 Medicaid Analytical eXtract claims and 2018 HPI-ADA reports on supply. The practice-level caseload was assumed to be uncertain, derived using a hierarchical Bayesian sampling approach14.
Further details are in Web-Appendix A.
Access Model: Estimation
The access model matched dental care demand and supply to minimize the distance traveled under access constraints using optimization modeling. The access measure was the one-way travel distance to dental care practices averaged at the census tract level and differentiated by financial access. (Census tracts are commonly used as proxies for communities.) The measure was derived as a function of the matching between demand and supply estimated using the optimization model14.
Access Model: Inference
The access model was accompanied by statistical inference accounting for uncertainties in dental care supply and demand The statistical framework utilized Empirical Bayes16 and Markov Chain Monte Carlo14 sampling to obtain instances for the demand and supply, which were further the inputs in the access model. Accounting for uncertainty in demand and supply results in access estimates robust to departures from model assumptions. The final output consisted of an empirical sample of plausible values for the access measures within each community.
The disparity measure was defined as the difference in travel distance between the privately and publicly-insured/CHIP-insured/Medicaid-insured children.
We performed simultaneous statistical inference on the access and disparity measures using 95% simultaneous confidence bands10, 11. Simultaneous confidence bands consisted of confidence intervals for all communities within a region (e.g. state), accounting for the joint inference across all communities within that region. Using the simultaneous confidence bands, we tested the null hypothesis that the access measure was smaller than or equal to the access standards within each census tract, defined as 15 miles for urban, 30 miles for suburban, and 60 miles for rural communities, following the standards for primary care across the ten states. Most states do not have access standards for dental care20. The rurality/urbanicity of each census tract was classified using the Rural-Urban Continuum Codes (RUCCs): urban (RUCCs 1–3), suburban (RUCCs 4–6), and rural (RUCCs 7–9). Census tracts identified having statistically significant larger access measures than the access standards were deemed communities to be targeted for intervention to improve access at the 95% confidence level. The point map indicating the tracts targeted for intervention is called intervention map.
Using the simultaneous confidence bands, we also tested the null hypothesis that the disparity measure was smaller or equal than a disparity threshold value T (e.g., 5 or 10 miles in distance traveled). Census tracts identified having statistically significant larger disparities than the threshold T (rejecting the null hypothesis) were deemed communities to be targeted for reducing insurance-specific disparities in access at the 95% confidence level. The point map indicating the tracts with disparities is called disparity map.
Results
Dental Care Supply and Access
Table 1 provides dentists’ participation in Medicaid-only, CHIP-only, and for public insurance (Medicaid or CHIP) stratified by rurality/urbanicity, provider type and state.
Table 1 –
Participation in Public Insurance Programs: Number & percentage of dentists in each provider category (general, pediatric), by rurality/urbanicity, by Medicaid, CHIP & both (referred as public insurance) computed from dentist FTE. The Medicaid, CHIP & both rates refer to the rate of general/pediatric dentists that accept Medicaid, CHIP, or both for each state. The urbanicity rates examine the rate of general/pediatric dentists in a certain rurality/urbancity that accept public insurance. (Data used are mainly from 2019–2020)
| State | Dentists Type | Total Number | Medicaid Rate | CHIP Rate | Public Insurance Rate | Public Urban Participation | Public Suburban Participation | Public Rural Participation |
|---|---|---|---|---|---|---|---|---|
| AL | General | 1935 | 20.1% | 84.0% | 85.1% | 83.6% | 92.0% | 90.7% |
| Pediatric | 136 | 46.3% | 83.8% | 88.2% | 88.5% | 81.0% | 0.0% | |
| AR | General | 1189 | 47.5% | 47.5% | 47.5% | 42.7% | 61.3% | 56.2% |
| Pediatric | 45 | 88.9% | 88.9% | 88.9% | 87.8% | 83.3% | 100.0% | |
| FL | General | 9703 | 19.4% | 10.8% | 25.8% | 25.7% | 33.0% | 85.8% |
| Pediatric | 435 | 49.2% | 32.0% | 69.2% | 69.1% | 69.4% | 70.0% | |
| GA | General | 5535 | 26.7% | 26.7% | 26.7% | 25.3% | 36.2% | 42.3% |
| Pediatric | 1000 | 21.8% | 21.8% | 21.8% | 21.7% | 28.4% | 0.0% | |
| LA | General | 2149 | 45.7% | 26.3% | 45.7% | 43.9% | 62.6% | 81.3% |
| Pediatric | 98 | 83.7% | 42.9% | 83.7% | 85.2% | 50.0% | 0.0% | |
| MS | General | 1440 | 61.6% | 71.9% | 73.3% | 67.6% | 73.6% | 88.0% |
| Pediatric | 89 | 89.9% | 93.3% | 93.3% | 89.5% | 99.4% | 95.8% | |
| NC | General | 1226 | 83.4% | 34.0% | 85.2% | 82.4% | 95.5% | 99.3% |
| Pediatric | 317 | 93.4% | 56.2% | 99.1% | 98.1% | 100.0% | 100.0% | |
| SC | General | 2283 | 38.5% | 38.5% | 38.5% | 35.0% | 65.3% | 76.3% |
| Pediatric | 74 | 75.3% | 75.3% | 75.3% | 74.1% | 82.4% | 0.0% | |
| TN | General | 2473 | 12.4% | 12.0% | 20.7% | 18.5% | 30.7% | 39.1% |
| Pediatric | 116 | 46.6% | 39.7% | 73.3% | 70.5% | 91.9% | 100.0% | |
| TX | General | 19747 | 43.4% | 50.7% | 59.2% | 24.1% | 30.7% | 20.5% |
| Pediatric | 1395 | 60.1% | 64.2% | 89.6% | 34.4% | 36.1% | 83.1% |
Web-Appendix Tables A1 and A2 provide dentists’ distribution by rurality-urbanicity and dentists’ participation in Medicaid or CHIP by rurality/urbanicity.
For general dentists, Mississippi and North Carolina had higher public insurance participation than other states; Tennessee had the lowest participation. The participation was higher for pediatric dentists in all states, except Georgia.
Florida, Louisiana, North Carolina, and Tennessee had higher Medicaid participation than CHIP. Alabama, Mississippi, and Texas had higher CHIP participation than Medicaid participation. Arkansas, Georgia, and South Carolina manage both programs under a single administrator, hence equal participation for the two programs. Alabama, Louisiana, and North Carolina experienced significant differences between the two public insurance programs. Florida, Georgia, and Tennessee had low dentists’ participation in both insurance programs.
Dentists’ participation in rural communities were lower than in urban communities in most states. Alabama, Louisiana, South Carolina, and Tennessee had no participating pediatric dentists in rural communities. Pediatric dentists in urban and suburban communities generally had higher participation than general dentists.
Web-Appendix Table A3 shows the median access distance by type of insurance and urbanicity level for each state. Travel distance for children with private financial access was much lower than for those with public insurance across all states. Differences between CHIP and Medicaid access were also identified however they were not consistent across states. For states such as Alabama and Mississippi, CHIP had lower travel distances than Medicaid. For other states, the Medicaid and CHIP distances were somewhat similar.
Targeting Areas for Improvement
Figures 1a and 1b display the intervention maps for the privately-insured and publicly-insured children. Web-Appendix Figures A4 to A6 display the intervention maps for the overall population, Medicaid-insured, and CHIP-insured children. Table 2 presents the number and percentage of communities targeted for access improvement by urbanicity/rurality and state, identified using the statistical inference procedure at the 95% confidence level.
Figure 1:
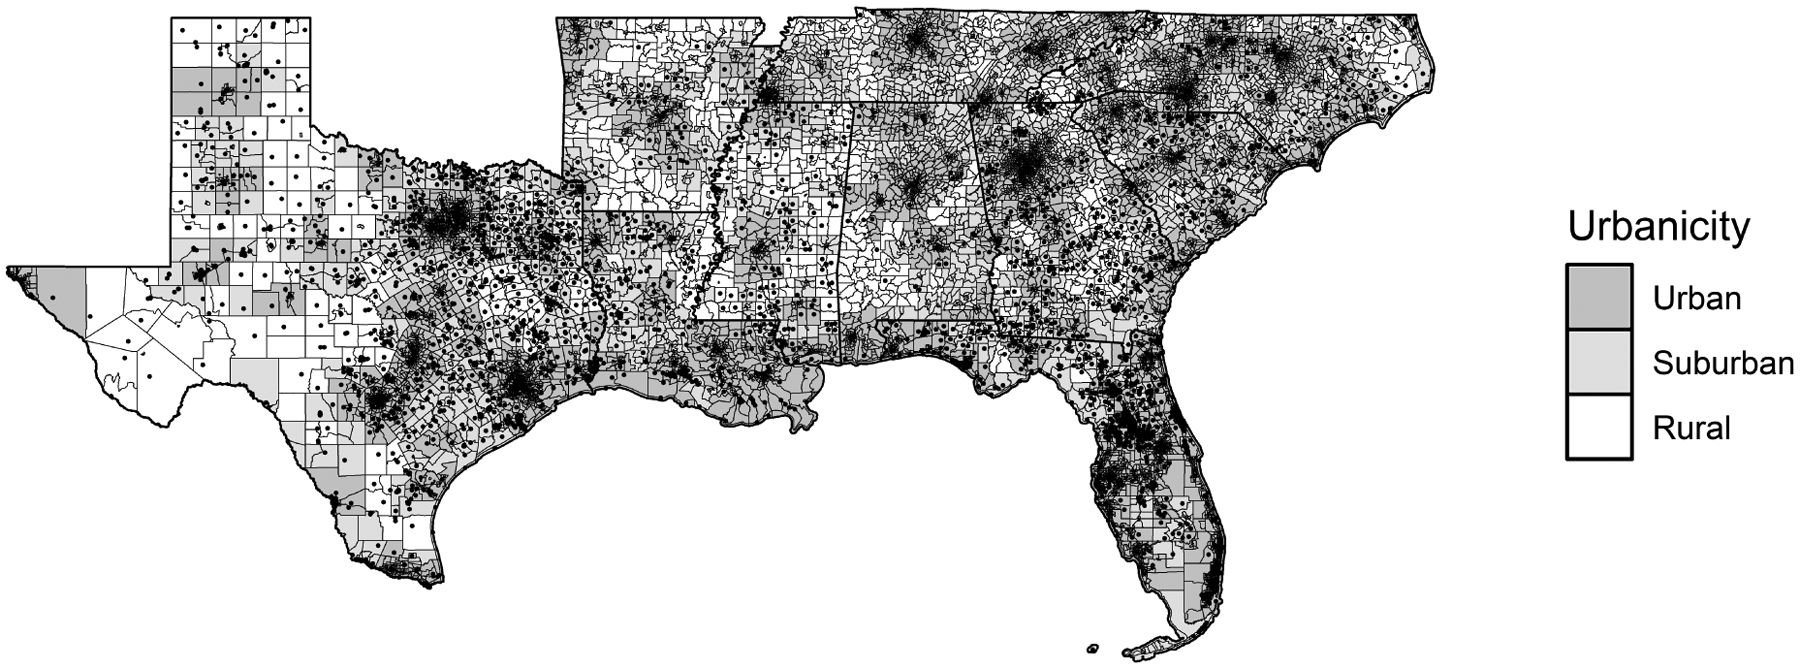
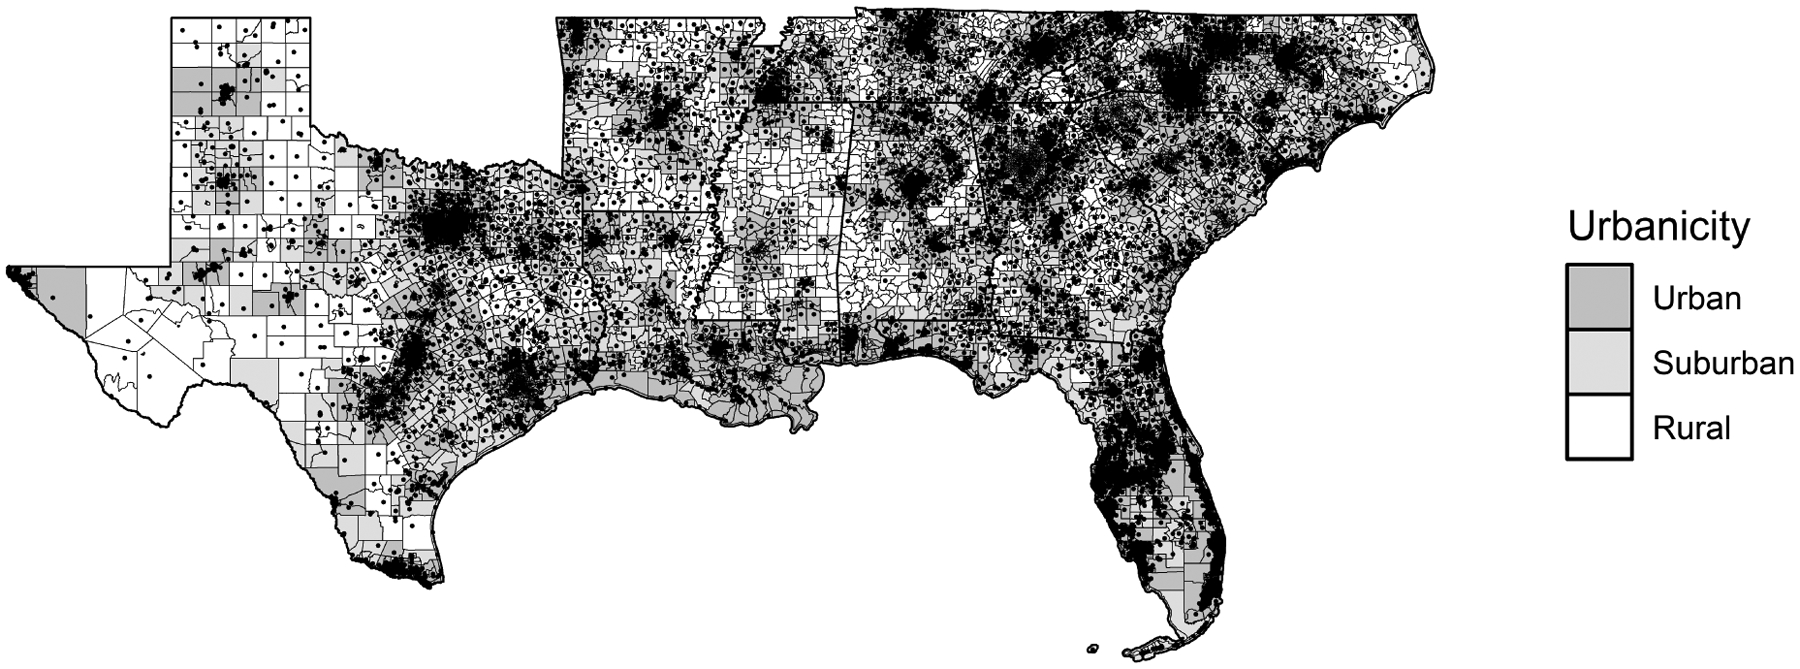
Intervention maps showing the census tracts (designated by points in the map) with a statistically significant travel distance smaller than T=15 miles for urban tracts, T=30 miles for suburban tracts and T=60 for rural tracts for the privately-insured (Figure 1a) and publicly-insured (Medicaid or CHIP) children (Figure 1b), respectively. The census tracts shown as points in the map are recommended for intervention to improve access. (Data used is mainly from 2019–2020)
Table 2:
The number and proportion of communities targeted for access improvement by urbanicity/rurality and by state, derived using the statistical inference procedure at the 95% confidence level. The rate of tracts targeted for access improvement by urbancity/rurality refers to the ratio of tracts targeted for improvement (by insurance type in a specific urbanicity/rurality) to total tracts (by insurance type in a specific urbanicity/rurality). (Data used are mainly from 2019–2020)
| State | Type of Insurance | Number Urban Tracts Targeted for Improvement | Rate Urban Tracts Targeted for Improvement | Number Suburban Tracts Targeted for Improvement | Rate Suburban Tracts Targeted for Improvement | Number Rural Tracts Targeted for Improvement | Rate Rural Tracts Targeted for Improvement |
|---|---|---|---|---|---|---|---|
| AL | Medicaid | 808 | 93.8% | 178 | 73.6% | 58 | 74.4% |
| CHIP | 20 | 2.3% | 4 | 1.7% | 0 | 0.0% | |
| Public | 664 | 77.1% | 94 | 38.8% | 8 | 10.3% | |
| Private | 20 | 2.3% | 3 | 1.2% | 4 | 5.1% | |
| AR | Medicaid | 396 | 100.0% | 150 | 100.0% | 101 | 72.1% |
| CHIP | 395 | 99.7% | 125 | 83.3% | 46 | 32.9% | |
| Public | 396 | 100.0% | 150 | 100.0% | 83 | 59.3% | |
| Private | 34 | 8.6% | 27 | 18.0% | 0 | 0.0% | |
| FL | Medicaid | 2137 | 52.5% | 161 | 94.7% | 3 | 75.0% |
| CHIP | 2868 | 70.5% | 165 | 97.1% | 4 | 100.0% | |
| Public | 2527 | 62.1% | 165 | 97.1% | 3 | 75.0% | |
| Private | 510 | 12.5% | 112 | 65.9% | 3 | 75.0% | |
| GA | Medicaid | 513 | 33.1% | 218 | 75.4% | 85 | 66.4% |
| CHIP | 569 | 36.7% | 240 | 83.0% | 95 | 74.2% | |
| Public | 563 | 36.3% | 232 | 80.3% | 84 | 65.6% | |
| Private | 120 | 7.7% | 95 | 32.9% | 53 | 41.4% | |
| LA | Medicaid | 279 | 29.2% | 89 | 55.6% | 12 | 36.4% |
| CHIP | 338 | 35.4% | 127 | 79.4% | 18 | 54.5% | |
| Public | 362 | 37.9% | 104 | 65.0% | 12 | 36.4% | |
| Private | 114 | 11.9% | 85 | 53.1% | 12 | 36.4% | |
| MS | Medicaid | 47 | 16.3% | 84 | 39.4% | 56 | 34.6% |
| CHIP | 35 | 12.1% | 96 | 45.1% | 0 | 0.0% | |
| Public | 52 | 18.0% | 94 | 44.1% | 0 | 0.0% | |
| Private | 31 | 10.7% | 50 | 23.5% | 45 | 27.8% | |
| NC | Medicaid | 909 | 54.6% | 142 | 32.5% | 28 | 30.1% |
| CHIP | 1372 | 82.4% | 191 | 43.7% | 43 | 46.2% | |
| Public | 1218 | 73.2% | 192 | 43.9% | 31 | 33.3% | |
| Private | 80 | 4.8% | 37 | 8.5% | 24 | 25.8% | |
| SC | Medicaid | 360 | 39.1% | 89 | 50.6% | 0 | 0.0% |
| CHIP | 363 | 39.5% | 97 | 55.1% | 0 | 0.0% | |
| Public | 412 | 44.8% | 103 | 58.5% | 0 | 0.0% | |
| Private | 79 | 8.6% | 47 | 26.7% | 1 | 14.3% | |
| TN | Medicaid | 1003 | 88.4% | 122 | 45.7% | 39 | 41.1% |
| CHIP | 1033 | 91.0% | 142 | 53.2% | 30 | 31.6% | |
| Public | 1080 | 95.2% | 164 | 61.4% | 28 | 29.5% | |
| Private | 17 | 1.5% | 4 | 1.5% | 2 | 2.1% | |
| TX | Medicaid | 3079 | 68.3% | 495 | 91.2% | 191 | 90.1% |
| CHIP | 1360 | 30.2% | 503 | 92.6% | 193 | 91.0% | |
| Public | 2412 | 53.5% | 499 | 91.9% | 190 | 89.6% | |
| Private | 553 | 12.3% | 467 | 86.0% | 182 | 85.8% |
A small percentage of urban communities were identified to be targeted for intervention to address access for privately-insured children, ranging from 1.5% (Tennessee) to 12.5% (Florida). For some states (Florida, Louisiana, and Texas), there was a large percentage of suburban and rural communities identified for intervention for privately-insured children. The percentages for suburban and rural communities varied from 23.5% (Mississippi) to 65.9% (Florida) and in urban communities varied from 1.2% (Alabama) to 12.5% (Florida).
Many more communities in urban areas were identified for intervention for publicly-insured than privately-insured children. States with high percentage of communities needing improvement for publicly-insured children were Tennessee (95.2%), Alabama (77.1%), Arkansas (100.0%), and North Carolina (73.2%). Comparing access for Medicaid vs CHIP insured, states differed greatly. CHIP-insured children had similar access as those privately insured in Alabama but being inadequate for Medicaid insured (93.8% in urban and 73.6% in rural-suburban communities). Overall, rural and suburban communities had lower access than urban communities, with a larger percentage of communities identified for intervention in Florida, Georgia, Louisiana, Mississippi, Tennessee, and Texas. For those states, the percentage rural and suburban communities in need for intervention to address access for publicly-insured children ranged between 44.1% (Mississippi) and 97.1% (Florida), while the urban rates ranged between 18% (Mississippi) and 62.1% (Florida).
Disparities in Access to Dental Care
Figures 2a and 2b compare access disparities between children with private financial access versus CHIP-insured and Medicaid-insured children, respectively, using the threshold difference of 10 miles or more, selected to demonstrate the extensive disparities. Table 3 presents the number and percentage of communities targeted for reducing disparities identified using the statistical inference procedure at the 95% confidence level. Web-Appendix Figure A8 provides the disparity maps for the 5-mile threshold.
Figure 2:
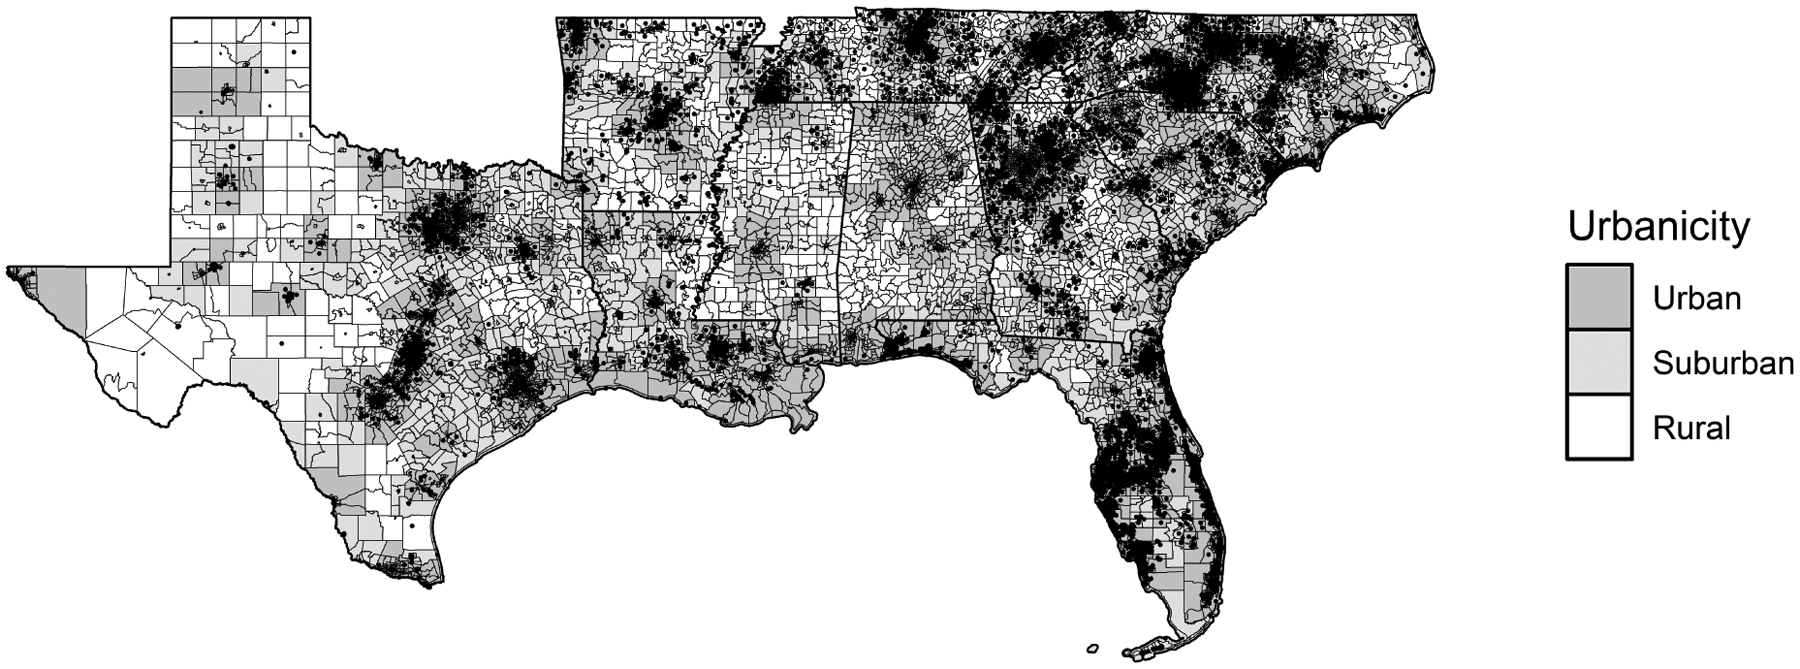

Disparity maps showing the census tracts (designated by points in the map) with statistically significant differences of 10 miles or more when comparing access of children with private insurance versus children insured through CHIP (Figure 2a) or Medicaid (Figure 2b). The census tracts shown as points in the map are recommended for intervention to reduce disparities. (Data used is mainly from 2019–2020)
Table 3 –
the number and proportion of communities targeted for reducing disparities by urbanicity/rurality and by state, derived using the statistical inference procedure at the 95% confidence level. The rate of tracts targeted for reducing disparities by urbancity/rurality refers to the ratio of tracts targeted for reducing disparities (by insurance type in a specific urbanicity/rurality) to total tracts (by insurance type in a specific urbanicity/rurality). (Data used are mainly from 2019–2020.
| State | Type of Insurance | Number Urban Tracts Disparity | Rate Urban Tracts Disparity | Number Suburban Tracts Disparity | Rate Suburban Tracts Disparity | Number Rural Tracts Disparity | Rate Rural Tracts Disparity |
|---|---|---|---|---|---|---|---|
| AL | Medicaid | 808 | 93.8% | 178 | 73.6% | 58 | 74.4% |
| CHIP | 20 | 2.3% | 4 | 1.7% | 0 | 0.0% | |
| Public | 664 | 77.1% | 94 | 38.8% | 8 | 10.3% | |
| AR | Medicaid | 396 | 100.0% | 150 | 100.0% | 101 | 72.1% |
| CHIP | 395 | 99.7% | 125 | 83.3% | 46 | 32.9% | |
| Public | 396 | 100.0% | 150 | 100.0% | 83 | 59.3% | |
| FL | Medicaid | 2137 | 52.5% | 161 | 94.7% | 3 | 75.0% |
| CHIP | 2868 | 70.5% | 165 | 97.1% | 4 | 100.0% | |
| Public | 2543 | 62.5% | 78 | 45.9% | 1 | 25.0% | |
| GA | Medicaid | 501 | 32.3% | 158 | 54.7% | 36 | 28.1% |
| CHIP | 567 | 36.5% | 181 | 62.6% | 40 | 31.3% | |
| Public | 570 | 36.7% | 174 | 60.2% | 37 | 28.9% | |
| LA | Medicaid | 204 | 21.4% | 56 | 35.0% | 11 | 33.3% |
| CHIP | 298 | 31.2% | 70 | 43.8% | 16 | 48.5% | |
| Public | 325 | 34.0% | 66 | 41.3% | 14 | 42.4% | |
| MS | Medicaid | 16 | 5.5% | 59 | 27.7% | 26 | 16.0% |
| CHIP | 4 | 1.4% | 18 | 8.5% | 5 | 3.1% | |
| Public | 12 | 4.2% | 61 | 28.6% | 30 | 18.5% | |
| NC | Medicaid | 902 | 54.2% | 191 | 43.7% | 37 | 39.8% |
| CHIP | 1375 | 82.6% | 242 | 55.4% | 30 | 32.3% | |
| Public | 1346 | 80.8% | 272 | 62.2% | 39 | 41.9% | |
| SC | Medicaid | 316 | 34.3% | 100 | 56.8% | 3 | 42.9% |
| CHIP | 361 | 39.2% | 89 | 50.6% | 5 | 71.4% | |
| Public | 382 | 41.5% | 106 | 60.2% | 3 | 42.9% | |
| TN | Medicaid | 1025 | 90.3% | 157 | 58.8% | 56 | 58.9% |
| CHIP | 1055 | 93.0% | 177 | 66.3% | 46 | 48.4% | |
| Public | 1095 | 96.5% | 212 | 79.4% | 70 | 73.7% | |
| TX | Medicaid | 2892 | 64.1% | 67 | 12.3% | 15 | 7.1% |
| CHIP | 966 | 21.4% | 46 | 8.5% | 8 | 3.8% | |
| Public | 2615 | 58.0% | 66 | 12.2% | 17 | 8.0% |
For most states, the percentage of suburban communities in need to reduce disparities was higher than for urban or rural communities except for Alabama, Tennessee, and Texas, where the urban communities had significantly higher disparities. In Texas, the percentages were 64.1% for urban, 12.3% for suburban and 7.1% for rural communities.
Across most states (except Alabama and Texas), access for Medicaid insured showed less disparity with respect to privately insured than for CHIP insured. In Georgia, the CHIP and Medicaid percentages of urban communities targeted for reducing disparities were 32.3% and 36.5%, and in Florida, were 52.5% and 70.5%, respectively. In Texas, the percentages of urban communities targeted for reducing disparities for Medicaid were around three times those for CHIP. In Alabama, the percentages were 93.8% for Medicaid and 2.3% for CHIP. Few states showed low disparities for both Medicaid and CHIP at the 10+ miles threshold, with Mississippi and South Carolina having the lowest percentages of communities for reducing disparities, followed by Texas (except for Medicaid in urban areas) and Louisiana. The percentages in Mississippi were 5.5% for Medicaid and 1.4% for CHIP. Other states had large disparities for both Medicaid and CHIP insured (Arkansas overall communities, Florida urban and suburban, Georgia suburban, North Carolina urban and suburban, Tennessee all communities). The percentage of urban communities in need for reducing disparities in Arkansas was 100%.
Discussion
This study contributes to promoting oral health policy by addressing specific relevant questions:
Which communities and/or sub-populations need to be targeted for intervention to improve access?
Are there systematic disparities in access to dental care within and between states?
Would statewide or community-level interventions be effective to address disparities in access?
This study found that all 10 southeast states showed a need for interventions to improve access to dental care for children, demonstrating that while a child may live within proximity to dentists, it does not translate to access to dental care. Moreover, access disparities between children with private access versus public insurance were present in all states, varying by rurality/urbanicity and being different for the two public insurance programs, Medicaid and CHIP. This is the first study to identify the need for intervention to improve dental care access for children across multiple states.
The reported 2014 participation percentages in public insurance (Medicaid and CHIP together) provided by HPI-ADA for the 10 states were: Alabama 74%, Arkansas 61%, Florida 30%, Georgia 28%, Louisiana 43%, Mississippi 55%, North Carolina 27%, South Carolina 48%, Tennessee 35%, and Texas 48%21. However, in many states, the Medicaid and CHIP programs are managed separately, hence the network of dentists participating in the two programs could be widely different. While Alabama had a large participation percentage reported by HPI-ADA, it instead had a large difference between the participation in Medicaid versus CHIP program, with the Medicaid participation percentage being one- fourth of the CHIP percentage for general dentists. Such differences could substantively change the access estimates for children insured in the two programs as identified in this study.
It is also important to assess participation in public insurance programs by provider type and rurality/urbanicity15. Georgia was the only state with a larger participation of general dentists than pediatric dentists. In Arkansas, the percentages were 48% and 89% for general and pediatric dentists, respectively. There was a consistent trend in increasing participation from urban to suburban to rural communities. Thus, for targeting oral health policy, it is important to evaluate participation in public insurance more granularly than reporting them at the state level alone.
The HPI-ADA state access reports for the 10 southeast states found that eight of the southeast states had more than 90% of the children with public insurance within 15 minutes of a participating dentist, with Mississippi having 79% and Arkansas having 89% children with this level of access. In contrast, our study showed that the percentage of communities in need of interventions to improve access for children with Medicaid was 100% for Arkansas in urban/suburban communities, and 72% in rural communities, with CHIP-insured children having only slightly better access, for example. The only state that showed a relatively low need for intervention was Mississippi. . These differences in the results were because the extent of the data used (e.g., differentiate between dentists’ taxonomy, consider caseload dedicated to public insurance), and the modeling rigor (e.g., include constraints on the limited provider-level caseload) as well as the methodology employed to account for granular uncertain data.
While 60% of Dental Health Professional Shortage Areas have been identified to be rural22 when studying access more granularly, at the community level, we found that rural, suburban, and urban communities were in need of intervention to reduce disparities in access. When evaluating access to dental care for children with private financial access, those in urban communities had little need for interventions, while for some states (Florida, Louisiana, and Texas), rural and suburban communities showed a need for interventions for all children, suggesting policies targeting such communities. There were wide disparities in the level of intervention needed for children with public insurance versus those privately insured, particularly prevalent in urban areas.
Communities identified for reducing disparities in access between CHIP or Medicaid and privately insured were many across all states even at the difference in travel distance of 10+ miles, with CHIP showing higher levels of disparities than Medicaid. Disparities in access between the publicly and privately-insured children were also most acute in Alabama Medicaid, Arkansas, and Tennessee, and least acute in Mississippi and South Carolina. Texas had low disparities between publicly insured and privately insured in suburban and rural communities, having similarly high unmet needs. These variations in disparities across the ten states suggest the implementation of state-level policies as well as local interventions, which can target the communities in need of access improvement.
This study only focused on measures and analysis of access to dental care for children with financial access. Policies and interventions for improving access for this population are different from those for improving access for children with financial access.
Limitations
Limitations of this study centered on the availability of detailed data - which was limited particularly for specifying the dental care supply. The Board of Dentistry (BOD) data provided limited information, particularly with respect to provider type and multiple practice locations. For participating dentists in public insurance programs, the IKN data complemented the BOD data, providing detailed information about dental care providers participating in public insurance, including the office addresses and their specialty. For the non-participating dentists in public insurance, the National Plan and Provider Enumeration System (NPPES) data complemented the BOD data to specify the provider type but not all active dentists in the BOD data were matched with dentists in the NPPES data thus we had to impute the missing information using sampling techniques similar to prior research14. Moreover, for those dentists, we did not have detailed information on the multiple practice locations. Furthermore, we assumed that the caseload for CHIP was similar to that for Medicaid-insured children. The impact of these uncertainties in the measurement of disparities was more often seen outside of urban census tracts, where the (non-)availability of a single provider to the publicly insured population could play a major role in access.
Conclusions
There were several important findings with implications in policy making:
CHIP and Medicaid programs are managed differently by some states, hence separating the access inferences more accurately informs decision making for the two programs. Policies for eliminating multiple dental management organizations and for having a single benefits administrator for CHIP and Medicaid programs will reduce disparities in dental access23, 24.
All states shared one common trend – the need for intervention to improve access for all children, although to a larger extent for CHIP and Medicaid-insured children. There were varying levels of intervention by rurality/urbanicity and state. Many states showed a need for intervention for all children in rural and suburban communities (e.g. Florida, Georgia, Louisiana, and Texas). Identifying communities for intervention to improve access can help decision makers target resources
Disparities in access between children with private access versus those with public insurance were extensive and present in most states for one or both programs, even at a disparity threshold of 10+ miles. Given the extent of those disparities, state-level policies are needed to reduce these disparities in most states28.
Based on these findings, states should employ statewide policies as well as local interventions depending on the need for access improvement. Statewide interventions include promoting teledentistry and relaxing the scope of practice for dental therapists29, 30. Local interventions include the allocation of resources for mobile units and school programs25–27.
Supplementary Material
Acknowledgements
This research was supported by the Award R01DE028283 from the National Institute of Dental and Craniofacial Research, National Institutes of Health. The content is solely the responsibility of the authors and does not necessarily represent the official views of the National Institutes of Health. The funding agreements ensured the authors’ independence in designing the study, interpreting the data, writing, and publishing the report. The authors thank Richard Starr for assistance with data safeguards and access and the information technology infrastructure and undergraduate students, Grace Oberst, Christopher Larkins, and Tina Lu, for the support with the data processing for matching the three datasets providing information on the dental care providers.
Funding
The authors have no financial relationships relevant to this article to disclose.
Footnotes
Publisher's Disclaimer: This is a PDF file of an unedited manuscript that has been accepted for publication. As a service to our customers we are providing this early version of the manuscript. The manuscript will undergo copyediting, typesetting, and review of the resulting proof before it is published in its final form. Please note that during the production process errors may be discovered which could affect the content, and all legal disclaimers that apply to the journal pertain.
Declaration of Conflicting Interests
The authors have no conflicts of interest to disclose.
REFERENCES
- 1.US Government Accountability Office. Efforts under way to improve children’s access to dental services, but sustained attention needed to address ongoing concerns. United States Government Accountability Office; Washington, DC: 2010. [Google Scholar]
- 2.Department of Health and Human Services. Healthy People 2020. Office of Disease Prevention and Health Promotion 2011.
- 3.Nguyen T. Risk Factors for Treatment of Gum Disease Among Asian and Hispanic Adult Groups. 2018.
- 4.Institute of Medicine. Advancing Oral Health in America. The National Academies Press. 2011. [Google Scholar]
- 5.A New Way of Measuring Geographic Access to Dental Care Services. Webinar 2017. [Google Scholar]
- 6.Geographic access to dental care. Geographic Access to Dental Care – Health Policy Institute Fact Sheets. Available: https://www.ada.org/en/science-research/health-policy-institute/geographic-accesshttps://www.ada.org/en/science-research/health-policy-institute/geographic-access-to-dental-careto-dental-care. Accessed September 2, 2021.
- 7.Vujicic M. A new way to measure geographic access to dentists in north carolina. North Carolina Medical Journal. 2017;78(6):391–392. [DOI] [PubMed] [Google Scholar]
- 8.Serban N, Tomar SL. ADA Health Policy Institute’s methodology overestimates spatial access to dental care for publicly insured children. Journal of public health dentistry. 2018;78(4):291–295. [DOI] [PubMed] [Google Scholar]
- 9.HHS Centers for Medicare & Medicaid Services, National Plan and Provider Enumeration System. America’s Health Rankings analysis of U.S Available: https://www.americashealthrankings.org/explore/annual/measure/dental_provider/state/ALL. Accessed February 4, 2021.
- 10.Cao S, Gentili M, Griffin PM, Griffin SO, Serban N. Disparities in preventive dental care a mong children in Georgia. Preventing Chronic Disease. 2017;14:E104–E104. [DOI] [PMC free article] [PubMed] [Google Scholar]
- 11.Gentili M, Harati P, Serban N. Projecting the impact of the affordable care act provisions on accessibility and a vailability of primary care providers for the a dult population in Georgia. American Journal of Public Health. 2016;106(8):1470–1476. [DOI] [PMC free article] [PubMed] [Google Scholar]
- 12.Nobles M, Serban N, Swann J. Spatial a ccessibility of pediatric primary healthcare: measurement and inference. The Annals of Applied Statistics. 2014;8(4):1922–1946. [Google Scholar]
- 13.Serban N. Healthcare System Access: Measurement, Inference and Intervention. Hoboken, NJ: Wiley; 2020. [Google Scholar]
- 14.Curry S, Serban N. Decision making for improving access to dental care under uncertainty. Health Services Research. 2021;56(2)::214–224. [DOI] [PMC free article] [PubMed] [Google Scholar]
- 15.Serban N, Bush C, Tomar SL. Medicaid caseload for pediatric oral health care. The Journal of the American Dental Association. 2019;150(4):294–304. [DOI] [PMC free article] [PubMed] [Google Scholar]
- 16.Casella G. 1985. An introduction to empirical bayes data analysis. The American Statistician. 1985;39(2):83–87. [Google Scholar]
- 17.American Academy of Pediatric Dentistry. Periodicity of examination, preventive dental services, a nticipatory guidance/c ounseling, and oral treatment for infants, children, and a dolescents. The Reference Manual of Pediatric Dentistry. Chicago Il. American Academy of Dentistry. 2020. 232–242. [Google Scholar]
- 18.Lee I, Monahan S, Serban N, Griffin PM, Tomar SL. Estimating the cost savings of preventive dental services delivered to Medicaid-e nrolled children in six southeastern states. Health S ervices R esearch. 2018;53(5):3592–3616. [DOI] [PMC free article] [PubMed] [Google Scholar]
- 19.Cao S, Gentili M, Griffin P, et al. Estimating demand for and supply of pediatric preventive dental care for children and identifying dental care shortage areas, Georgia. Public Health Reports. 2017;132(3):343–349. [DOI] [PMC free article] [PubMed] [Google Scholar]
- 20.National Association of Dental Plans. Provider Networks and Accessibility Requirements by State Available: https://www.nadp.org/docs/default-source/gr-documents/provider-networks-andhttps://www.nadp.org/docs/default-source/gr-documents/provider-networks-and-accessibility-requirements-by-state-.pdf?sfvrsn=0accessibility-requirements-by-state-.pdf?sfvrsn=0. Accessed October 2nd, 2020.
- 21.Health Policy Institute. The oral health care system: a state by state a nalysis. American Dental Association, 2016. [Google Scholar]
- 22.Bureau of Health Workforce Health Resources and Services Administration. Available: https://data.hrsa.gov. Accessed July 26, 2021.
- 23.American Dental Association. Too many low-income adults and children are unable to access dental care through the Medicaid and Children’s Health Insurance Programs (CHIP) Available: https://www.ada.org/~/media/ADA/Advocacy/Files/Medicaid-CHIP_Issues_Flyer.pdf?la=en. Accessed July 26, 2021.
- 24.Borck R, Vine M, Crall J, Norris L, Rosenbach M. Improving oral health care delivery in Medicaid and CHIP: a toolkit for states. Mathematica Policy Research, National Committee for Quality Assurance, Center for Health Care Strategies, and National Initiative for Children’s Healthcare Quality. https://www.medicaiddental.org/files/Other%20Files/Oral_Health_QI_Toolkit.pdf. Accessed July 26, 2021.
- 25.Pathman DE, Taylor DH Jr, Konrad TR, et al. State scholarship, loan forgiveness, and related programs: the unheralded safety net. JAMA. 2000;284(16):2084–2092. doi: 10.1001/jama.284.16.2084 [DOI] [PubMed] [Google Scholar]
- 26.Nicholson S, Vujicic M, Wanchek T, Ziebert A, Menezes A. The effect of education debt on dentists’ career decisions. J Am Dent Assoc. 2015;146(11):800–807. doi: 10.1016/j.adaj.2015.05.015 [DOI] [PubMed] [Google Scholar]
- 27.Knopf JA, Finnie RK, Peng Y, et al. School-b ased health centers to a dvance health equity: a community guide systematic review. Am J Prev Med. 2016;51(1):114–126. doi: 10.1016/j.amepre.2016.01.009 [DOI] [PMC free article] [PubMed] [Google Scholar]
- 28.Joint Commission on Accreditation of Healthcare Organizations. Standards FAQ Details Available: https://www.jointcommission.org/mobile/standards_information/jcfaqdetails.aspx?StandardsFAQId=1857&StandardsFAQChapterId=74&ProgramId=5&ChapterId=74&IsFeatured=False&IsNew=False&Keyword=. Accessed January 10, 2021.
- 29.Jampani ND, Nutalapati R, Dontula BSK, Boyapati R. Applications of teledentistry: a literature review and update. J Int Soc Prev Community Dent. 2011;1(2):37–44. [DOI] [PMC free article] [PubMed] [Google Scholar]
- 30.Naughton DK. Expanding oral care opportunities: direct access care provided by dental hygienists in the United States. J Evid Based Dent Pract. 2014;14 Suppl:171–82.e1. doi: 10.1016/j.jebdp.2014.04.003 [DOI] [PubMed] [Google Scholar]
Associated Data
This section collects any data citations, data availability statements, or supplementary materials included in this article.