Abstract
Inorganic nanoparticles (NPs) are gaining increasing attention in nanomedicine because of their stimuli responsiveness, which allows combining therapy with diagnosis. However, little information is known about their interaction with intracellular or plasma proteins when they are introduced in a biological environment. Here we present atomistic molecular dynamics (MD) simulations investigating the case study of dopamine-functionalized TiO2 nanoparticles and two proteins that are overexpressed in cancer cells, i.e. PARP1 and HSP90, since experiments proved them to be the main components of the corona in cell cultures. The mechanism and the nature of the interaction (electrostatic, van der Waals, H-bonds, etc.) is unravelled by defining the protein residues that are more frequently in contact with the NPs, the extent of contact surface area and the variations in the protein secondary structures, at different pH and ionic strength conditions of the solution where they are immersed to simulate a realistic biological environment. The effects of the NP surface functionalization and charge are also considered. Our MD results suggest that less acidic intracellular pH conditions in the presence of cytosolic ionic strength enhance PARP1 interaction with the nanoparticle, whereas the HSP90 contribution is partly weakened, providing a rational explanation to existing experimental observations.
Controlling the protein corona formation onto nanomaterials is the “holy grail” of modern nanomedicine. This simulation study clarifies how the surface chemistry, pH, and ionic strength affect the protein corona formation onto decorated nanoparticles. 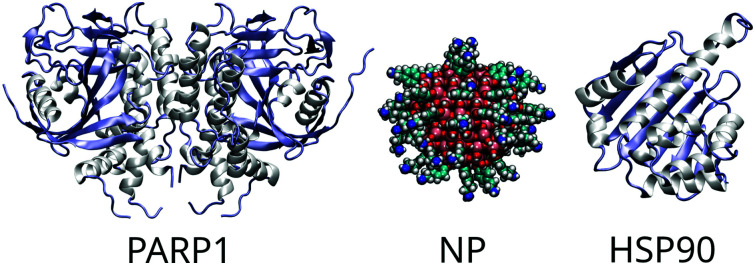
1. Introduction
The development of engineered nanoparticles (NPs) with unique and modulable surface properties is opening up a myriad of potential applications in nanomedicine1,2 and has been in the spotlight of mainstream biomedical research and development.3,4 Upon entering the blood plasma, it is well-established that biomolecules are readily adsorbed onto NPs, thus conferring a distinct “biological identity” to these newly-formed bio-inorganic complexes.5,6 This macromolecular fingerprint composed of proteins surrounding the NPs upon contact with the biological milieu is widely known as protein corona.7,8
Ordinarily, a protein corona is constituted by an inner layer of proteins strongly adsorbed on the NP surface (so-called hard corona) and an outer layer of proteins loosely bound to the hard corona layer mainly via protein–protein interactions. Exchange time rates of strongly and weakly bounded proteins are dictated by the kinetic rate of adsorption and desorption in the protein corona, also known as the “Vroman effect”.9 The balance between the residence time and association rates determines the protein corona composition over time.
Controlling the protein corona formation upon entrance of NPs in the biological medium is of utmost importance to meet the criteria for a broad range of biomedical applications.10–12 An effective way is to design NPs with surface properties that regulate protein-binding affinity, which rely on a molecular understanding of the NP surface chemistry.13,14 Surface functionalization has been proven an attractive route to design NPs with controlled protein corona formation since it creates a single- or multi-component layer interfacing the NP and the proteins in the biological milieu and provides tunable physicochemical properties, such as surface charge15 and hydrophobicity,16 which can be modulated using a vast range of chemical compounds, such as small organic molecules (e.g., dopamine,17,18 3,4-dihydroxyphenylacetic acid (DOPAC)18), polymers (e.g., polyethylene glycol (PEG)),12 zwitterionic ligands,19 macromolecules (e.g., DNA oligonucleotides,20–22 oligopeptides23,24 and proteins25,26), and so forth. Interestingly, functionalization with organic ligands containing either amine (positively charged at physiological pH) or carboxyl (negatively charged at physiological pH) groups strongly affects the hard corona composition.27 Another critical aspect of controlling the features of protein adsorption onto NPs is the presence of mobile ions in solution. Wang et al. have found that high ionic strength conditions make polystyrene NPs colloidally unstable, and the adsorbed proteins seem to promote NP agglomeration.28
From a theoretical perspective, numerical molecular dynamics (MD) simulations have been proven a powerful tool to investigate the role, for instance, of NP charge29 and size,30 surface chemistry31 and pH changes32 on the binding affinity of proteins and their cellular delivery, of the overall NP charge/neutrality on the adsorption of globular proteins,33 of NP ligand surfactants in the protein–NP interactions,34 and of conformational changes of proteins in the corona.35 MD simulation analyses have often focused on physico-chemical properties, such as intermolecular forces, residues contacts, surface area of contact, and secondary structure changes of corona proteins to understand better the molecular mechanism of protein corona formation adsorbed onto nanomaterials.29,31,36–40 Recently, Wang et al.41 have combined all-atom MD simulations and experimental methods to acquire a detailed picture of secondary structure changes of bovine serum albumin (BSA) protein corona onto gold nanorods: they found an increased content of β-sheets and loops while a decreased content of α-helix structures after BSA adsorption. With a similar computational/experimental approach, Lu et al.42 have determined that protein–NP interactions can be modulated by the degree of hydroxylation over graphene and gold nanomaterials. Moreover, Khan et al.43 have systematically investigated the role of surface ligands varying their hydrophobicity, density, and charges using a set of experimental methods in combination with a computational docking study. Interestingly, they found that short hydrophobic chains with positively charged amine-based headgroups attached to a gold NP strongly favor protein binding.
It is worth recalling that the protein corona formation in the biological milieu comprehends a much higher level of complexity than single-protein experiments and spans timescales much longer than those reachable by all-atom MD simulations.44,45 Invariably, it is necessary to resort to models with a reduced level of resolution to study systems containing greater complexity (e.g., multiple proteins and NPs in solution) and processes that occur in long-time scales (e.g., exchanges of soft corona proteins and NP–cell interactions). Simulation techniques such as implicit solvent methods,46 coarse-graining methods,31–33,38,44,47,48 mean-field theory,49 and multiscale methods34,38,39,44,50 have been successfully applied to mitigate these limitations.
A molecular understanding of how the NP surface chemistry affects not only the protein corona formation and composition in the blood plasma but also after their internalization and localization within cells is an essential step towards more effective and safe applications in vivo.51,52 Once taken by cells, the protein corona composition acquired in the blood plasma is changed upon adsorption of intracellular proteins, which in turn determines the NP fate. Recent experimental findings have shown that cytotoxicity and localization of NPs within cells is surface charge-dependent, and this tunable parameter can specify the mechanism of cell death.53,54 For instance, Schaeublin et al.54 have noticed that Au NPs functionalized with positively or negatively charged ligands have a preferential location for intracellular compartments and trigger cell death via apoptosis, whereas, neutral Au NPs are preferentially observed to locate in the cytoplasm and to induce cell death via necrosis. In addition, Asati et al.53 have shown that positively and negatively charged CeO2 NPs are preferentially located in lysosomes and trigger cytotoxicity effects in cancer cells. Moreover, Huang et al.55 have found that negatively charged NP surfaces enhance both penetration and accumulation into tumor cells because of a corona formed by serum proteins.
Among the myriad of proteins within human cells, two are of particular interest in the protein corona formation with nanomaterials. One is the so-called heat shock proteins (HSPs), which are overexpressed as a physiological response to cellular stress and severe pathological conditions. Specifically, HSP90 proteins (acronym due to their approximate molecular weight of 90 kDa) exist as two cytoplasmic isoforms, namely HSP90-α and HSP90-β.56 They are mostly located in the cytoplasm and linked to cellular pathways such as cell signaling, cellular differentiation, RNA synthesis, and preventing protein aggregation. Furthermore, it is well-known that the cytosolic isoforms of HSP90 play a pivotal role in pathological processes where the cellular machinery is under stress, such as cancer, cystic fibrosis, diabetes, neurodegenerative diseases, and others.57 The second is the nuclear protein poly(ADP-ribose) polymerase 1 (PARP1), which is mainly localized in the nucleoplasm and implicated in multiple cellular processes.58,59 Among them, the repair of single-stranded DNA plays a fundamental role in the proliferation and death of cells. It is also noteworthy to mention the use and implication of PARP1 inhibitors to impair the upregulation of DNA repair mechanisms and trigger the tumor cell death, therefore, improving the clinical outcome.60 Hence, the NPs may affect the normal trafficking of hard and soft corona proteins in the intracellular milieu. A recent study by Soto Veliz et al.61 has suggested a downregulation and depletion of PARP1 and HSP90 proteins in fibroblast cells due to the corona formation with calcium carbonate nanomaterials. Interestingly, Lastra et al.17 have investigated the protein corona composition of non-targeted dopamine functionalized TiO2 NPs in the intracellular milieu of human cervical cancer (HeLa) cells and noticed depletion of HSP90 and PARP1 proteins from HeLa cell cultures. Furthermore, the authors found out that these two proteins were the primary constituent of the NP's protein corona showing different degrees of binding.
In the present computational study, we clarify how the surface chemistry of fully-decorated dopamine 2.2 nm TiO2 NPs (whose structure was obtained in a previous study by some of us through quantum mechanical – density functional theory – calculations)62–65 affects the protein corona formation with two intracellular proteins, namely PARP1 and HSP90, under explicit water solvation. The NP model and the proteins we consider here are the same as those studied experimentally by Lastra et al.17 Tunable protonation states of the terminal amine group of dopamine (DA) ligands (pKa ∼9.75) at physiological and alkaline conditions allow a realistic modulation of the NP surface charge, giving rise to a cationic (net charge +46) and a neutral NP (net charge zero) model, respectively. The pH effect is also considered on the HSP90 and PARP1 titratable residues in the presence or absence of ionic strength. Since the isoelectric point (pI) for HSP90 falls within a pH range of 4–5, this protein will bear a negative net charge at physiological pH conditions. While, for PARP1, since the pI falls within a pH range of 8–9, this protein will bear a positive net charge at physiological pH conditions.
To preserve the atomistic details and allow a detailed study of relevant molecular interactions involved in the protein corona formation and stability onto NPs, we use classical molecular dynamics simulations based on the all-atom Chemistry at HARvard Macromolecular Mechanics (CHARMM) force field. Since the protein corona formation takes place at time scales out of reach to standard all-atom MD simulations under explicit water solvation, we mitigate this limitation by implementing an MD simulation scheme that combines a pre-relaxation of the protein–NP complexes using implicit MD simulations followed by a further long-time MD simulation under explicit solvation. Within this simulation scheme, the solvent effect in the pre-treatment phase is accounted implicitly using the distance-dependent-dielectric (DDD) method originally implemented in the CHARMM MD code,66,67 which speeds up the adsorption process of proteins onto the NPs and affords reliable starting-point structures for the protein–NP complexes to be further studied under explicit water solvation at different pHs in the presence or absence of physiological ionic strength conditions.
2. Computational methods
2.1. Molecular dynamics simulations
2.1.1. General MD simulation protocol
The starting structure of the dopamine-decorated 2.2 nm-sized anatase TiO2 NP model adopted here has a stoichiometry of (TiO2)223·10H2O and is fully decorated with 46 dopamine molecules. This dopamine-decorated TiO2 NP model results from previous work62 and the protocol used to obtain the equilibrated structure using high-level density functional based tight binding (DFTB) and density functional theory (DFT) QM calculations can be found elsewhere.63,64 The structures of PARP1 (PDB ID:4R5W68) and HSP90 (PDB ID:1BYQ69) proteins were downloaded from the Protein Data Bank (rcsb.org)70,71 and preprocessed using the CHARMM-GUI Solvation Builder.72,73 The standard Solvation Builder minimization and equilibration protocol were carried out to remove the protein restraints gradually. The protonation state of protein residues was assigned using PROPKA74,75 at physiological (pH 7.4) and alkaline (pH 11.5) conditions. The rationale behind the choice of these pH values is that, under these aqueous solution conditions, DA ligands are fully protonated or fully deprotonated, giving rise to a cationic and a neutral NP model, respectively. Bonded and non-bonded parameters for the proteins and DA ligands were assigned using the CHARMM36 FF76–79 and the water molecules using the CHARMM TIP3P water model.80–82 The partial atomic charges and Lennard-Jones (12-6) parameters for the TiO2 NP were assigned according to the coordination number of the titanium and oxygen atoms using an optimized version of the original Matsui-Akaogi FF83 refined by Brandt et al.84 The TiO2 nanoparticle core was treated as an independent, single rigid body, able to move and rotate in the system. This treatment allows the TiO2 core to be treated as a dynamic particle in the simulation box while keeping its DFTB-optimized geometry and avoiding any misshaping during the MD simulation. All MD simulations were carried out using the CHARMM implementation in the LAMMPS code (version 29 Oct 2020, http://www.lammps.org).85
2.1.2. Implicit solvent MD simulations
The protocol to search for a proper starting structure for the protein–NP complexes is detailed in section 2.3. The DDD approach was adopted to recover the solvent effects in an implicit manner. All MD simulations were carried out in the canonical ensemble (NVT) with the temperature (T = 303.15 K) held constant by using a Langevin friction force with the damping coefficient at 0.1 ps−1. The long-range solver particle–particle particle-mesh (PPPM)86 handled the electrostatic interactions with a real-space cutoff of 10 Å and a threshold of 10−5 for the error tolerance in forces. The short-range Lennard-Jones 12-6 interactions were truncated with a 10 Å cutoff with a switching function applied beyond 8 Å. Newton's equations of motion were solved using the Velocity-Verlet integrator with a timestep of 2 fs. The SHAKE algorithm87 imposed the holonomic constraints on all covalent bonds involving hydrogen atoms.
2.1.3. Explicit solvent MD simulations
After relaxation by implicit MD simulations (section 2.3), the most stable protein–NP complexes were then solvated in a large cubic box of explicit TIP3P water molecules with their edges placed at least 10 Å far from the protein–NP complexes. The water molecules overlapping or lying at distances shorter than 2.0 Å from the protein and NP surfaces were removed, and K+ and Cl− counter-ions were added accordingly to keep the system's electroneutrality. Systems under physiological ionic strength conditions were set by adding KCl at 0.15 M in solution. The MD production phase explored 300 ns of the phase space in the NVT ensemble at T = 303.15 K under periodic boundary conditions (PBC). The temperature was held constant by using a Langevin friction force with the damping coefficient at 0.1 ps−1. The long-range solver PPPM86 handled the electrostatic interactions with a real-space cutoff of 10 Å and a threshold of 10−5 for the error tolerance in forces. For the short-range Lennard-Jones 12-6 potential, we utilized a cutoff of 10 Å with a switching function applied beyond 8 Å. Newton's equations of motion were integrated in time using the Velocity-Verlet integrator with a timestep of 1.5 fs. The SHAKE algorithm87 was used to impose holonomic constraints on all covalent bonds, including hydrogen atoms. Table 1 summarizes all MD simulations studied in this work.
Summary of explicit solvent MD simulations carried out in this work. For the details on the NP model and charge state see section 2.2. The ionic salt introduced in the simulation box is KCl at 0.15 M concentration.
| Protein | Nanoparticle | NP charge | Solvation | pH | Salt | MD time |
|---|---|---|---|---|---|---|
| PARP1 | DA-TiO2 | Cationic | Explicit | 7.4 | Yes | 300 ns |
| Cationic | Explicit | 7.4 | No | 300 ns | ||
| Neutral | Explicit | 11.5 | Yes | 300 ns | ||
| Neutral | Explicit | 11.5 | No | 300 ns | ||
| HSP90 | DA-TiO2 | Cationic | Explicit | 7.4 | Yes | 300 ns |
| Cationic | Explicit | 7.4 | No | 300 ns | ||
| Neutral | Explicit | 11.5 | Yes | 300 ns | ||
| Neutral | Explicit | 11.5 | No | 300 ns |
2.2. NP models and charge states
The TiO2 NPs are functionalized with 46 dopamine (DA) ligands. This model has been obtained by quantum mechanical calculations, based on density functional theory, in previous works.62–65 Here, the relative atomic positions of Ti and O atoms are kept rigid during all the MD simulations, whereas the DA atoms are allowed to move. The charge state of the NP is determined by the protonation state of the DA amino group: at physiological pH conditions (7.4), we consider the DA amino group to be protonated (cationic NP), whereas at alkaline pH conditions (11.5) we consider the DA amino group to be deprotonated (neutral NP).
For the sake of comparison, we also performed some MD simulations of protein corona formation around an identical non-functionalized TiO2 NP. The results are summarized and briefly discussed in the ESI.†
2.3. Starting-point geometries for protein–NP complexes
One major limitation of full-atomistic models applied to large-scale simulations of biomacromolecular systems lies in the restricted time and length scales that such an approach can reach compared to real experiments. It is well-known in the literature that full-atomistic MD simulation of macromolecules, such as large proteins in solution, retains a highly starting-structure dependence due to insufficient sampling of the conformational phase.88,89 Hence, if the disposition of macromolecules in a particular complex is not known beforehand, arranging such large molecules within a certain region of space using molecular packing algorithms (a common approach to generate starting-point structures for MD simulations) does not guarantee that the resulting geometry will be the most energetically stable one.
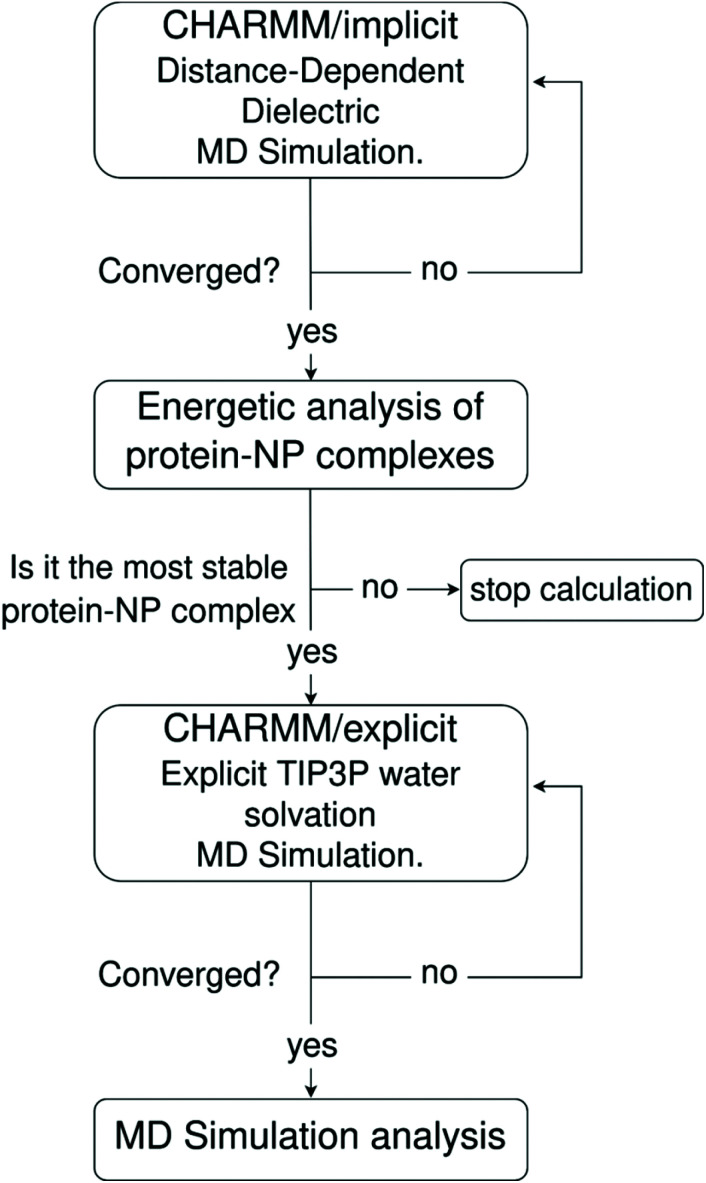
To tackle this issue, we propose a three-step MD framework that combines (1) a pre-relaxation via implicit DDD simulations, (2) identification of the most stable protein–NP complex by evaluating the total energy of protein–NP complexation, (3) explicit water solvation of the most stable protein–NP complexes (obtained in step 2) followed by full-atomistic MD simulations up to 300 ns. Scheme 1 summarizes each step in the simulation protocol adopted in this work.
Scheme 1. Workflow of the implicit–explicit solvent MD simulation framework adopted in this work.
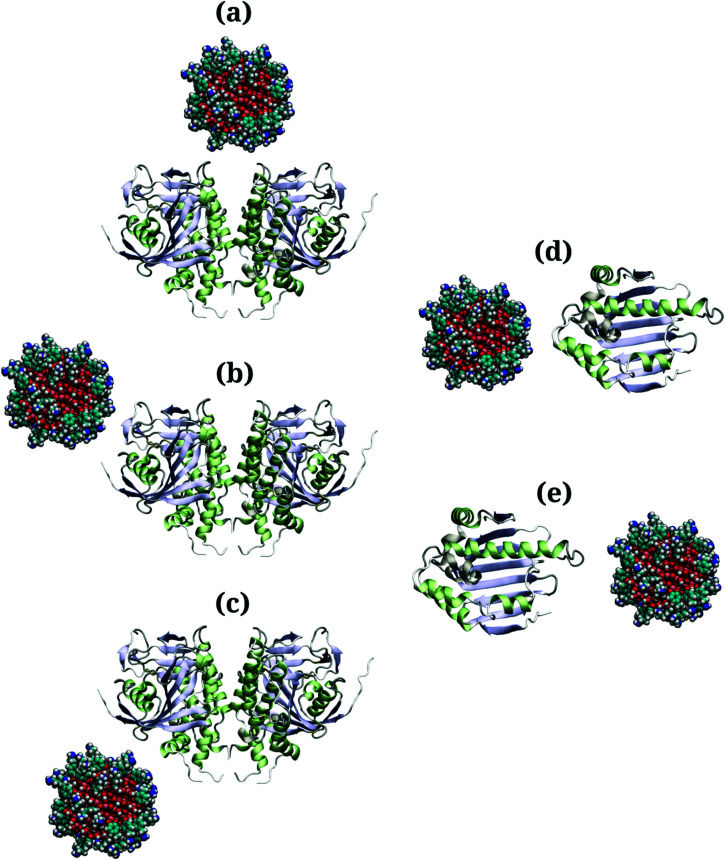
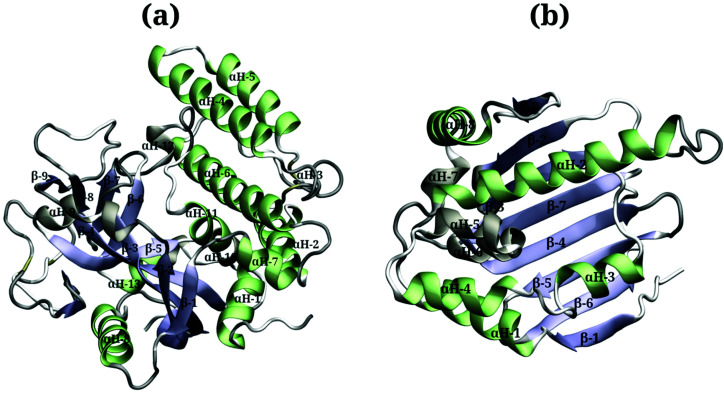
Due to the large surface area of the PARP1 dimer, we have simulated multiple starting-point structures for the PARP1-NP complex through implicit MD simulations. A single NP was positioned at three different locations around PARP1, while two different NP locations were tested around HSP90, as shown in Fig. 1. Besides, we also provide a more detailed picture of the secondary structure of PARP1 and HSP90 in Fig. 2, as assigned in their respective X-ray structures.68,69
Fig. 1. (a–c) Starting structures of PARP1-NP and (d and e) HSP90-NP complexes pretreated using implicit solvent MD simulations. Color codes: red (O atoms), pink (Ti atoms), cyan (C atoms), blue (N atoms), white (H atoms), light blue (β-sheet domains), light green (α-helix domains).
Fig. 2. Protein secondary structures of (a) PARP1 and (b) HSP90 protein isomers.
In the starting-structure A (Fig. 1a), the NP is positioned facing the PARP1 catalytic domain, near to the β-turns (β-8 and β-9, Fig. 2a) and α-helix ends (αH-4, αH-5, and αH-12, Fig. 2a). In the starting-structure B (Fig. 1b), the NP is put near to the PARP1 catalytic domain but facing the β-1 sheet, the αH-1 and the αH-8 ends (Fig. 2a) instead. In the starting-structure C, we positioned the NP at the interface between the two PARP1 α-helical domains (Fig. 1c).
We applied the same protocol to obtain the starting-structure for the HSP90-NP complex to be simulated through explicit solvent MD simulations. Due to the smaller HSP90 surface area compared to PARP1, we positioned the NP at two different locations on the former protein surface. In the starting-structure D (Fig. 1d), the NP is positioned facing the HSP90 α-helix domains (Fig. 2b) whereas in the starting-structure E (Fig. 1e), we placed the NP facing the β-sheet domains of HSP90 (Fig. 2b).
Based on the energetic analysis of the protein–NP complexes obtained after relaxation through implicit solvent MD simulations, we found that the starting-structure A (Fig. 1a) for the PARP1-NP complex and the starting-structure E for the HS90-NP complex showed the lowest total energy, and therefore the most stable protein–NP complexes (please see ESI† for details).
3. Simulation analysis
To unveil the driving forces behind the protein–NP corona formation at a molecular-to-particle-level, we quantify the following MD descriptors over the MD production phase that are well-known to play a pivotal role in the protein–NP complexation:
3.1. Closest contact distance and NP angular orientation
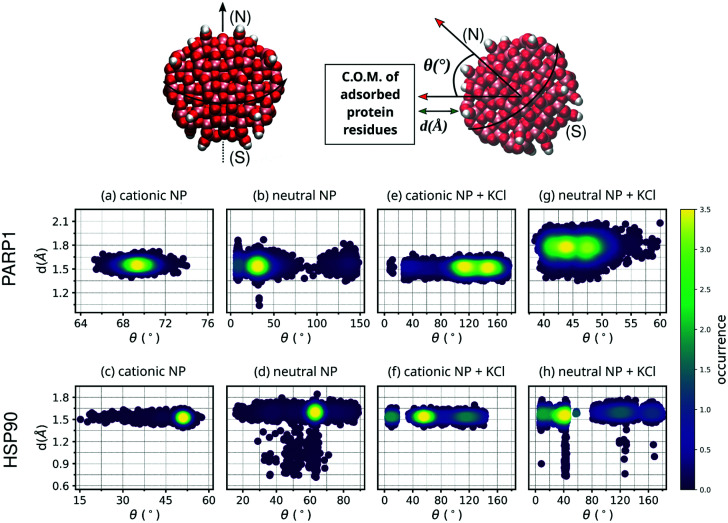
To verify the closeness between proteins and NPs after the complex formation as well as the NP orientation to the protein corona residues, we estimate both the closest contact distance between protein–NP and the angle formed between two vectors: one vector defined from the NP center passing through its north pole, and a second vector defined from the NP center to the center-of-mass (C.O.M.) of protein corona residues adsorbed on the NP surface (please see Fig. 3 for details).
Fig. 3. Contour plot of NP angular orientation and closest distance between NP and protein over the last 50 ns of MD production. For the sake of clarity, DA ligands around the TiO2 NP core are not shown. The following letter codes stand for: (a) PARP1 and cationic NP complex at pH 7.4, (b) PARP1 and neutral NP complex at pH 11.5, (c) HSP90 and cationic NP at pH 7.4, and (d) HSP90 and neutral NP complex at pH 11.5, (e) PARP1 and cationic NP at pH 7.4 + KCl at 0.15 M, (f) HSP90 and cationic NP at pH 7.4 + KCl at 0.15 M, (g) PARP1 and neutral NP at pH 11.5 + KCl at 0.15 M, (h) HSP90 and neutral NP at pH 11.5 + KCl at 0.15 M. Top: Definition of angular orientation and closest distance descriptors estimate to the protein–NP complex over the MD production phase are given in section 3.1.
3.2. Surface area of contact
This MD descriptor estimates the surface area extent of the protein corona adsorbed onto NPs. In other words, this MD descriptor quantifies the total area of the NP surface covered by the protein corona as a function of MD simulation time. To accurate quantify the surface area of contact in the protein–NP complexes, we made use of the Voronoi tessellation via the Voro++ implementation in LAMMPS.90
3.3. Contact probability and protein secondary structure
To identify and characterize the molecular moieties involved in the protein corona and examine the protein structural changes over the MD simulation, we estimate the probability density for each protein's amino acid residue adsorbed on the NP surface as well as the protein secondary structure that they belong to. In the contact probability analysis, we count as a contact when atoms belonging to different selections are within a cutoff less than 3.0 Å.
3.4. Hydrogen-bonding
To quantify the occurrence of hydrogen-bonds (H-bonds) in the protein–NP complex, we track each protein's amino acid residue forming H-bonds with the dopamine-decorated TiO2 NP during the MD simulation. We count as an H-bond when both the following geometrical criteria are satisfied: (1) the distance between the H-donor and H-acceptor heavy atoms is less than 3.5 Å; (2) the angle between the H-donor and H-acceptor heavy atoms, having the hydrogen atom as vertex, is less than 30°.
3.5. Electrostatic and van der Waals interactions
To evaluate the energetic nature of molecular interactions in the protein–NP corona, we quantify the total interaction energy between proteins and NPs breaking it down into its electrostatic and vdW components.
4. Results and discussion
In this work, we investigate the role of dopamine-functionalization, NP charge, ionic strength, and pH conditions on the corona formation and composition of two intracellular proteins, namely PARP1 and HSP90, around TiO2 NPs. Through this work, we estimate relevant biophysical properties arising from the protein–NP interactions. The following section will first elucidate the degree of engagement between protein and NP and the preferential NP orientation to the protein corona through an extensive analysis of structural MD descriptors. Next, we will quantify the surface area extent of PARP1 and HSP90 corona adsorbed onto NPs through Voronoi analysis and characterize, based on the contact probability and secondary structure analysis, the molecular composition and the most relevant changes in the secondary structure of molecular moieties involved in the protein corona. Further, we will shed light on the importance of intermolecular forces in driving and keeping the protein–NP corona stable by quantifying, separately, the electrostatic and vdW interactions in the protein–NP complexes. Finally, we will discuss our results in light of recent theoretical and experimental studies available in the literature.
4.1. Equilibrium distance and NP orientation to the protein corona
The MD descriptors analyzed here, namely the closest contact distance and the angular NP orientation, are used to check the NP orientation and equilibrium distance to the protein corona over the MD trajectories. Although these MD descriptors do not provide relevant information about the extent or nature of the protein–NP corona, they are helpful to quantify both the protein closeness and the NP orientational behavior to the respective protein corona.
As shown in Fig. 3, the closest contact distances fall within a narrow range of values (from 1.5 to 1.7 Å) for all protein–NP complexes, indicating stable engagement between the NPs and their respective proteins in the system through the whole MD production phase. However, the angle formed between the two predefined vectors, defined in section 3.1, i.e. the first from the NP center to the NP north pole and the second from the NP center to the C.O.M. of protein corona residues, shows a broader range of values among the protein–NP complexes under study here. We observe that the neutral NP leads to more scattered angle values in the case of PARP1 or HSP90 in solution.
Noteworthy, we observe a more perpendicular orientation of the cationic NP south–north pole direction to the PARP1 corona residues (∼69.3°) than the neutral NP (∼39.7°), as seen in Fig. 3a and b. In contrast, we notice that the cationic NP acquires a slightly more parallel orientation (∼50.1°) of its south–north pole axis towards the vector passing through the NP center and the C.O.M. of HSP90 corona residues (Fig. 3c), as compared to the neutral NP (∼61.3°) (Fig. 3d).
Regarding the variation of the NP angular orientation upon KCl addition in solution, we observe that in all protein–NP complexes, independently if physiological or alkaline pH conditions are set, the angular values formed between the two predefined vectors above (see section 3.1) become higher, and therefore, more perpendicular to the protein corona residues adsorbed on the NP surface, compared to the same complexes in the absence of salt. As seen in Fig. 3e vs. 3a, cationic NP moves its south–north pole direction farther from the PARP1 corona residues (122.3° vs. 69.3°, respectively) due to the presence of physiological ionic strength, whereas only a slight effect is observed in Fig. 3g vs. 3b in the case of neutral NP (45.4° vs. 39.7°, respectively). Higher angular values are also observed between the HSP90 corona residues and NPs upon adding KCl in solution (Fig. 3f and h), although to a lesser extent than what is observed in the PARP1-NP complexes. For the HSP90-NP complexes, we estimate that cationic and neutral NPs keep an average angular value of about 66° to the HSP90 corona residues adsorbed on their surface, whether physiological or alkaline pH conditions are set.
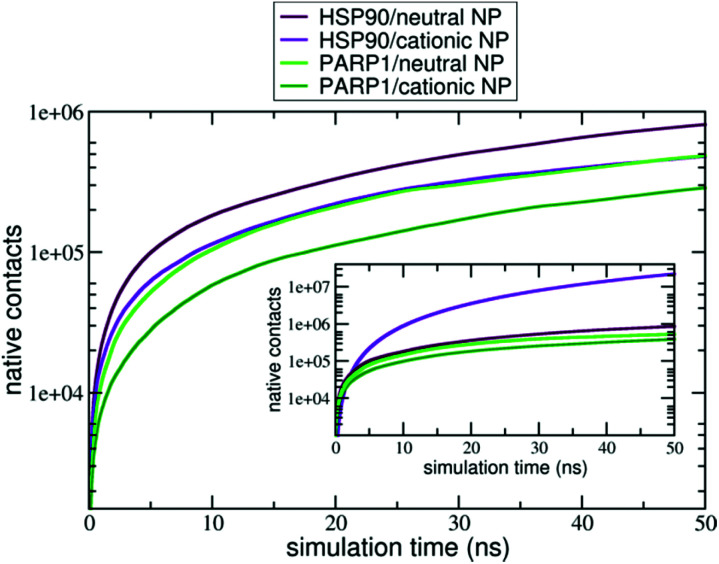
Moreover, the native contacts analysis (for further details, please see section S2 in the ESI†) shows a distinct trend for the protein–NP complexes whether cationic or neutral NPs are present in solution, as seen in Fig. 4. PARP1 and HSP90 establish a higher number of native contacts with the neutral NP (light green and maroon lines, respectively) compared to the cationic one in the absence of ionic strength in solution (dark green and violet lines, respectively). Overall, we notice that alkaline pH conditions lead to a higher number of contacts in both PARP1- and HSP90-NP complexes. Under physiological ionic strength conditions, we observe an opposite trend for the HSP90-NP complexes, as shown in the inset of Fig. 4 (violet and maroon lines). There is a considerable increase in the number of contacts between HSP90 and the cationic NP (violet line in the inset of Fig. 4) compared to the same complex under no ionic strength conditions (violet line in Fig. 4). In addition, for the PARP1 complexes, we see that the number of contacts between PARP1 and the neutral NP (light green line in the inset of Fig. 4) becomes slightly higher compared to the PARP1 complex formed with the cationic NP in the absence of salt (light green line in Fig. 4).
Fig. 4. Number of native contacts between (violet) HSP90 and cationic NP at pH 7.4, (maroon) HSP90 and neutral NP at pH 11.5, (dark green) PARP1 and cationic NP at pH 7.4, (light green) PARP1 and neutral NP at pH 11.5 over the last 50 ns of MD production phase. Inset: number of native contacts in the protein–NP complexes under physiological ionic strength (the same color codes are used).
Even after shedding light on the MD structural descriptors analyzed above, crucial information about the extension of the protein corona adsorbed on the DA-functionalized NP's surface and about the molecular-driven force behind it is still lacking. The following sections provide a quantitative analysis in this regard.
4.2. Surface extent of protein–NP corona
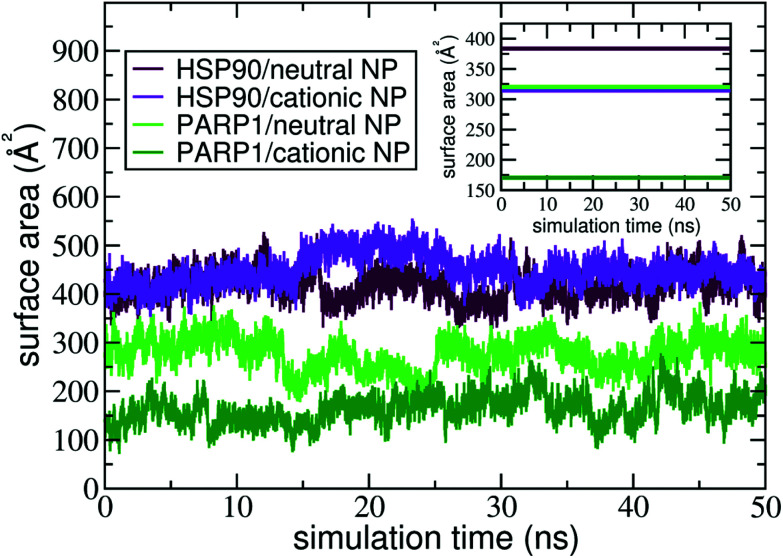
The contact surface area is an informative MD descriptor to examine the surface extent of protein's adsorption onto the NP surface. To this end, we quantify the contact surface area at the protein–NP interface utilizing Voronoi tessellation (details in ESI†). Fig. 5 shows the contact surface area for the protein–NP complexes constituted by HSP90 and PARP1 proteins and cationic and neutral NPs, respectively.
Fig. 5. Contact surface area of PARP1 and HSP90 proteins onto neutral and cationic NPs over the last 50 ns of MD production phase. The following color codes are used: (light green) PARP1 and neutral NP, (dark green) PARP1 and cationic NP, (maroon) HSP90 and neutral NP, and (violet) HSP90 and cationic NP.
As seen in Fig. 5, PARP1 shows more extensive adsorption on the neutral NP surface, with an average value of 270 ± 34 Å2. While, for the cationic NP, the extent of surface area of PARP1 corona has an average value of 166 ± 30 Å2. These results indicate a higher tendency of PARP1 adsorption onto the neutral NP than the cationic NP one. On the other hand, HSP90 has its more extensive corona formation onto the cationic NP surface, with an average value of 448 ± 32 Å2. While, for the neutral NP, the HSP90 adsorption onto its surface slightly drops to an average value of 417 ± 30 Å2.
Noteworthy, the pH modulation of titratable residues in both DA ligands and proteins, and hence their protonation states and respective charges, have a more substantial effect on the extent of PARP1 corona than what we observe in the HSP90 complexes. As shown in Fig. 5, we see that the PARP1 adsorption drops 38.5% due to the protonation of DA ligands under physiological pH conditions. On the other hand, we notice a slight increase (7.3%) of HSP90 corona extension on the cationic NP compared to the neutral NP one. Besides, we observe that both neutral and cationic NPs partially disrupt the HSP90 secondary structure leading to a substantial increase in the contact surface area compared to other complexes. An in-deep analysis of secondary structures changes is given in section 4.3.
In the presence of physiological ionic strength in solution, we observe an opposite trend on the surface area extent of PARP1 and HSP90 corona formed on the NP surfaces, as seen in the inset of Fig. 5. On the one hand, we notice an increase in the surface area extent of PARP1 corona onto the neutral NP (320 ± 55 Å2), and to a lesser extent onto the cationic NP (171 ± 27 Å2) due to KCl addition in solution. On the other hand, we identify a decrease in the surface area extent of HSP90 corona on the NP surfaces, whether neutral (383 ± 48 Å2) or cationic (315 ± 16 Å2) charged, under physiological ionic strength in solution. For the PARP1-NP complexes, the presence of ionic strength in solution has a more significant effect on the surface area extent of PARP1 corona formed onto the neutral NP, showing an increase of about 19% compared to the same protein–NP complex in the absence of salt in solution. While, for the HSP90-NP complexes, we see a substantial decrease of about 30% in the surface area extent of HSP90 corona on the cationic NP surface compared to its counterpart in the absence of ionic strength in solution.
However, the molecular mechanism behind such phenomena and how the NP presence affects the protein structure is still unknown. To fill this gap, we investigate the role of each amino acid and its respective protein secondary structures implicated in the NP-corona formation in the following section.
4.3. Molecular identity of adsorbed protein residues and protein secondary structure changes
To unveil the molecular nature and specificity that drives the protein adsorption onto the NP surface, we estimate the contact probability density of each amino acid residue belonging to the protein corona and the changes in the protein secondary structure upon corona formation. In particular, through these MD descriptors, we can assess the probability of finding a particular amino acid residue adsorbed on the NP surface and assign the protein secondary structures that each of them belongs to. These MD descriptors are also used to guide the H-bond analysis in the following section (section 4.4).
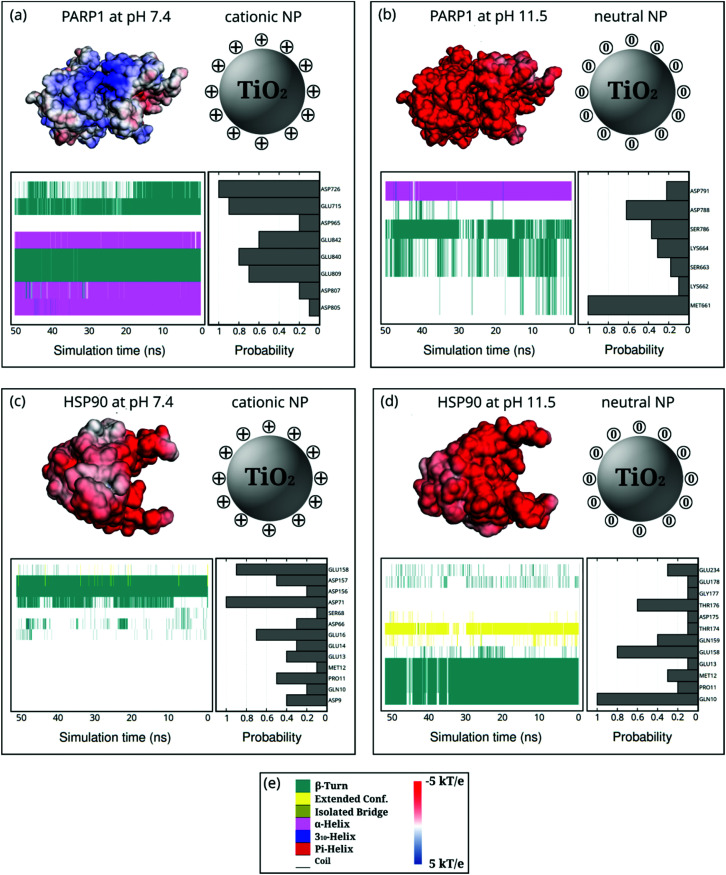
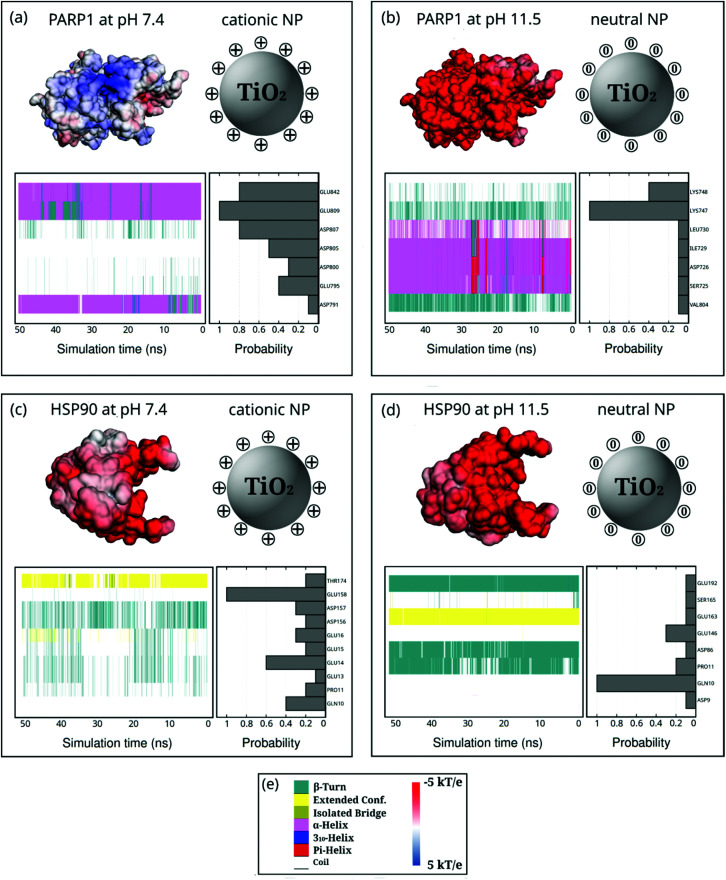
Fig. 6 and 7 show the probability of finding a particular amino acid residue of PARP1 or HSP90 adsorbed onto the neutral or cationic NPs, in the presence or absence of ionic strength in solution, respectively, over the last 50 ns of MD production trajectories.
Fig. 6. Probability density of PARP1 or HSP90 corona residues adsorbed onto neutral and cationic NPs and their protein secondary structures over the last 50 ns of MD production phase. For the sake of clarity, DA ligands around the TiO2 NP core are not shown but only protonation or charge state is indicated by + or 0. (a) PARP1 and cationic NP complex at pH 7.4, (b) PARP1 and neutral NP complex at pH 11.5, (c) HSP90 and cationic NP complex at pH 7.4, (d) HSP90 and neutral NP complex at pH 11.5. (e, left-hand side) color code for the protein secondary structures, (e, right-hand side) color code for the electrostatic potential.
Fig. 7. Probability density of PARP1 or HSP90 corona residues adsorbed onto neutral and cationic NPs under physiological ionic strength (KCl at 0.15 M) and their protein secondary structures over the last 50 ns of MD production phase. For the sake of clarity, DA ligands around the TiO2 NP core are not shown but only protonation or charge state is indicated by + or 0. (a) PARP1 and cationic NP complex at pH 7.4, (b) PARP1 and neutral NP complex at pH 11.5, (c) HSP90 and cationic NP complex at pH 7.4, (d) HSP90 and neutral NP complex at pH 11.5. (e, left-hand side) Color code for the protein secondary structures, (e, right-hand side) color code for the electrostatic potential.
PARP1 corona residues in the β-turns (44.4%), α-helix (36.5%), and random-coil (19.1%) secondary structures, in this order, are more likely to be adsorbed onto the cationic NP, as evidenced in Fig. 6a. Compared to the PARP1 secondary structure analysis in the absence of NP (please see Table S5, ESI†), we notice a considerable increase in the random-coil structures due to interactions with the cationic NP, whereas we see no substantial changes in the α-helix and β-turns secondary structures. Furthermore, we observe that the main contribution to the contact probability density occurs between the protonated DA ligands and the negatively charged aspartate (ASP726), and glutamate (GLU715 and GLU840) residues, the three of them belonging to an α-helix secondary structure in PARP1. To a lesser extent, GLU809, GLU842, ASP965, ASP807, and ASP805 contribute to the PARP1 corona contacts with the cationic NP.
Under alkaline pH conditions (Fig. 6b), we notice that random-coil (56.5%), β-turns (29.6%), and α-helix (13.9%) secondary structures are the protein motifs that contribute most to the PARP1 corona on the neutral NP. It is observed that neutral DA ligands favor the molecular engagement mostly with the non-polar methionine (MET661 in a random-coil secondary structure) and the negatively charged aspartate (ASP788 in a random-coil secondary structure) residues of PARP1. To a lesser extent, polar serine (SER786 and SER663 in a mixed β-turns/coil secondary structure), lysine (LYS664 and LYS662 in a mixed β-turns/coil secondary structure), and negatively charged aspartate (ASP791 in an α-helix secondary structure) residues also adsorb on the neutral NP surface.
In the HSP90-NP complexes, we identify a higher degree of adsorbed amino acid residues forming the protein corona than those found in the PARP1-NP complexes under equivalent pH conditions. Under physiological pH conditions, the HSP90 motifs that contribute most to the protein corona are random-coil (77.8%), β-turns (22.0%), and extended (0.2%). Compared to HSP90 in the absence of the cationic NP, we observe, on the one hand, a decrease in the β-turn secondary structures and, on the other hand, an increase in the random-coil secondary structure (please see Table S6, ESI†). As shown in Fig. 6c and d, we see an equivalent number of amino acid residues forming the HSP90 corona onto the NPs, whether under physiological or alkaline pH conditions. At alkaline pH conditions, the HSP90 motifs promoting the protein corona are the following: random-coil (56.4%), β-turn (35.3%), and extended (8.3%).
Next, we reveal the molecular identity of HSP90 corona residues involved in the protein corona formation onto NPs. Under physiological pH conditions, as shown in Fig. 6c, we see a higher contact probability between the cationic NP and the negatively charged aspartate (ASP71 and ASP157 in a mixed β-turn/extended and β-turn configuration, respectively) and glutamate (GLU158 and GLU16 in a random coil secondary structure) residues of HSP90. To a lesser extent, aspartate (ASP156, ASP66, and ASP9), serine (SER68), proline (PRO11), glutamate (GLU14 and GLU13), and glutamine (GLN10) also contribute to the HSP90 corona under physiological pH conditions. Under alkaline pH conditions (Fig. 6d), we identify a preferential interaction between the neutral DA ligands and the polar glutamine (GLN10 in a mixed β-turn/extended secondary structure), glutamate (GLU158 in a mostly random-coil secondary structure), and threonine (THR176 in a random-coil secondary structure) residues of HSP90. Furthermore, we also detect some residual contacts occurring between the neutral NP and a myriad of HSP90 residues, namely, glutamate (GLU13, GLU178, and GLU234), glutamine (GLN10, GLN159), glicine (GLY177), threonine (THR174), methionine (MET12) and aspartate (ASP175) residues.
Moreover, we also investigate how the presence of ionic strength in solution impacts the selectivity of protein residues adsorbing onto NPs (Fig. 7). In the presence of cationic NPs and physiological ionic strength in solution, we notice that the protein corona residues in PARP1 and HSP90 resemble the ones found in the absence of salt. For the PARP1-NP complex in the presence of the cationic NP (Fig. 7a), we identify GLU809, GLU842, and ASP807 as the most significant residues to the PARP1 corona. While, for the HSP90-NP complex under the same pH conditions above (Fig. 7c), we see that GLU158, GLU14, and GLN10 are the most relevant residues in the HSP90 corona. However, we observe a considerable change in the profile of PARP1 and HSP90 residues that contribute to the protein corona under physiological ionic strength and alkaline pH conditions (neutral NP), as compared to the same protein–NP complexes in the absence of salt in solution. We identify the LYS748 and LYS747 residues as the most relevant to the PARP1 corona with the neutral NP (Fig. 7b). Furthermore, for the HSP90-NP complex under alkaline conditions (Fig. 7d), the GLN10 residue shows the same probability to adsorb onto the neutral NP in the presence or absence of ionic strength, contributing the most to the protein corona formation.
From the analysis above, we can infer that the protonation state and the respective charge modulation of ionizable residues in both proteins and the NP ligands (DA) play a vital role in the degree of molecular contacts, and furthermore, in the secondary structure changes of protein motifs that maintain stable the protein–NP corona. In this section, we have characterized the degree of molecular contact and the prominent protein motifs involved in the protein corona formation over the NP surface. However, the molecular details of these protein–NP interactions supporting the corona are still unknown, and the next section sheds light on this matter.
4.4. Hydrogen-bonds in the protein–NP corona
To better understand the underlying nature of the molecular interactions that occur at the protein–NP corona and quantify it, we calculate the number of H-bonds formation for the most relevant protein residues in contact with the DA-decorated NPs during the MD production phase (section 3.4). Analysis of this MD descriptor supplies valuable information on the intermolecular interactions’ specificity. In addition, we also determine the chemical structures for the most recurrent pairs of interactions implicated in the H-bond formations at the protein–NP interfaces, which are predominantly established between protein residues and NP ligands.
We observe that the occurrence of H-bonds per residue contributing to the PARP1-NP corona is favored under physiological pH, while the number of residues participating in the PARP1 corona decreases at alkaline pH conditions (Fig. S5a and b, ESI†). HSP90 exhibits a similar trend as that of PARP1 above, in which the number of H-bonds per residue contributing to the protein corona is impaired under alkaline pH conditions (Fig. S5c and d, ESI†). Overall, both neutral and cationic DA ligands act mainly as H-donor while protein amino acid residues act mainly as H-acceptor.
We also observe that the pH conditions have a stout effect on the engagement of DA ligands with PARP1 or HSP90 corona residues through H-bonds and hence, drive the molecular selectivity of protein residues engaged in the corona formation. Analysis of PARP1- and HSP90-NP complexes under physiological pH conditions clearly show the preference of protonated DA ligands for negatively charged protein residues, namely glutamate and aspartate residues, to establish H-bonds interactions (Fig. S5, ESI†). In the PARP1-NP complex under physiological pH conditions (Fig. S5a, ESI†), we identify the following as the most contributing PARP1 residues to the protein corona through H-bonds, in this order of precedence: ASP726, GLU715, GLU840, GLU842 and ASP805. While, for the HSP90-NP complex (Fig. S5c, ESI†), the most contributing residues to the protein corona are GLU158, GLU16, ASP9, GLU13 and GLU14.
Under alkaline pH conditions, PARP1- and HSP90-NP complexes show distinct profiles of H-bond interactions at the protein–NP corona. On the one hand, we identify neutral DA ligands mainly forming H-bonds with the carboxyl group of glutamate residues at the HSP90-NP interface (Fig. S5d, ESI†), resembling those seen with the protonated DA ligands. They are, in order of precedence: GLU158, GLU178, THR176, GLU159, and GLU234. On the other hand, we identify a wider variety of PARP1 residues participating in the protein corona through H-bond interactions with the neutral DA ligands (Fig. S5b, ESI†) than the protonated DA ligands do. The most relevant PARP1 residues to the protein corona formation under alkaline pH conditions are, in order of precedence: LYS662, SER663, MET661, LYS664, and SER786.
To shed light on the molecular structure details of H-bond pairs of interaction at the protein–NP corona, we show the most representative H-bond pairs of interaction over the last 50 ns of MD production.
The scenario remains similar upon the addition of ionic strength in solution. Both PARP1- and HSP90-NP complexes under physiological pH and ionic strength conditions mainly establish H-bonds between their glutamate and aspartate residues and the protonated amino group of DA ligands. The most recurrent PARP1 residues doing H-bonds are GLU809, ASP805, GLU842, ASP807, and GLU795 (Fig. S6a†), while the HSP90 ones are GLU158, GLU14, ASP156, GLU15, and GLU16 (Fig. S6c†). Under alkaline pH and ionic strength conditions, H-bond interactions follow a similar trend as observed in the absence of salt in solution. There is a substantial decrease of PARP1 residues participating in H-bond interactions with the neutral DA ligands, whereas HSP90 interactions through H-bonds with the neutral DA ligands are less affected by pH changes. In the former case, we identify LYS747, SER725, LYS748, and ASP726 as the most relevant PARP1 residues contributing to the H-bonds at the protein–NP corona (Fig. S6b†). In the latter case, we find GLU163, GLN10, GLU146, and ASP86 as the most contributing HSP90 residues to the protein corona (Fig. S6d†).
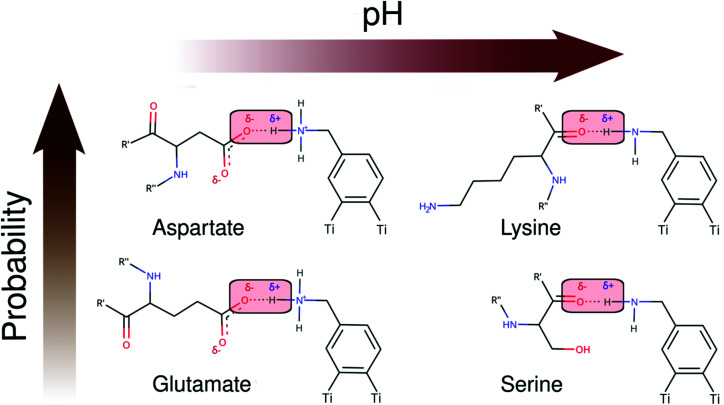
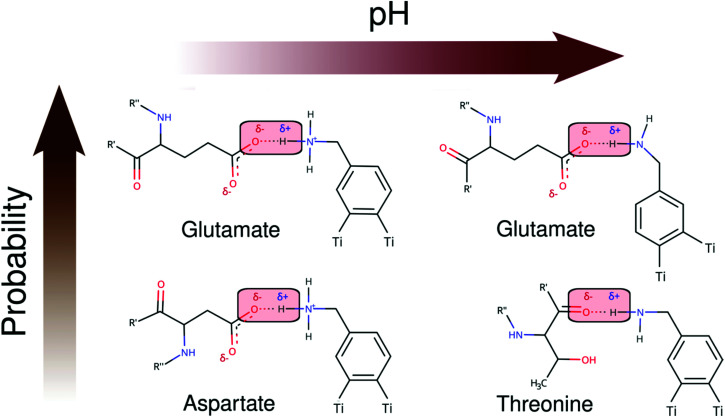
As seen in Schemes 2 and 3, we can identify at least two main H-bond modes in the protein–NP corona, which are driven according to the molecular nature of the amino acid residue and the protonation state of DA ligands grafted on the NP surface. The primary H-bond mode, and the most recurrent one, is primarily established through H-bonds between the negatively charged carboxyl groups of aspartate and glutamate residues as H-acceptor, and the amine group of DA ligands, protonated or not, as H-donor. This interaction mode is dominant in all studied protein–NP complexes. Schemes 2 and 3 also illustrate the secondary and less recurrent H-bond mode, where the backbone carbonyl groups of less polar amino acid residues establish H-bonds with the neutral DA-NH2 group of DA ligands.
Scheme 2. 2D molecular structures of most recurrent H-bond pairs of interaction in the PARP1 corona with cationic and neutral NPs under physiological and alkaline pH conditions, respectively.
Scheme 3. 2D molecular structures of most recurrent H-bond pairs of interaction in the HSP90 corona with cationic and neutral NPs under physiological and alkaline pH conditions, respectively.
In this section, we characterized and quantified each of the protein residues participating through H-bonds in the protein–NP corona during the last 50 ns of the MD production phase, providing further insights into the molecular nature of these interactions and highlighting the crucial role of the DA ligands in this respect. Undoubtedly, H-bond interactions are not the only contributor to the protein–NP corona formation. Then, for the sake of completeness, we also investigate the role of both van der Waals (vdW) and electrostatic contributions in the next section.
4.5. Electrostatic and vdW contributions to the protein–NP corona
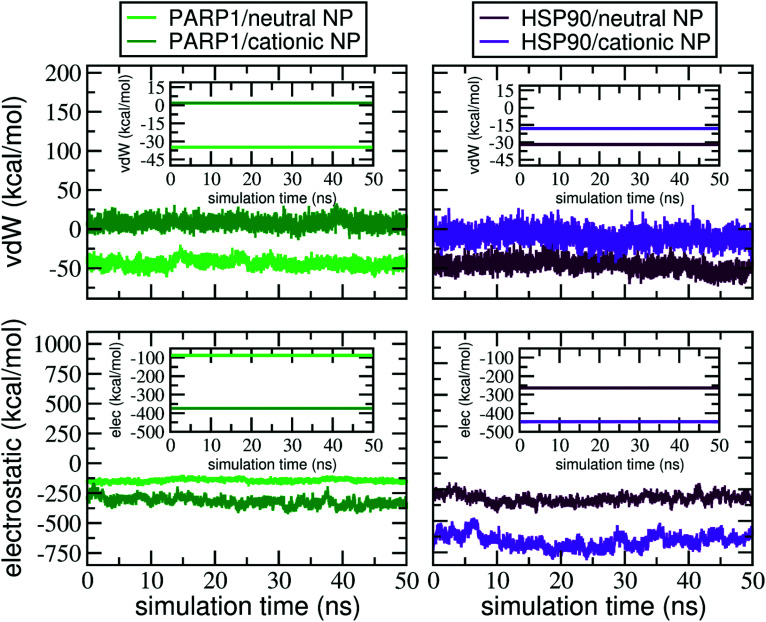
To quantify, from an energetic perspective, the role of nonbonded interactions in the protein–NP corona formation, we evaluate, separately, the electrostatic and vdW interactions that constitute the total interaction energy in the protein–NP complex. Fig. 8 shows the electrostatic and vdW interactions between the DA-functionalized NP and the protein (in different protonation or charge states) over the last 50 ns of MD production. Mean values and standard deviations for the data reported in Fig. 8 are given in the ESI, Tables S2 and S3.†
Fig. 8. Electrostatic and vdW energies in the protein–NP complex during the last 50 ns of MD production. Insets show the electrostatic and vdW energy values in the protein–NP complexes averaged over the last 50 ns of MD production. The following color codes are used: (light green) PARP1 and neutral NP complex, (dark green) PARP1 and cationic NP complex, (maroon) HSP90 and neutral NP, and (violet) HSP90 and cationic NP complex.
As seen in Fig. 8, we perceive a higher stabilization by electrostatic interactions due to the protonation of DA ligands (and the respective protein titratable residues) under physiological pH conditions, whereas it becomes less evident when the DA ligands are at the neutral protonation state under alkaline pH conditions. In addition, we find out that deprotonation of DA ligands leads to more favorable vdW interactions, making short-range interactions more stable between the neutral NP and proteins under alkaline pH conditions. In contrast, the protonation of DA ligands under physiological pH conditions leads to unfavorable vdW interactions between PARP1 and the cationic NP compared to the neutral one.
Besides, to elucidate how the net charge of NPs affects the nonbonded interactions with HSP90, we carry out a similar energetic analysis for the electrostatic and vdW components. We see favorable electrostatic interactions independent of the NP charge, although a more extensive electrostatic stabilization is perceived in the HSP90 corona formed on the positively charged NP surface under physiological pH conditions. However, we notice that vdW interaction energies behave differently in the HSP90-NP complexes. While the vdW contribution is considerably favorable between HSP90 and the neutral NP, the vdW interaction energies become more positive and, therefore, less favorable when DA ligands are at the protonated state on the NP surface.
At last, we investigate the effects on the intermolecular interactions due to the presence of KCl at 0.15 M in solution. At physiological ionic strength, we observe an attenuation in the electrostatic interactions between protein and NP in all protein–NP complexes but the complex between PARP1 and the cationic NP. However, the vdW interactions have a distinct effect whether physiological or alkaline pH conditions are considered. Upon adding KCl in solution, both PARP1- and HSP90-NP complexes show a substantial decrease in the vdW energy values and hence, more favorable vdW interactions under physiological pH conditions than those in the absence of salt. In contrast, we identify less favorable vdW interactions between PARP1 and HSP90 and the neutral NP at physiological ionic strength and alkaline pH conditions.
5. Conclusions
In this work we have investigated the role of surface functionalization, NP charge, and different solution conditions (pH and ionic strength) on the PARP1 and HSP90 corona formation through a combined implicit-explicit solvent MD simulation framework. In a broader context, our MD results suggest that less acidic intracellular pH conditions in the presence of cytosolic ionic strength (KCl at 0.15 M) enhance the PARP1 contribution to the corona. The same ionic strength conditions are found to partly weaken the HSP90 contribution, which is consistent with the experimental observation reported in ref. 17 where PARP was found to be the most stable and HSP90 the least within the protein corona.
5.1. NP charge and pH effects
Charge modulation of titratable residues in proteins and NP ligands (DA) due to pH changes directly impacts the degree and selectivity of protein residue adsorption onto NPs, and therefore, the extent and composition of the protein corona. Recently, atomistic MD studies have made use of several MD descriptors (e.g. contact probability,29,31,36,38,39,46,91 intermolecular distances,29,36,39,91 H-bond formation,29 protein secondary structure changes,29,38,39,46 and contact surface area36,91) to unveil the relevant intermolecular interactions taking place at the protein–NP interface, quantify the surface area extent of protein corona, examine secondary structure changes upon protein corona formation, and identify the most contributing amino-acid residues to the protein corona. In the same vein, we estimate these MD descriptors to identify the molecular identity and quantify the degree of PARP1 and HSP90 corona residues adsorbed onto neutral and cationic NPs. Our MD predictions show that PARP1 corona has a larger surface area adsorbed on the neutral NP surface, showing a degree of protein coverage higher than that on the cationic NP. While, for the HSP90 protein, we find no substantial changes in the extent of protein corona formed onto NPs, whether under physiological or alkaline pH conditions. In both PARP1- and HSP90-NP complexes, our findings support that negatively charged glutamate and aspartate residues, mainly through H-bond interactions, contribute most to the protein corona composition under physiological pH conditions. A similar trend is observed under alkaline pH conditions, although we notice an increasing contribution to the protein corona from H-bonds between the backbone carbonyl groups of PARP1 and HSP90 corona residues and neutral DA ligands.
5.2. Role of nonbonded interactions
Electrostatics has been pointed out by several authors as a key parameter to promote a selective protein corona formation. Based on our MD results, we can infer that electrostatic interactions are the main driving force behind the protein binding to NPs. As PARP1 (pI ∼8.6) and HSP90 (pI ∼4.8) are positively and negatively charged under physiological pH conditions, respectively, more favorable electrostatic interactions between the latter protein and cationic NPs are expected, in line with our MD predictions in Fig. 8. On the contrary, we notice that short-range vdW interactions between the cationic NP and proteins become less favorable under physiological pH conditions, whereas the neutral NP promotes more stable vdW interactions under alkaline pH conditions. Interestingly, our results show that vdW forces are likely linked to the surface area extent of PARP1 corona onto NPs. PARP1-NP complexes showing higher stabilization of vdW forces also present the largest extent of the protein corona, which is mainly furthered under alkaline pH and physiological ionic strength conditions.
5.3. Secondary structure changes upon protein binding to NPs
Understanding how NPs might affect the secondary structure of proteins directly impacts new materials design and their potential nanotoxicity. Our MD results reveal that, upon PARP1 and HSP90 corona formation onto cationic NPs, on the one hand, decreases the β-turn secondary structure content and, on the other hand, increases the random-coil structure content compared to the same proteins in the absence of NPs. However, the secondary structure moieties involved in the protein corona vary from one protein to another. We noticed that β-turn, α-helix, and random-coil motifs contribute most to the stability of the PARP1 corona, whereas the HSP90 corona is mainly composed of random-coil and β-turn motifs upon interaction with NPs.
5.4. Salt effect
The effects of physiologically relevant ionic salts in solution, or its absence,92 on the protein corona formation onto NPs is undoubtedly an essential step towards a better understanding of protein–NP interactions in biological fluids. Our MD findings show opposite effects on adsorption of PARP1 and HSP90 corona onto NPs in the presence of physiological ionic strength in solution. On the one hand, we observed that PARP1 adsorption onto NPs becomes more significant at physiological ionic strength conditions. On the other hand, we notice that the degree of HSP90 adsorption onto NPs decreases in the physiological KCl buffer. Further, physiological KCl concentration in solution makes more favorable vdW interactions in the protein–NP complex under physiological pH conditions, whereas the vdW contribution to the protein–NP complex becomes less relevant under alkaline pH conditions.
Conflicts of interest
The authors declare no conflict of interest.
Supplementary Material
Acknowledgments
The authors are grateful to Lorenzo Ferraro for his technical support. The project has received funding from the European Research Council (ERC) under the European Union's HORIZON2020 research and innovation programme (ERC grant agreement no. [647020]).
Electronic supplementary information (ESI) available. See DOI: 10.1039/d1nr07647g
Notes and references
- Nune S. K. Gunda P. Thallapally P. K. Lin Y.-Y. Forrest M. L. Berkland C. J. Expert Opin. Drug Delivery. 2009;6:1175–1194. doi: 10.1517/17425240903229031. [DOI] [PMC free article] [PubMed] [Google Scholar]
- Moghimi S. M. Hunter A. C. Murray J. C. FASEB J. 2005;19:311–330. doi: 10.1096/fj.04-2747rev. [DOI] [PubMed] [Google Scholar]
- Docter D. Distler U. Storck W. Kuharev J. Wünsch D. Hahlbrock A. Knauer S. K. Tenzer S. Stauber R. H. Nat. Protoc. 2014;9:2030–2044. doi: 10.1038/nprot.2014.139. [DOI] [PubMed] [Google Scholar]
- Langer R. Weissleder R. J. Am. Med. Assoc. 2015;313:135–136. doi: 10.1001/jama.2014.16315. [DOI] [PubMed] [Google Scholar]
- Cedervall T. Lynch I. Lindman S. Berggård T. Thulin E. Nilsson H. Dawson K. A. Linse S. Proc. Natl. Acad. Sci. U. S. A. 2007;104:2050–2055. doi: 10.1073/pnas.0608582104. [DOI] [PMC free article] [PubMed] [Google Scholar]
- Chen F. Wang G. Griffin J. I. Brenneman B. Banda N. K. Holers V. M. Backos D. S. Wu L. Moghimi S. M. Simberg D. Nat. Nanotechnol. 2017;12:387–393. doi: 10.1038/nnano.2016.269. [DOI] [PMC free article] [PubMed] [Google Scholar]
- Lundqvist M. Cedervall T. Small. 2020;16:2000892. doi: 10.1002/smll.202000892. [DOI] [PubMed] [Google Scholar]
- Ke P. C. Lin S. Parak W. J. Davis T. P. Caruso F. ACS Nano. 2017;11:11773–11776. doi: 10.1021/acsnano.7b08008. [DOI] [PubMed] [Google Scholar]
- Vroman L. Nature. 1962;196:476–477. doi: 10.1038/196476a0. [DOI] [PubMed] [Google Scholar]
- Albanese A. Tang P. S. Chan W. C. W. Annu. Rev. Biomed. Eng. 2012;14:1–16. doi: 10.1146/annurev-bioeng-071811-150124. [DOI] [PubMed] [Google Scholar]
- Casals E. Pfaller T. Duschl A. Oostingh G. J. Puntes V. ACS Nano. 2010;4:3623–3632. doi: 10.1021/nn901372t. [DOI] [PubMed] [Google Scholar]
- Alberg I. Kramer S. Schinnerer M. Hu Q. Seidl C. Leps C. Drude N. Möckel D. Rijcken C. Lammers T. Diken M. Maskos M. Morsbach S. Landfester K. Tenzer S. Barz M. Zentel R. Small. 2020;16:1907574. doi: 10.1002/smll.201907574. [DOI] [PubMed] [Google Scholar]
- Gunawan C. Lim M. Marquis C. P. Amal R. J. Mater. Chem. B. 2014;2:2060–2083. doi: 10.1039/c3tb21526a. [DOI] [PubMed] [Google Scholar]
- Feiner-Gracia N. Beck M. Pujals S. Tosi S. Mandal T. Buske C. Linden M. Albertazzi L. Small. 2017;13:1701631. doi: 10.1002/smll.201701631. [DOI] [PubMed] [Google Scholar]
- Podila R. Chen R. Ke P. C. Brown J. M. Rao A. M. Appl. Phys. Lett. 2012;101:263701. doi: 10.1063/1.4772509. [DOI] [PMC free article] [PubMed] [Google Scholar]
- Pérez-Fuentes L. Drummond C. Faraudo J. Bastos-González D. Materials. 2017;10:893. doi: 10.3390/ma10080893. [DOI] [PMC free article] [PubMed] [Google Scholar]
- Lastra R. O. Paunesku T. Gutama B. Reyes F. François J. Martinez S. Xin L. Brown K. Zander A. Raha S. Protic M. Nanavati D. Bi Y. Woloschak G. E. Precis. Nanomed. 2019;2:393–438. [Google Scholar]
- Huang D. Zhou H. Gao J. Sci. Rep. 2015;5:1–10. doi: 10.1038/srep14361. [DOI] [PMC free article] [PubMed] [Google Scholar]
- Moyano D. F. Saha K. Prakash G. Yan B. Kong H. Yazdani M. Rotello V. M. ACS Nano. 2014;8:6748–6755. doi: 10.1021/nn5006478. [DOI] [PMC free article] [PubMed] [Google Scholar]
- Paunesku T. Rajh T. Wiederrecht G. Maser J. Vogt S. Stojićević N. Protić M. Lai B. Oryhon J. Thurnauer M. Woloschak G. Nat. Mater. 2003;2:343–346. doi: 10.1038/nmat875. [DOI] [PubMed] [Google Scholar]
- Levina A. Ismagilov Z. Repkova M. Shatskaya N. Shikina N. Tusikov F. Zarytova V. J. Nanosci. Nanotechnol. 2012;12:1812–1820. doi: 10.1166/jnn.2012.5190. [DOI] [PubMed] [Google Scholar]
- Suzuki H. Amano T. Toyooka T. Ibuki Y. Environ. Sci. Technol. 2008;42:8076–8082. doi: 10.1021/es800948d. [DOI] [PubMed] [Google Scholar]
- Harrison E. Hamilton J. W. J. Macias-Montero M. Dixon D. Nanotechnology. 2017;28:295602. doi: 10.1088/1361-6528/aa77ac. [DOI] [PubMed] [Google Scholar]
- Di Foggia M. Tugnoli V. Ottani S. Dettin M. Zamuner A. Sanchez-Cortes S. Cesini D. Torreggiani A. Biomolecules. 2021;11:959. doi: 10.3390/biom11070959. [DOI] [PMC free article] [PubMed] [Google Scholar]
- Cox A. Vinciguerra D. Re F. Magro R. D. Mura S. Masserini M. Couvreur P. Nicolas J. Eur. J. Pharm. Biopharm. 2019;142:70–82. doi: 10.1016/j.ejpb.2019.06.004. [DOI] [PubMed] [Google Scholar]
- Cagliani R. Gatto F. Bardi G. Materials. 2019;12:1991. doi: 10.3390/ma12121991. [DOI] [PMC free article] [PubMed] [Google Scholar]
- Lundqvist M. Stigler J. Elia G. Lynch I. Cedervall T. Dawson K. A. Proc. Natl. Acad. Sci. U. S. A. 2008;105:14265–14270. doi: 10.1073/pnas.0805135105. [DOI] [PMC free article] [PubMed] [Google Scholar]
- Wang H. Ma R. Nienhaus K. Nienhaus G. U. Small. 2019;15:1900974. doi: 10.1002/smll.201900974. [DOI] [PubMed] [Google Scholar]
- Lee H. Small. 2020;16:1906598. [Google Scholar]
- Shao Q. Hall C. K. J. Phys.: Condens. Matter. 2016;28:414019. doi: 10.1088/0953-8984/28/41/414019. [DOI] [PMC free article] [PubMed] [Google Scholar]
- Tavanti F. Pedone A. Menziani M. C. J. Phys. Chem. C. 2015;119:22172–22180. [Google Scholar]
- Ding H. Ma Y. Biomaterials. 2014;35:8703–8710. doi: 10.1016/j.biomaterials.2014.06.033. [DOI] [PubMed] [Google Scholar]
- Lopez H. Lobaskin V. J. Chem. Phys. 2015;143:243138. doi: 10.1063/1.4936908. [DOI] [PubMed] [Google Scholar]
- Brancolini G. Kokh D. B. Calzolai L. Wade R. C. Corni S. ACS Nano. 2012;6:9863–9878. doi: 10.1021/nn303444b. [DOI] [PubMed] [Google Scholar]
- Brancolini G. Bellucci L. Maschio M. C. Di Felice R. Corni S. Curr. Opin. Colloid Interface Sci. 2019;41:86–94. [Google Scholar]
- Kharazian B. Hadipour N. L. Ejtehadi M. R. Int. J. Biochem. Cell Biol. 2016;75:162–174. doi: 10.1016/j.biocel.2016.02.008. [DOI] [PubMed] [Google Scholar]
- Zuo G. Kang S. Xiu P. Zhao Y. Zhou R. Small. 2013;9:1546–1556. doi: 10.1002/smll.201201381. [DOI] [PubMed] [Google Scholar]
- Tavanti F. Pedone A. Menziani M. C. Int. J. Mol. Sci. 2019;20:3539. doi: 10.3390/ijms20143539. [DOI] [PMC free article] [PubMed] [Google Scholar]
- Ding F. Radic S. Chen R. Chen P. Geitner N. K. Brown J. M. Ke P. C. Nanoscale. 2013;5:9162–9169. doi: 10.1039/c3nr02147e. [DOI] [PMC free article] [PubMed] [Google Scholar]
- Bellucci L. Corni S. J. Phys. Chem. C. 2014;118:11357–11364. [Google Scholar]
- Wang L. Li J. Pan J. Jiang X. Ji Y. Li Y. Qu Y. Zhao Y. Wu X. Chen C. J. Am. Chem. Soc. 2013;135:17359–17368. doi: 10.1021/ja406924v. [DOI] [PubMed] [Google Scholar]
- Lu X. Xu P. Ding H. M. Yu Y. S. Huo D. Ma Y. Q. Nat. Commun. 2019;10:1–14. doi: 10.1038/s41467-019-12470-5. [DOI] [PMC free article] [PubMed] [Google Scholar]
- Khan S. Gupta A. Nandi C. K. J. Phys. Chem. Lett. 2013;4:3747–3752. [Google Scholar]
- Vilanova O. Mittag J. J. Kelly P. M. Milani S. Dawson K. A. Rädler J. O. Franzese G. ACS Nano. 2016;10:10842–10850. doi: 10.1021/acsnano.6b04858. [DOI] [PMC free article] [PubMed] [Google Scholar]
- Casals E. Pfaller T. Duschl A. Oostingh G. J. Puntes V. F. Small. 2011;7:3479–3486. doi: 10.1002/smll.201101511. [DOI] [PubMed] [Google Scholar]
- Malaspina D. C. Pérez-Fuentes L. Drummond C. Bastos-González D. Faraudo J. Curr. Opin. Colloid Interface Sci. 2019;41:40–49. [Google Scholar]
- Simonelli F. Rossi G. Monticelli L. J. Phys. Chem. B. 2019;123:1764–1769. doi: 10.1021/acs.jpcb.8b11204. [DOI] [PMC free article] [PubMed] [Google Scholar]
- Rossi G. Barnoud J. Monticelli L. J. Phys. Chem. Lett. 2013;5:241–246. doi: 10.1021/jz402234c. [DOI] [PubMed] [Google Scholar]
- Batista C. A. S. Larson R. G. Kotov N. A. Science. 2015;350:6257. doi: 10.1126/science.1242477. [DOI] [PubMed] [Google Scholar]
- Eckmann D. M. Bradley R. P. Kandy S. K. Patil K. Janmey P. A. Radhakrishnan R. Curr. Opin. Struct. Biol. 2020;64:104–110. doi: 10.1016/j.sbi.2020.06.023. [DOI] [PMC free article] [PubMed] [Google Scholar]
- Payne C. K. J. Chem. Phys. 2019;151:1–8. doi: 10.1063/1.5120178. [DOI] [PubMed] [Google Scholar]
- Ding L. Yao C. Yin X. Li C. Huang Y. Wu M. Wang B. Guo X. Wang Y. Wu M. Small. 2018;14:1801451. doi: 10.1002/smll.201801451. [DOI] [PubMed] [Google Scholar]
- Asati A. Santra S. Kaittanis C. Perez J. M. ACS Nano. 2010;4:5321–5331. doi: 10.1021/nn100816s. [DOI] [PMC free article] [PubMed] [Google Scholar]
- Schaeublin N. M. Braydich-Stolle L. K. Schrand A. M. Miller J. M. Hutchison J. Schlager J. J. Hussain S. M. Nanoscale. 2011;3:410–420. doi: 10.1039/c0nr00478b. [DOI] [PubMed] [Google Scholar]
- Huang K. Boerhan R. Liu C. Jiang G. Mol. Pharm. 2017;14:4618–4327. doi: 10.1021/acs.molpharmaceut.7b00726. [DOI] [PubMed] [Google Scholar]
- Sreedhar A. S. Kalmár É. Csermely P. Shen Y. F. FEBS Lett. 2004;562:11–15. doi: 10.1016/s0014-5793(04)00229-7. [DOI] [PubMed] [Google Scholar]
- Hoter A. El-Sabban M. E. Naim H. Y. Int. J. Mol. Sci. 2018;19:2560. doi: 10.3390/ijms19092560. [DOI] [PMC free article] [PubMed] [Google Scholar]
- Gupte R. Liu Z. Kraus W. L. Genes Dev. 2017;31:101–126. doi: 10.1101/gad.291518.116. [DOI] [PMC free article] [PubMed] [Google Scholar]
- Alemasova E. E. Lavrik O. I. Nucleic Acids Res. 2019;47:3811–3827. doi: 10.1093/nar/gkz120. [DOI] [PMC free article] [PubMed] [Google Scholar]
- Morales J. C. Li L. Fattah F. J. Dong Y. Bey E. A. Patel M. Gao J. Boothman D. A. Crit. Rev. Eukaryotic Gene Expression. 2014;24:15–28. doi: 10.1615/critreveukaryotgeneexpr.2013006875. [DOI] [PMC free article] [PubMed] [Google Scholar]
- Soto Veliz D. Luoto J. C. Pulli I. Toivakka M. Colloids Surf., B. 2018;167:239–251. doi: 10.1016/j.colsurfb.2018.04.013. [DOI] [PubMed] [Google Scholar]
- Ronchi C. Datteo M. Kaviani M. Selli D. Di Valentin C. J. Phys. Chem. C. 2019;123:101130–110144. doi: 10.1021/acs.jpcc.8b04921. [DOI] [PMC free article] [PubMed] [Google Scholar]
- Fazio G. Ferrighi L. Di Valentin C. J. Phys. Chem. C. 2015;119:20735–20746. [Google Scholar]
- Selli D. Fazio G. Di Valentin C. J. Chem. Phys. 2017;147:164701. doi: 10.1063/1.4994165. [DOI] [PubMed] [Google Scholar]
- Siani P. Motta S. Ferraro L. Dohn A. O. Di Valentin C. J. Chem. Theory Comput. 2020;16:6560–6574. doi: 10.1021/acs.jctc.0c00483. [DOI] [PMC free article] [PubMed] [Google Scholar]
- Weiner S. J. Kollman P. A. Singh U. C. Case D. A. Ghio C. Alagona G. Profeta S. Weiner P. J. Am. Chem. Soc. 1984;106:765–784. [Google Scholar]
- McCammon J. A. Wolynes P. G. Karplus M. Biochemistry. 1979;18:927–942. doi: 10.1021/bi00573a001. [DOI] [PubMed] [Google Scholar]
- Thorsell A. G. Ekblad T. Karlberg T. Löw M. Pinto A. F. Trésaugues L. Moche M. Cohen M. S. Schüler H. J. Med. Chem. 2016;60:1262–1271. doi: 10.1021/acs.jmedchem.6b00990. [DOI] [PMC free article] [PubMed] [Google Scholar]
- Obermann W. M. J. Sondermann H. Russo A. A. Pavletich N. P. Hartl F. U. J. Cell Biol. 1998;143:901–910. doi: 10.1083/jcb.143.4.901. [DOI] [PMC free article] [PubMed] [Google Scholar]
- Berman H. M. Westbrook J. Feng Z. Gilliland G. Bhat T. N. Weissig H. Shindyalov I. N. Bourne P. E. Nucleic Acids Res. 2000;28:235–242. doi: 10.1093/nar/28.1.235. [DOI] [PMC free article] [PubMed] [Google Scholar]
- Burley S. K. Bhikadiya C. Bi C. Bittrich S. Chen L. Crichlow G. V. Christie C. H. Dalenberg K. Di Costanzo L. Duarte J. M. Dutta S. Feng Z. Ganesan S. Goodsell D. S. Ghosh S. Green R. K. Guranović V. Guzenko D. Hudson B. P. Lawson C. L. Liang Y. Lowe R. Namkoong H. Peisach E. Persikova I. Randle C. Rose A. Rose Y. Sali A. Segura J. Sekharan M. Shao C. Tao Y.-P. Voigt M. Westbrook J. D. Young J. Y. Zardecki C. Zhuravleva M. Nucleic Acids Res. 2021;49:D437–D451. doi: 10.1093/nar/gkaa1038. [DOI] [PMC free article] [PubMed] [Google Scholar]
- Jo S. Kim T. Iyer V. G. Im W. J. Comput. Chem. 2008;29:1859–1865. doi: 10.1002/jcc.20945. [DOI] [PubMed] [Google Scholar]
- Lee J. Cheng X. Swails J. M. Yeom M. S. Eastman P. K. Lemkul J. A. Wei S. Buckner J. Jeong J. C. Qi Y. Jo S. Pande V. S. Case D. A. Brooks C. L. MacKerell A. D. Klauda J. B. Im W. J. Chem. Theory Comput. 2016;12:405–413. doi: 10.1021/acs.jctc.5b00935. [DOI] [PMC free article] [PubMed] [Google Scholar]
- Søndergaard C. R. Olsson M. H. M. Rostkowski M. Jensen J. H. J. Chem. Theory Comput. 2011;7:2284–2295. doi: 10.1021/ct200133y. [DOI] [PubMed] [Google Scholar]
- Olsson M. H. M. Søndergaard C. R. Rostkowski M. Jensen J. H. J. Chem. Theory Comput. 2011;7:525–537. doi: 10.1021/ct100578z. [DOI] [PubMed] [Google Scholar]
- Huang J. Rauscher S. Nawrocki G. Ran T. Feig M. de Groot B. L. Grubmüller H. MacKerell A. D. Nat. Methods. 2016;14:71–73. doi: 10.1038/nmeth.4067. [DOI] [PMC free article] [PubMed] [Google Scholar]
- Best R. B. Zhu X. Shim J. Lopes P. E. M. Mittal J. Feig M. Alexander J. MacKerell D. J. Chem. Theory Comput. 2012;8:3257–3273. doi: 10.1021/ct300400x. [DOI] [PMC free article] [PubMed] [Google Scholar]
- MacKerell J. A. D. Bashford D. Bellott M. Dunbrack J. R. L. Evanseck J. D. Field M. J. Fischer S. Gao J. Guo H. Ha S. Joseph-McCarthy D. Kuchnir L. Kuczera K. Lau F. T. K. Mattos C. Michnick S. Ngo T. Nguyen D. T. Prodhom B. Reiher W. E. Roux B. Schlenkrich M. Smith J. C. Stote R. Straub J. Watanabe M. Wiórkiewicz-Kuczera J. Yin D. Karplus M. J. Phys. Chem. B. 1998;102:3586–3616. doi: 10.1021/jp973084f. [DOI] [PubMed] [Google Scholar]
- Mackerell A. D. Feig M. Brooks C. L. J. Comput. Chem. 2004;25:1400–1415. doi: 10.1002/jcc.20065. [DOI] [PubMed] [Google Scholar]
- Durell S. R. Brooks B. R. Ben-Naim A. J. Phys. Chem. 1994;98:2198–2202. [Google Scholar]
- Neria E. Fischer S. Karplus M. J. Chem. Phys. 1996;105:1902–1921. [Google Scholar]
- Jorgensen W. L. Chandrasekhar J. Madura J. D. Impey R. W. Klein M. L. J. Chem. Phys. 1983;79:926–935. [Google Scholar]
- Matsui M. Akaogi M. Mol. Simul. 1991;6:239–244. [Google Scholar]
- Brandt E. G. Lyubartsev A. P. J. Phys. Chem. C. 2015;119:18110–18125. [Google Scholar]
- Plimpton S. J. Comput. Phys. 1995;117:1–19. [Google Scholar]
- Hockney R. W. and Eastwood J. W., Computer Simulation Using Particles, CRC Press, Boca Raton, 2021 [Google Scholar]
- Ryckaert J. P. Ciccotti G. Berendsen H. J. C. J. Comput. Phys. 1977;23:327–341. [Google Scholar]
- Zeiske T. Stafford K. A. Friesner R. A. Palmer A. G. Proteins: Struct., Funct., Bioinf. 2013;81:499–509. doi: 10.1002/prot.24209. [DOI] [PMC free article] [PubMed] [Google Scholar]
- El Hage K. Brickel S. Hermelin S. Gaulier G. Schmidt C. Bonacina L. Van Keulen S. C. Bhattacharyya S. Chergui M. Hamm P. Rothlisberger U. Wolf J. P. Meuwly M. Struct. Dyn. 2017;4:061507. doi: 10.1063/1.4996448. [DOI] [PMC free article] [PubMed] [Google Scholar]
- Rycroft C., Voro++: A three-dimensional Voronoi cell library in C++, Lawrence Berkeley National Lab, Berkeley, CA, 2009 [DOI] [PubMed] [Google Scholar]
- Jimenez-Cruz C. A. Kang S. Zhou R. Wiley Interdiscip. Rev.: Syst. Biol. Med. 2014;6:329–343. doi: 10.1002/wsbm.1271. [DOI] [PubMed] [Google Scholar]
- Xu M. Li J. Iwai H. Mei Q. Fujita D. Su H. Chen H. Hanagata N. Sci. Rep. 2012;2:1–6. doi: 10.1038/srep00406. [DOI] [PMC free article] [PubMed] [Google Scholar]
Associated Data
This section collects any data citations, data availability statements, or supplementary materials included in this article.


