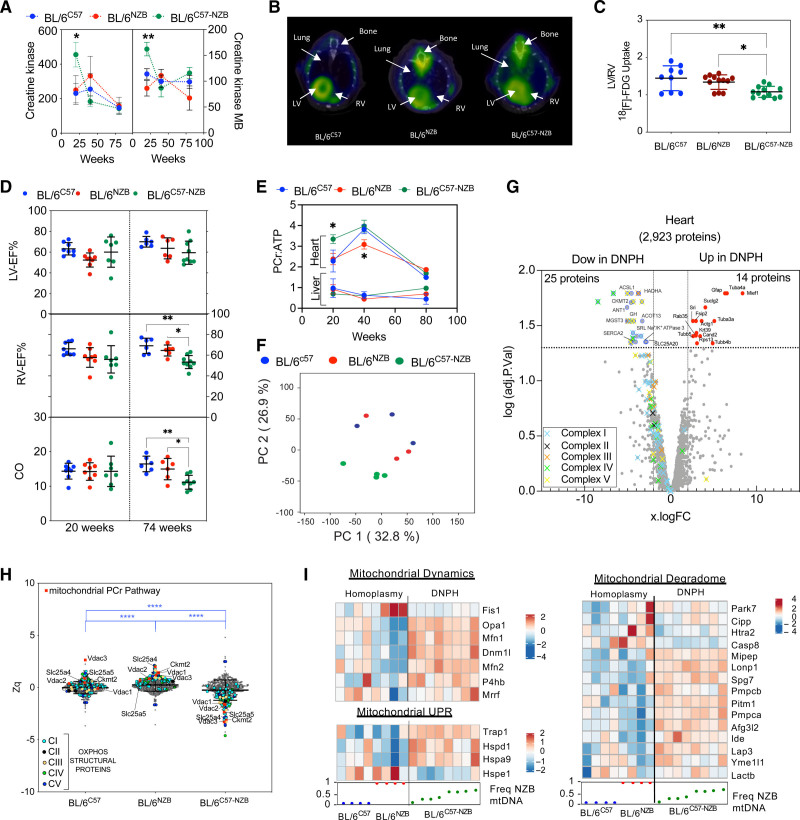
Figure 2.
Divergent nonpathologic mitochondrial DNA heteroplasmy causes cardiac metabolic stress, leading to heart failure. A, Creatine kinase (CK) and CK-MB in plasma (10 homoplasmic animals per indicated age; 12-week-old heteroplasmic mice, n=20; 40- and 80-week-old heteroplasmic mice, n=10). Data from different individuals at different ages given as mean±SEM, 2-way analysis of variance test with Tukey multiple comparation test; *P<0.05, ** P<0.01. B and C, [18F]-fluorodeoxyglucose positron emission tomography–computed tomography cardiac analysis. (B) Representative axial fused positron emission tomography–computed tomography images and (C) quantitative analysis of the increase in relative right ventricle (RV) uptake of the glucose analogue [18F]-fluorodeoxyglucose in 20-week-old homoplasmic and heteroplasmic mice. *P<0.05, **P<0.01 (1-way analysis of variance; 4–5 mice per group). D, Magnetic resonance imaging analysis of heart function in 20- or 74-week-old male mice of the indicated strains. Each dot represents an individual mouse. *P<0.05, **P<0.01 (1-way analysis of variance). E, Longitudinal 31P magnetic resonance spectroscopy analysis of the phosphocreatine (PCr):ATP (adenosine triphosphate) ratio in heart and liver of the indicated mouse strain. *P<0.05 (2-way analysis of variance test with Tukey multiple comparation test; n=3–8). F through H, Heart proteomic analyses in 12-week-old mice. F, Score plot of the principal component (PC) analysis of the heart proteome. Each dot represents an individual mouse. G, Volcano plot illustrating proteins with significantly differential abundance between homoplasmic and heteroplasmic hearts (3 homoplasmic and 4 heteroplasmic heart samples). The log (adjusted P value) is plotted against the log fold change (logFC; fold difference between homoplasmic and heteroplasmic mice); 25 proteins are significantly underrepresented and 14 are significantly overrepresented. On the x axis, vertical lines denote ±2-fold change; on the y axis, the horizontal line denotes the significance threshold (P<0.05 before logarithmic transformation). H, Quantitative MitoProteome analysis highlighting structural oxidative phosphorylation (OXPHOS) components and mitochondrial elements of the PCr pathway. Zq indicates standardized log2 ratios of the indicated proteins: ACSL1 (acyl–coenzyme A synthetase long chain family member 1), SLC25A20 (carnitine/acylcarnitine translocase), HADHA (hydroxyacyl–coenzyme A dehydrogenase trifunctional multienzyme subunit alpha), and ACOT13 (hydroxyacyl–coenzyme A dehydrogenase trifunctional multienzyme subunit alpha). Of the 5 nonmitochondrial reduced proteins, 3 were highly involved in cellular ATP-consuming processes (SERCA2 [sarcoplasmic/endoplasmic reticulum calcium ATPase 2] and SRL [sarcalumenin] in Ca2+ transport and ATP1A3 [sodium–potassium ATPase catalytic subunit α3]) and 2 in signaling (GH [growth hormone] and MGST3 [microsomal glutathione S-transferase 3]). ****P<0.0001 (1-way analysis of variance; 3 homoplasmic and 4 heteroplasmic mice). I, logFC heat maps of mitochondrial dynamics, unfolded protein (UPR), and mitochondrial degradome in divergent nonpathologic heteroplasmy cardiac tissue. RNA sequencing data analysis of 12-week-old homoplasmic and heteroplasmic hearts. CO indicates cardiac output; DNPH, divergent nonpathologic heteroplasmy; LV, left ventricle; LV-EF, left ventricular ejection fraction; mtDNA, mitochondrial DNA; and RV-EF, right ventricular ejection fraction.

