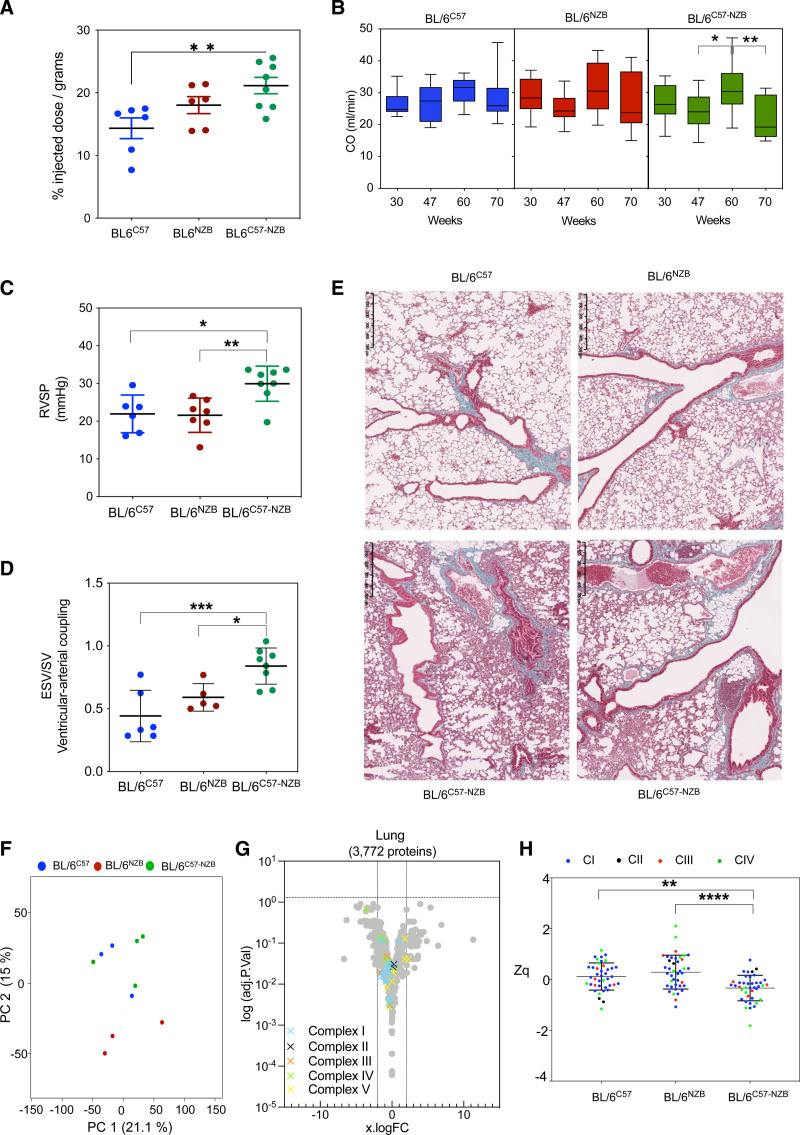
Figure 4.
Divergent nonpathologic mitochondrial DNA heteroplasmy causes pulmonary hypertension. A, Ex vivo quantitative analysis of [18F]-fluorodeoxyglucose uptake in lung tissue of 20-week-old mice (6 homoplasmic mice and 8 heteroplasmic mice; *P<0.05, 1-way analysis of variance test). B, In vivo longitudinal echocardiography study of cardiac output (CO) assessed in the aorta. Data represented as mean±SD. *P<0.05, **P<0.01, 2-way analysis of variance test with Tukey multiple comparison test (12–14 mice per genotype and age). C, In vivo measurement for the right ventricular systolic pressure volume (RVSP) after right ventricle catheterization in 74-week-old mice. Each dot represents an individual mouse. D, Magnetic resonance imaging assessment of the right ventricular–-arterial coupling (end systolic volume/stroke volume [ESV/SV]) in 74-week-old mice. Each dot represents an individual mouse. *P<0.05, **P<0.01, 1-way analysis of variance test. E, Representative lung histologic sections from 80-week-old homoplasmic and heteroplasmic mice stained with Masson trichrome staining (4–5 mice per genotype). F through H, Lung proteomic analysis in 12-week-old mice. F, Principal component (PC) analysis. Each dot corresponds to an individual mouse. G, Volcano plot illustrating proteins with significantly differential abundance between homoplasmic and heteroplasmic lung tissues (4 homoplasmic mice and 5 heteroplasmic mice). The log (adjusted P value) is plotted against the log fold change (logFC; fold difference between homoplasmic and heteroplasmic mice). On the x axis, vertical lines denote ±2-fold change; on the y axis, the horizontal line denotes the significance threshold (P<0.05). H, Expression analysis of structural oxidative phosphorylation components. Data are presented as mean±SD. **P<0.01, ****P<0.0001 (1-way analysis of variance test).

