

Abstract
Introduction:
Reducing sugar-sweetened beverage consumption through taxation is a promising public health response to the obesity epidemic in the U.S. This study quantifies the expected health and economic benefits of a national sugar-sweetened beverage excise tax of $0.01/ounce over 10 years.
Methods:
A cohort model was used to simulate the impact of the tax on BMI. Assuming ongoing implementation and effect maintenance, quality–adjusted life years gained and disability–adjusted life years and healthcare costs averted were estimated over the 2015–2025 period for the 2015 U.S. population. Costs and health gains were discounted at 3% annually. Data were analyzed in 2014.
Results:
Implementing the tax nationally would cost $51 million in the first year. The tax would reduce sugar-sweetened beverage consumption by 20% and mean BMI by 0.16 (95% uncertainty interval [UI]=0.06, 0.37) units among youth and 0.08 (95% UI=0.03, 0.20) units among adults in the second year for a cost of $3.16 (95% UI=$1.24, $8.14) per BMI unit reduced. From 2015 to 2025, the policy would avert 101,000 disability-adjusted life years (95% UI=34,800, 249,000), gain 871,000 quality-adjusted life years (95% UI=342,000, 2,030,000), and result in $23.6 billion (95% UI=$9.33 billion, $54.9 billion) in healthcare cost savings. The tax would generate $12.5 billion in annual revenue (95% UI=$8.92, billion, $14.1 billion).
Conclusions:
The proposed tax could substantially reduce BMI and healthcare expenditures and increase healthy life expectancy. Concerns regarding the potentially regressive tax may be addressed by reduced obesity disparities and progressive earmarking of tax revenue for health promotion.
Introduction
Although consumption has declined in recent years, children and adults in the U.S. consume twice as many calories from sugar-sweetened beverages (SSBs) compared to 30 years ago.1–4 Observational studies and RCTs have linked SSB consumption to excess weight gain, diabetes, and cardiovascular disease.5 Consumption of SSBs increases the risk of chronic diseases through its impact on BMI and other mechanisms.5, 6 The Dietary Guidelines for Americans, 20107 recommend that individuals reduce intake of SSBs in order to manage their body weight.
Drawing on the success of tobacco taxation and decades of economic research,8–10 public health experts have called for higher taxes on unhealthy food and beverages.9, 11 In 2009, the IOM recommended that local governments implement tax strategies to reduce consumption of “calorie-dense, nutrient-poor foods,” emphasizing SSBs as an appropriate target for taxation.12 As of January 2014, a total of 34 states applied a sales tax on carbonated beverages, with an average tax rate of 5.2%.13 In 2013, one city and 12 states considered legislation to increase SSB taxes, although none passed.14 The city of Berkeley, California, became the first city to pass a $0.01/ounce SSB excise tax in November 2014.15 Although large SSB excise taxes have not been implemented in the U.S., other countries have implemented them, albeit generally of smaller size.16 Mexico implemented a 1 peso/liter excise tax on SSBs in January 2014, which preliminary analyses suggest resulted in a 10% reduction in SSB purchases.17
Although evidence regarding the empirical associations among beverage prices, the current low tax rates, consumption, and BMI has been mixed,9, 18–20 a number of studies have found that higher beverage taxes and prices are linked to significantly lower BMI.18, 21–23 Moreover, recently proposed tax strategies differ in many ways from existing sales taxes. First, they would be implemented as per-volume, or specific excise taxes, which provide more visible and consistent price signals to consumers through incorporation into shelf prices.24 Excise taxes are generally imposed on the manufacturers, in contrast to sales taxes that are collected from the consumer at purchase.25 Specific excise taxes, as opposed to ad valorem excise taxes, are imposed on the volume produced or distributed instead of on the sales price. Second, they exclude diet soft drinks included in many current sales taxes.18 Third, current sales taxes often apply only to a subset of SSBs, such as carbonated sodas, which excludes important categories of SSB intake such as sports drinks and fruit drinks. Most importantly, the proposed excise tax of $0.01/ounce of SSBs would result in a 16% price increase, substantially higher than current tax rates.
Building on previous analyses,26–29 this is the first study to estimate the cost effectiveness of implementing a $0.01/ounce SSB excise tax in the U.S. by estimating both the cost and impact of the change in BMI on reduction in healthcare expenditures, life years lost, disability–adjusted life years (DALYs) averted, and quality–adjusted life years (QALYs) gained. The policy, political, and ethical implications of this economic evaluation are systematically situated within the broader debate in the U.S. over policy approaches to curb the obesity epidemic.
Methods
A national specific excise tax of $0.01/ounce of SSBs was modeled based on recent proposals under consideration by federal, state, and local governments (SSBs include all beverages with added caloric sweeteners as defined in the Appendix).30–32 The intervention was modeled as an additional tax over and above existing sales and excise tax rates (adjusted for inflation annually). The excise tax does not apply to 100% juice, milk products, or artificially sweetened beverages. The comparator for this intervention was current practice. Baseline consumption of SSBs, milk, and juice was estimated by age group and gender from the 2011–2012 National Health and Nutrition Examination Survey (NHANES), taking into account sampling weights and the clustered sampling design (Table 1).3 Average daily consumption of SSBs was 150 kcal/day.
Table 1.
U.S. Beverage Consumption (kcal/day) and Expected Changes From an SSB Excise Tax
| 2011-2012 Beverage Consumption (kcal/d) | Expected change in consumption (kcal/d) in response to SSB excise tax a | |||||||||||||
|---|---|---|---|---|---|---|---|---|---|---|---|---|---|---|
|
| ||||||||||||||
| Male | Female | Male | Female | |||||||||||
|
| ||||||||||||||
| Age (years) | SSB | Milk | Juice | SSB | Milk | Juice | SSB | Milk | Juice | Net Change | SSB | Milk | Juice | Net Change |
| 2-4 | 58 | 231 | 89 | 66 | 191 | 64 | −11 | 6 | 10 | 4 | −13 | 5 | 7 | −1 |
| 5-9 | 136 | 194 | 51 | 104 | 152 | 38 | −27 | 5 | 6 | −16 | −21 | 4 | 4 | −13 |
| 10-14 | 188 | 170 | 29 | 149 | 123 | 30 | −37 | 4 | 3 | −30 | −30 | 3 | 3 | −23 |
| 15-19 | 266 | 150 | 53 | 197 | 75 | 35 | −53 | 4 | 6 | −43 | −39 | 2 | 4 | −33 |
| 20-29 | 273 | 59 | 36 | 182 | 45 | 36 | −54 | 1 | 4 | −49 | −36 | 1 | 4 | −31 |
| 30-39 | 235 | 71 | 42 | 152 | 63 | 23 | −47 | 2 | 5 | −40 | −30 | 2 | 3 | −26 |
| 40-49 | 201 | 80 | 19 | 151 | 52 | 26 | −40 | 2 | 2 | −36 | −30 | 1 | 3 | −26 |
| 50-59 | 160 | 79 | 39 | 95 | 48 | 19 | −32 | 2 | 4 | −25 | −19 | 1 | 2 | −15 |
| 60-69 | 106 | 84 | 51 | 59 | 56 | 20 | −21 | 2 | 6 | −13 | −12 | 1 | 2 | −8 |
| 70-79 | 74 | 75 | 31 | 65 | 77 | 29 | −15 | 2 | 4 | −9 | −13 | 2 | 3 | −8 |
| 80+ | 68 | 89 | 38 | 29 | 92 | 37 | −14 | 2 | 4 | −7 | −6 | 2 | 4 | 1 |
kcal/d, kilocalories per day; NHANES, National Health and Nutrition Examination Survey; Net Change, Change in total calorie intake from beverages per day; SSB, sugar-sweetened beverage;
Mean change from Scenario 3 in SSB, juice, milk and total energy intake from model simulation based on NHANES 2011-2012 consumption data, 16% SSB price increase resulting from excise tax, own-price elasticity for SSBs and cross-price elasticities for milk and juice. Rows may not sum due to rounding.
Modeling Framework
This analysis was based on a modeling framework developed by collaborating researchers from the Harvard School of Public Health, Columbia Mailman School of Public Health, Deakin University, and University of Queensland in Australia. The current model adapted the Australian Assessing Cost-Effectiveness (ACE)-Obesity33, 34 and ACE-Prevention35 framework to the U.S. context and followed the reporting recommendations from the U.S. Panel on Cost-Effectiveness in Health and Medicine.36 Health gains expected from the tax, including changes in BMI, reductions in disease burden and healthcare expenditures, DALYs averted, and QALYs gained over 10 years were estimated using a Markov cohort model. The model was based on a spreadsheet developed for ACE Prevention replicated in a compiled programming language (JAVA) using U.S. inputs for population characteristics, disease burden, and healthcare costs. The model simulated the 2015 U.S. population aged ≥2 years at baseline and followed them for 10 years until death or age 100 years. Based on estimated changes in population mean BMI and obesity rates for each 5-year age and gender group as a result of the intervention, the model predicted downstream changes in stroke, ischemic heart disease, hypertensive heart disease, diabetes mellitus, osteoarthritis, post-menopausal breast cancer, colon cancer, endometrial cancer, and kidney cancer—major diseases that have been linked to obesity. The model then estimated the resulting difference in life expectancy and disability-adjusted life expectancy of the cohort under the no-intervention and intervention scenario. QALYs gained were estimated based on shifts in overweight and obesity prevalence using published estimates of the relationship between BMI and QALYs by age and sex for adults.37
The model also estimated differences in healthcare expenditures with and without the intervention based on differences in healthcare costs among children and adults with and without obesity.38 These healthcare costs were based on analyses of the Medical Expenditure Panel Survey and are reported as net present value discounted at 3% per year. Additional details on the modeling framework are reported in the overview paper by Gortmaker et al.39
In addition, key implementation and equity considerations34 relevant to policymakers and consumers were qualitatively evaluated by a stakeholder group including U.S. policymakers, policy researchers, nutrition and physical activity researchers, and programmatic experts. The following implementation considerations were considered: level of evidence, equity, acceptability, feasibility, sustainability, side effects, and social and policy norms.
Assessment of Benefit
Based on beverage price data from Powell and colleagues,40 the proposed tax of $0.01/ounce in 2014 dollars would increase prices by approximately 16% (Appendix). The price-induced change in SSB consumption was calculated based on a review of beverage demand elasticity by Powell et al.,41 which reported an average soft drink own-price elasticity of −1.21 (range, −0.69 to −3.87). Change in BMI from reducing SSB consumption in response to the estimated tax-induced price change was based on four large studies in adults42–45 (0.21–0.57 BMI units/12-ounce serving), and a recent double-blind, placebo-controlled trial in youth46 (1.01 kg/8-ounce serving). Using observed change in BMI from reductions in SSB intake inclusive of all dietary and physical activity changes, these studies incorporated substitution for all other foods and beverages as well as any changes in physical activity. To account for the time lag in weight change following changes in energy balance,47 no benefits of BMI reduction were estimated during the first year of intervention. The benefits of the full effect of the intervention on BMI were modeled in Years 2–10. With sustained tax implementation over the 10-year period, the tax was assumed to result in sustained reductions in SSB intake and BMI at the population level. Additional detail on the logic model linking the tax to changes in BMI is in the Appendix.
Costs of Intervention
The cost of implementing the proposed tax was estimated from a societal perspective (i.e., taking into account costs and benefits for all members of society) for the 2015–2025 period for the 2015 U.S. population using administrative data from two states operating soft drink excise taxes (West Virginia and Washington) (Appendix Table 5). The costs and labor associated with tax compliance by the beverage industry were assumed to be equal to the cost of administration reported by the government. We did not identify any literature on the cost of compliance with excise taxes. However, parallel evidence regarding costs of administration and compliance with sales taxes, which are expected to be more expensive to administer than the SSB excise tax given the limited number of bottlers and distributors in each state, supports the assumption that costs of administration and compliance are equivalent. A 2006 study found that large retailers (similar to bottlers and distributors subject to the proposed excise tax) reported compliance costs for sales taxes equal to 1% of tax collected excluding credit card fees and unrecovered taxes.48 As a comparison, the California State Board of Equalization responsible for collecting sales taxes reported administrative costs of 0.95% of sales tax revenue in 2012–2013.49 Although tax revenues were not part of the economic analysis because they are transfer payments with no net impact on societal costs,50 expected annual revenue was calculated from the tax to inform the ongoing policy debate.
Cost-Effectiveness Analysis
Short-term cost effectiveness was estimated in terms of cost per BMI unit reduced over 2 years. We estimated cost per BMI based on the national cost of implementation over 2 years divided by either total BMI units reduced for the overall population, or by only the effects in youth. BMI-related health benefits and healthcare cost reductions were also estimated over 10 years, with no benefits estimated during the first year of implementation. The incremental cost-effectiveness ratios were calculated by dividing the difference in net costs by the difference in net effectiveness, comparing the intervention with the control scenarios using cost per BMI unit reduced, cost per life-year (LY) saved, cost per DALY averted, and cost per QALY gained.
Sensitivity Analyses
Probabilistic sensitivity analyses were conducted by simultaneously sampling all parameter values from predetermined distributions using Monte Carlo simulations (Table 2). Means and 95% uncertainty intervals (UIs) for BMI effects and implementation costs were reported based on 10,000 iterations of the model using @Risk, version 6. Impacts on healthcare cost savings, LYs, DALYs, and QALYs were estimated based on 1 million iterations of the model developed in a compiled programming language. Data were analyzed in 2014.
Table 2.
Key Model Variables: Mean Values and 95% Uncertainty Intervals
| Parameters | Mean Value | 95% Uncertainty Interval | Sources and Modeling Parameters |
|---|---|---|---|
| Change in SSB Consumption and BMI | |||
| Daily intake of SSB, juice, and milk | See Appendix Table 2 | See Appendix Table 2 for s.e.m. | Samples drawn from a normal distribution based on age- and gender-specific mean and standard error from NHANES 2011-2012 |
| Own-price elasticity of demand for SSB | 1.22 | (0.70; 2.63) | Samples drawn from an exponential distribution (β=0.5251, Shift=0.6892) fitted to absolute value of weighted frequency of twelve estimates included in a review by Powell et al. with mean=1.21 and range=0.69-3.87. 41 |
| Δ in SSB consumption (8oz/day) to Δweight (kg) in youth (2-19 years of age) | 1.01 | (0.48; 1.54) | Samples drawn from a normal distribution (mean=1.01, SD=0.27) based on the mean and standard error from a RCT by de Ruyter et al.46 |
| Δ in SSB consumption (12oz/day) to Δ BMI (kg/m2) in adults (>19 years of age) | 0.39 | (0.22; 0.56) | Samples drawn from a uniform distribution (min=0.21, max=0.57) based on four studies.42–45 |
| Cost of Implementing SSB Excise Tax | |||
| Government/Industry administration and compliance time costs per million people per year (FTE) | 0.32 | (0.10; 0.54) | Samples drawn from a uniform distribution (min=0.09, max=0.55) based on data from personal communications with Washington and West Virginia State Departments of Revenue. See Appendix for more detail. |
| Government/Industry field audit time costs per million people per year (FTE) | 0.30 | (0.24; 0.35) | Samples drawn from a beta distribution (min=0.223, most likely=0.297, max=0.371) based on an estimate of field audit time (+/25%) from a personal communication with West Virginia State Department of Revenue. |
| Field audit direct costs per million people per year ($) | 9,170 | (6,450; 11,900) | Samples drawn from a gamma distribution (5th percentile=$6,871; 50th percentile=$9,161; 95th percentile=$11,460) based on an estimate of field audit direct cost (+/25%) from a personal communication with West Virginia State Department of Revenue. |
| Tax certification system operating costs per million people per year ($) | 11,900 | (8,360; 15,400) | Samples drawn from a gamma distribution (5th percentile=$8,899; 50th percentile=$11,865; 95th percentile =$14,844) based on an estimate of tax certification operating costs (+/ 25%) from a personal communication with West Virginia State Department of Revenue. |
| Department of Revenue Officer salary ($) (+56% non-salary benefits) | 89,500 | N/A | Mean annual salaries from the U.S. Bureau of Labor Statistics 2013 salary for Occupation 13-2081: Tax examiners, collectors, and revenue agents plus 56% non-salary benefits. |
| Industry Auditor salary ($) (+43% non-salary benefits) | 106,000 | N/A | Mean annual salaries from the U.S. Bureau of Labor Statistics 2013 salary for Occupation 13-2011: Accountants and auditors plus 43% non-salary benefits. |
KG, Kilogram; FTE, Full-time equivalent; NHANES, National Health and Nutrition Examination Survey; SSB, Sugar-sweetened beverage
95% Uncertainty Interval based on 10,000 simulations drawn from parameter-specific distributions.
Model uncertainty was assessed by modifying the primary scenario with alternative logic pathways. In the primary scenario, BMI changes from reduced SSB consumption were modeled directly based on a review of the literature. In secondary and tertiary scenarios, expected BMI effects were estimated through change in total energy intake based on work by Hall and colleagues.47, 51 In the secondary scenario, change in total energy intake from a reduction in SSB consumption was estimated based on crossover feeding trials and observational studies of diet and energy intake, which accounted for any substitution to other foods and beverages but did not incorporate changes in physical activity or longer-term substitution patterns captured in the primary scenario. In the tertiary scenario, changes in total energy intake were estimated based on cross-price elasticities for milk and juice identified in a recent review.41 This approach explicitly modeled potential substitution to other caloric beverages. Inputs for the two alternative scenarios are discussed in the Appendix.
Additional sensitivity analyses were conducted (Appendix). The assumed tax “pass-through” rates varied from 50% to 150%, in which beverage companies may decide to raise the price of SSBs by less or more than the cost of the imposed tax. The lowest own-price elasticity from the systematic review by Powell et al.41 was used (−0.69) to estimate the lower bound of predicted change in consumption. An alternative program cost assumption was tested based on previous tobacco excise tax implementation (3% of tax revenue).52
Results
Implementing a national excise tax of $0.01/ounce of SSBs was estimated to cause a 20% (95% UI=11%, 43%) reduction in baseline consumption. For men aged 20–29 years, the group with the highest consumption level, consumption of SSBs would decrease from 273 kcal/day to 219 kcal/day (Table 1). At full effect, this change would reduce BMI by an average of 0.08 (95% UI=0.03, 0.20) kg/m2 among adults and 0.16 (95% UI=0.06, 0.37) kg/m2 among youth (Table 3), and lead to an estimated 0.99% decrease in obesity prevalence among adults (obesity defined as BMI ≥30) and a 1.38% decrease among youth (obesity defined as ≥95th percentile of age- and sex-specific BMI).53, 54 The intervention would cost $51 million the first year and $430 million (95% UI=307 million, 552 million) over 10 years of implementation. Over the first 2 years, the intervention would cost $3.16 (95% UI=$1.24, $8.14) per BMI unit reduced across the entire population, or $8.54 (95% UI=$3.33, $24.2) per BMI unit reduced among youth, assuming full costs of implementation but only considering benefits in youth.55
Table 3.
Mean Cost-Effectiveness Results With 95% Uncertainty Intervals
| Total population reached (millions) | 313 |
| First-year intervention cost ($ millions) | 51.0 (36.4; 65.5) |
| Ten-year intervention cost ($ millions) | 430 (307; 552) |
| Annual revenue ($ billions) | 12.5 (8.92; 14.1) |
|
| |
| Short-term Outcomes | |
|
| |
| Mean per capita BMI unit reduction for adults >19 years of age) | 0.08 (0.03; 0.20) |
| Mean per capita BMI unit reduction for youth 2-19 years of age | 0.16 (0.06; 0.37) |
| Total BMI units reduced (millions) | 31.7 (12.7; 74.3) |
| Total BMI units reduced (millions) (youth only) | 11.7 (4.21; 27.7) |
| Cost per BMI unit reduceda ($) (overall) | 3.16 (1.24; 8.14) |
| Cost per BMI unit reduced ($) (youth only) | 8.54 (3.33; 24.2) |
|
| |
| Ten-Year Outcomes | |
|
| |
| Total LYs saved (thousands) | 32.3 (11.1; 80.1) |
| Total DALYsb averted (thousands) | 101 (34.8; 249) |
| Total QALYsb gained (thousands) | 871 (342; 2,030) |
| Healthcare costsc ($ billions) | −23.6 (−54.9; −9.33) |
| Net costsd ($ billions) | −23.2 (−54.5; −8.88) |
| Healthcare cost savings per $ intervention cost ($) | 55.0 (21.0; 140) |
| Net cost per LY savede ($) | Cost-savingf |
| Net cost per DALY avertede ($) | Cost-savingf |
| Net cost per QALY gainede ($) | Cost-savingf |
DALYs, Disability-adjusted Life Years; QALYs, Quality-adjusted Life Years; Dollars, 2014 U.S. dollars; LY, Life years
Cost per BMI unit reduced based on two years of cost of implementation and total BMI reduction for all ages in the 2015 cohort or for youth only.
DALYs averted and QALYs increased due to the proposed intervention are calculated as the difference in the simulated disability-adjusted years of life lived over ten years in the intervention cohort compared to the baseline cohort of the U.S. population (>1 year of age) in 2015.
The reduction in health care costs refers to the simulated difference in ten-year healthcare costs due to the intervention for a baseline cohort of the U.S. population in 2015. Healthcare costs and health effects are estimated annually and are reported as present value in July 2014 dollars discounted at 3% annually.
Net costs include total implementation costs and healthcare cost savings over ten years.
Values are calculated as the ratio of mean incremental costs over LYs saved, DALYs averted, and QALs increased in the intervention scenario compared to the no-intervention scenario, with the mean and 95% uncertainty intervals reported from ten thousand iterations of the @Risk BMI simulation model and one million iterations of the BMI-to-DALY/QALY simulation.
Interventions are considered “Cost-saving,” and summary statistics are not calculated when they result in both a cost savings and a reduction in DALYs or an increase in QALYs.55
Over the 2015–2025 period, for the 2015 U.S. population the intervention would save 32,300 (95% UI=11,100, 80,100) LYs, avert 101,000 (95% UI=34,800, 249,000) DALYs, and lead to 871,000 (95% UI=342,000, 2,030,000) QALYs gained. The reductions in BMI would result in a mean estimated $23.6 billion (95% UI=$9.33 billion, $54.9 billion) reduction in total healthcare costs over 10 years for the 2015 cohort. For every dollar invested, the intervention would result in $55.0 (95% UI=$21.0, $140.0) in healthcare cost savings. The intervention was “cost saving,” as it would result in both savings in DALYs or increase in QALYs and reduction in total costs compared to current practice. The proposed intervention would remain cost saving across a wide range of input parameter values (Table 4). The tax was estimated to be cost saving across all scenarios beginning in Year 2.
Table 4.
Mean Sensitivity Analyses Results With 95% Uncertainty Intervals
| Secondary scenario: Impact on BMI based on TEI studies | Tertiary scenario: Impact on BMI based on beverage substitution | Costs as 3% of annual tax revenue | 50% Tax pass-through ratef | 150% Tax pass-through ratef | Lowest identified own-price elasticity | |
|---|---|---|---|---|---|---|
| Total population reached (millions) | 313 | 313 | 313 | 313 | 313 | 313 |
| First-year intervention cost ($ millions) | 51.0 (36.4; 65.5) | 51.0 (36.4; 65.5) | 375 (268; 422) | 51.0 (36.4; 65.5) | 51.0 (36.4; 65.5) | 51.0 (36.4; 65.5) |
| Ten-year intervention cost ($ millions) | 430 (307; 552) | 430 (307; 552) | 3,170 (2,250; 3,560) | 430 (307; 552) | 430 (307; 552) | 430 (307; 552) |
|
| ||||||
| Short-term Outcomes | ||||||
|
| ||||||
| Mean per capita BMI unit reduction for adults >19 years of age | 0.38 (0.18; 0.84) | 0.35 (0.15; 0.83) | 0.08 (0.03; 0.20) | 0.04 (0.02; 0.10) | 0.13 (0.05; 0.30) | 0.05 (0.03; 0.07) |
| Mean per capita BMI unit reduction for youth 2-19 years of age | 0.62 (0.30; 1.40) | 0.27 (0.06; 0.73) | 0.16 (0.06; 0.37) | 0.08 (0.03; 0.19) | 0.24 (0.09; 0.56) | 0.09 (0.04; 0.14) |
| Total BMI units reduced (millions) | 135 (66.1; 302) | 102 (41.7; 250) | 31.7 (12.7; 74.3) | 15.8 (6.37; 37.2) | 47.5 (19.1; 111) | 18.0 (9.97; 26.0) |
| Cost per BMI unit reduceda ($) | 0.74 (0.30; 1.64) | 0.98 (0.37; 2.55) | 23.3 (7.2; 63.1) | 6.31 (2.48; 16.3) | 2.10 (0.83; 5.42) | 5.56 (3.23; 10.74) |
|
| ||||||
| Ten-year Outcomes | ||||||
|
| ||||||
| Total LYs saved (thousands) | 126 (54.4; 290) | 114 (32.2; 317) | 32.3 (11.1; 80.1) | 16.2 (5.55; 40.2) | 48.3 (16.6; 120) | 18.4 (8.45; 31.6) |
| Total DALYs avertedb (thousands) | 393 (172; 895) | 401 (127; 1,060) | 101 (34.8; 249) | 50.5 (17.4; 125) | 151 (52.2; 372) | 57.2 (26.6; 97.9) |
| Total QALYs gainedb (thousands) | 2,160 (1,050; 4,770) | 1,890 (834; 4,530) | 871 (342; 2,030) | 438 (171; 1,020) | 1,300 (513; 3,020) | 496 (281; 716) |
| Healthcare Costsc ($ billions) | −57.1 (−127; −27.8) | −47.5 (−116; −19.5) | −23.6 (−54.9; −9.33) | −11.9 (−27.7; −4.67) | −35.3 (−81.7; −14.0) | −13.5 (−19.4; −7.61) |
| Net costsd ($ billions) | −56.7 (−126; −27.3) | −47.0 (−116; −19.1) | −20.5 (−52.6; −5.86) | −11.4 (−27.3; −4.23) | −34.9 (−81.3; −13.5) | −13.0 (−19.0; −7.19 |
| Healthcare cost savings per $ intervention cost ($) | 133 (59.6; 319) | 110 (42.6; 294) | 7.46 (2.69; 23.8) | 27.6 (10.5; 70.4) | 82.1 (31.4; 208) | 31.3 (16.1; 54.5) |
| Net cost per LY saved ($) | Cost-savinge | Cost-savinge | Cost-savinge | Cost-savinge | Cost-savinge | Cost-savinge |
| Net cost per DALY averted ($) | Cost-savinge | Cost-savinge | Cost-savinge | Cost-savinge | Cost-savinge | Cost-savinge |
| Net cost per QALY gained ($) | Cost-savinge | Cost-savinge | Cost-savinge | Cost-savinge | Cost-savinge | Cost-savinge |
DALYs, Disability-adjusted Life Years; Dollars, July 2014 U.S. dollars; LYs, Life-years; TEI, Total Energy Intake
Cost per BMI unit reduced based on two year of cost of implementation and total BMI reduction for all ages in the 2015 cohort.
DALYs averted and QALYs gained due to the proposed intervention are calculated as the difference in the simulated health-adjusted years of life lived in the intervention cohort over ten years compared to the baseline cohort of the United States population >1 year of age in 2015.
The reduction in health care costs refers to the simulated difference in ten-year healthcare costs due to the intervention for a baseline cohort of the U.S. population in 2015. Healthcare costs and health effects are estimated annually and are reported as present value in July 2014 dollars discounted at 3% annually.
Net costs include total implementation costs and healthcare cost savings over ten years.
Interventions are considered “Cost-saving,” and summary statistics are not calculated when they result in both a cost savings and a reduction in DALYs or an gain in QALYs55
Pass-through rates refer to the proportion of the total value of the imposed excise tax incorporated into the price paid by consumers.81
Although not considered a benefit in our cost-effectiveness analyses, from the government’s perspective, the national excise tax would generate an estimated $12.5 billion (95% UI=$8.92 billion, $14.1 billion) in annual revenue in 2014 dollars, or $12.48 billion net revenue.
A summary of stakeholder discussions regarding implementation and equity considerations is presented in Table 5.56–59 The stakeholders placed significant weight on the potential of the intervention to shift public awareness and social and policy norms leading to healthier beverage intake. Stakeholders emphasized that the proposed intervention would also lead to substantial additional reductions in diabetes, heart disease, and dental disease not modeled in this study.6, 60–62 However, the tax could lead to a backlash against public health intervention due to current anti-tax sentiment in the U.S.63
Table 5.
Implementation and Equity Considerations
| Level of evidence | Equity | Acceptability to stakeholders | Feasibility | Sustainability | Side effects | Social and policy norms |
|---|---|---|---|---|---|---|
| Strong evidence for change in BMI/weight from change in sugar-sweetened beverage (SSB) consumption | Some concerns regarding regressive nature of tax | Opposition from beverage industry spending >$4 billion/year on marketing56 | Beverage excise taxes currently applied at state level with limited difficulty | Likely to be sustainable if implemented based on history of tobacco excise taxes | Positive: Reduction in diabetes, dental caries, and improved bone health in addition to impact on BMI | Substantial potential for shift in social norms based on evidence from tobacco control tax and regulatory efforts57, 59 |
| Strong evidence of price elasticity of demand from a systematic review | Substantial health benefits accrue to low-income consumers | Public support for tax mixed, but increases with earmarking for prevention58 | ||||
| Parallel evidence from tobacco excise tax history | Progressive use of earmarking counteracts regressive tax | Mixed policymaker response due to opposition to taxes and need for revenue | Revenue can be earmarked towards obesity prevention | |||
|
| ||||||
| Decision Point: | ||||||
| Sufficient evidence of effectiveness | Concerns outweighed by revenue earmarking and health impact | Marginally acceptable to public and some policy makers but opposed by industry | Feasible | Sustainable if implemented | Substantial benefits, limited concerns | Strong potential benefit |
Political Considerations: Although the intervention is cost saving and would likely have a large societal impact, increasing taxes in the current political environment against strong industry opposition remains a challenge in many localities.
Discussion
This is the first cost-effectiveness analysis of an excise tax on SSBs as a tool for reducing BMI, healthcare costs, health burden, and excess mortality in the U.S. In the short term, the policy is estimated to be a low-cost strategy to achieve small but meaningful reductions in BMI in both adults and children. Implementing the proposed tax would likely be cost saving to address the obesity epidemic while also generating substantial revenue that could be used for health promotion.
Some researchers have argued that individuals could compensate for a tax by increasing consumption of other food and beverages, thus entirely offsetting the caloric benefit of reducing SSB intake.18, 20 Conversely, another simulation study assumed that tax-induced reductions in SSB intake will not result in any caloric compensation.64 The empirical association between SSB prices (included tax-driven price changes) and BMI supporting this argument is inconsistent. One repeated cross-sectional study estimated a significant 0.003 BMI unit reduction per 1% increase in soft drink tax rates, which would lead to an estimated reduction of 0.05 BMI units from a 16% tax, near the lower bound of the uncertainty interval in this study.18 In a repeated cross-sectional analysis, the same authors estimated non-significant BMI differences among adults and youth with a 1%-higher tax rate.18, 20 Powell and colleagues19 found non-significant associations between state soda tax rates and overall youth BMI.
However, studies that used stronger designs incorporating within-person change-predicting-change analyses have found significant associations between higher soft drink prices and lower weight in youth and adults.22 One study found that a 10% price increase for carbonated beverages led to a 0.42% decrease in average child’s BMI.23 This corresponds to a 0.13 BMI unit reduction given a modeled 16% price increase, which is very similar to the 0.16 change estimated in this study.
Regarding the potential magnitude of compensatory consumption, a double-blind, placebo-controlled randomized trial by de Ruyter et al.46 provides strong evidence for some, but far from complete, compensation. Randomization to consume 104 kcal/day of SSBs resulted in a 1-kg greater weight gain after 18 months, approximately 70% of what might be expected over this time period among children aged 8 years if there was no compensation.51 These results suggesting small compensatory effects are consistent with two other randomized trials in youth that replaced SSBs with free non-caloric beverages.65, 66 Estimates of the impact of a change in SSB intake on weight from change-in-change studies among adults used in the present analysis found evidence of greater compensation. Mozaffarian and colleagues43 found that each additional serving of SSBs was associated with a 1.32-pound greater weight gain over 4 years, less than 10% of what would be expected if there was no compensation.43, 47 At the other end of the range modeled in this study, Chen et al.42 found that each additional serving of SSBs was associated with a 3.6-pound greater weight gain, about 40% of what would be expected with no compensation. So, although we agree that individuals will compensate in part for changes in SSB intake resulting from increased relative SSB prices, and explicitly incorporate compensation into our model, the best evidence does not suggest complete compensation.
The proposed tax is estimated to generate $12.5 billion/year in tax revenue in 2015, similar to the $13.8 billion estimated in another analysis using industry sales data from 2008,67 and the analysis from the Congressional Budget Office, which calculated that a federal excise tax of $0.03/12 ounces of SSBs would generate $4.7 billion in 2010.68 Arguments against a SSB tax, frequently made by groups supported by the beverage industry, focus on the potential regressive effect of the tax.63, 69 Though several studies have estimated a lower price elasticity and potentially higher relative tax burden among low-income households,70, 71 empirical research indicates that SSB taxes pose a greater health benefit to children who are already overweight, African American children, and children living in low-income households,21 thereby reducing disparities in obesity. Nevertheless, the impact of the proposed intervention was not evaluated by race/ethnicity, income level, or weight status.
Previous industry-sponsored studies have highlighted the potential loss of jobs to industry as a result of excise taxes on SSBs.27 In a recent analysis, Powell and colleagues72 found that although implementing SSB taxes in California and Illinois would lead to job losses in the beverage industry, SSB taxes would lead to a slight increase in overall employment due to offsetting employment increases in non-beverage industry and government. Given the success of beverage industry marketing efforts to date, it is likely that a shift in marketing expenditures toward products not subject to the proposed excise tax on SSBs would counteract the projected impact on beverage industry revenue and employment.
It could be argued that a reduction in SSB consumption as a result of the proposed SSB tax would reduce consumer surplus due to the lost pleasure gained from drinking SSBs and that this cost should be included in the present analysis. Recent cost–benefit analyses conducted by the U.S. Food and Drug Administration reduced the expected societal benefits of public health policies by half due to lost consumer surplus.73, 74 We do not believe that current consumer decisions regarding SSB intake meet the assumptions underlying a potential lost consumer surplus analysis of perfectly rational decision makers operating with full information, accurate foresight, and stable time preferences.75, 76 Most importantly, given the emerging evidence linking SSB intake to a range of negative health outcomes, it is unlikely that consumers are making fully informed decisions about the risks of SSB intake. This is particularly true for children and adolescents who are repeatedly exposed to emotionally based SSB advertisements and may become addicted to caffeine and sugar in SSBs before they are capable of fully understanding the long-term risks of SSB consumption.77
Our analysis highlights the importance of several key uncertainties. Although this model’s estimate of the relationship between SSB intake and BMI is based on a double-blind, placebo-controlled trial in youth and four large observational studies in adults, there is a need for additional RCTs and evaluations of environmental interventions. It is also possible that the relationship between changes in SSB intake and BMI from the trials in youth and observational data in adults may not generalize to tax-induced changes in SSB intake in a free-living population. To address uncertainty in this relationship, we conducted sensitivity analyses using both short-term energy intake studies and econometric analyses of beverage demand systems, the latter of which more closely approximates price-induced changes in total energy intake from beverages. The results of these analyses are consistent with our primary scenario.
As with all similar simulation models, the model results represent the best estimate of a potential effect in the absence of stronger direct evidence. For some model variables there is limited evidence to estimate the effect of the tax, such as predicting the effective price increase resulting from the tax and whether consumers would respond to the tax by shifting to larger container sizes or lower-priced generic SSB brands. However, given that the proposed specific excise tax is per volume rather than cost, it should not encourage a shift to cheaper store brands and to larger serving sizes, as a sales tax would likely initiate. In fact, the relative tax-induced price increase will likely be greater for store brands and for larger containers than the average increase included in this model.
Despite these limitations, this analysis provides a conservative estimate of the potential benefits of the intervention. The model relies on BMI-mediated health effects and healthcare costs and does not incorporate additional expected reductions from reduced SSB intake in metabolic diseases, cardiovascular risk factors, dental caries, or bone fractures.6, 60–62 In a previous analysis, Wang et al.29 estimated that, independent of its effect on BMI, a $0.01/per ounce SSB tax would reduce diabetes incidence by 2.6% among adults aged 25–64 years. The reduction in diabetes incidence independent of weight loss accounted for more than half of the total healthcare cost savings in that analysis. The model in this study also excludes potential health gains from earmarking tax revenues to health promotion. Previous tobacco control efforts demonstrate the potential impact of earmarking SSB tax revenue to obesity prevention: CDC reported in 2007 that almost 90% of funding for state and local tobacco prevention programs came from excise taxes and tobacco settlement funds.78 Perhaps most importantly, the model does not incorporate indirect costs of obesity due to reduced productivity, increased absenteeism, disability, and early retirement or mortality, which means that the societal savings from the intervention are likely to be substantially underestimated.79, 80 Although the societal savings of the proposed policy are potentially large, the policy may reduce profits in the beverage industry if they are not able to increase sales among unsweetened alternatives.
Conclusions
In the short term, the proposed SSB tax policy would likely reduce excess weight among both youth and adults while increasing potential revenue for health promotion. Over 10 years, the policy would likely reduce healthcare expenditures and increase healthy life expectancy. Implementing the tax could also serve as a powerful social signal to reduce sugar consumption through additional individual behavioral and policy changes. This paper provides important new information to policymakers and the public regarding the substantial savings in both human health and government expenditures that could be achieved by the proposed tax on SSBs.
Acknowledgments
This work was supported in part by grants from the Robert Wood Johnson Foundation (#66284), Donald and Sue Pritzker Nutrition and Fitness Initiative, JPB Foundation, Office of Behavioral and Social Sciences Research of NIH (#HHSN276200700356P), National Collaborative on Childhood Obesity Research, and is a product of a Prevention Research Center supported by Cooperative Agreement U48/DP001946 from CDC, including the Nutrition and Obesity Policy Research and Evaluation Network. Carter, Moodie, Sacks and Swinburn are researchers within a National Health and Medical Research Council funded Centre for Research Excellence in Obesity Policy and Food Systems (grant no. 1041020). The findings and conclusions in this report are those of the author(s) and do not necessarily represent the official position of CDC. The authors would like to thank the members of the Stakeholder Group for their contribution to the project.
Appendix
This appendix describes the data used to estimate the impact of the proposed excise tax of 1 cent per ounce of sugar-sweetened beverages (SSBs) on BMI, revenue, and cost. The model relied on a range of published and unpublished data to calculate each step in the logic model proposed in Appendix Figure 1. Key model variables used in scenario and sensitivity analyses are listed in Appendix Table 1.
Description of Primary Scenario
Current Sugar-Sweetened Beverage Consumption
Methods used to estimate consumption of SSBs, juice, and milk based on 24-hour recall data from the National Health and Nutrition Examination Survey (NHANES) 2011-2012 are described elsewhere.82 A complete description of the sampling and data collection methods used in the survey can be found on the National Center for Health Statistics website (www.cdc.gov/nchs/nhanes.htm). Beverages used to extract SSB consumption data from the NHANES survey included the following: sodas, fruit drinks, sport drinks, low-calorie drinks, and other beverages that contain added caloric sweeteners.2 Sport drinks include all beverages with added sugar marketed for rehydration for athletes. Fruit drinks include all fruit drinks, fruit juices, and fruit nectars with added sugar. Sodas include all carbonated beverages with added sugar. Other SSBs include sweetened tea, rice drinks, bean beverages, sugar cane beverages, horchata, nonalcoholic wines/malt beverages, etc. SSBs exclude 100% juice, milk products, and artificially sweetened beverages. We estimated the consumption in kilocalories per day (kcal/day) using data reported by NHANES. Daily consumption in grams was converted to consumption in fluid ounces using gram-to-fluid ounce conversion factors for each beverage item included in the USDA Food and Nutrient Database for Dietary Studies (FNDDS), 5.0 and 2011-2012.83, 84 Daily consumption data in fluid ounces per day (ounce/day) and kcal/day are reported with standard errors in Appendix Table 2.
Impact of Tax on Price to Consumers
In a fully competitive market, prices increase by exactly the amount of a new tax.85 In the real world, a given tax may not be fully reflected in the price (e.g., a 10% excise tax may result in less than or greater than a 10% increase in the price). Besley and Rosen presented a model showing that the degree of cost shifting from taxation differs by commodity group, and that a $0.10 tax on soda in local U.S. markets would result in a more than $0.20 increase in prices.81 In a working paper published by the Bank of France, Berardi et al. report that after six months the 6% excise tax on sweetened beverages was passed through fully on soda, but only 85% for flavored water and 60% for fruit drinks.86 More recently, it was reported that Coca-Cola Femsa planned to increase SSB prices by 16% in response to the one peso per liter SSB excise tax (which was expected to raise prices by 10% if passed on fully) imposed by Mexico in January 2014, beginning in November before implementation of the tax.87 This study used a conservative estimate that the full effect of the tax increase is passed on to consumers, without any over-shifting, which is in line with U.S. beverage industry reports.27 As is the case in some states with tobacco excise taxes, states could enact legislation requiring beverage companies to pass on the full cost of the tax increase.88
The expected percent increase in SSB price was estimated based on the average $0.059/ounce in 2012 reported by Powell et al., which was inflated to $0.0612 in July 2014 dollars.40 The price per ounce estimated by Powell et al. was based on a weighted average across stores, fast-food restaurants and other sources proportional to source of consumed SSBs in NHANES 2009-2010. Price per ounce of SSBs purchased in stores was calculated using weighted averages of two-liter bottles, 12-can cases, and single-serve bottles or cans based on the distribution of package sizes estimated from 2010 Nielsen Homescan data. The $0.01/ounce excise tax would then result in a 16.3% price increase (0.0712/0.0612). We assumed that the tax rate would be adjusted annually for inflation to maintain the 16.3% price increase throughout the ten-year modeling timeframe.
Price Elasticity of Demand
Estimates of price elasticity of demand for SSBs vary widely by study and definition of the product category. Andreyeva et al. reviewed U.S. studies published prior to September 2007, finding 14 estimates of the price elasticity of soft drinks (including a broad range of nonalcoholic beverages) with a mean value of −0.79 (95% CI: −1.24, −0.33).8 More recently, Powell et al.41 reviewed studies published from 2007-2012 and estimated a mean own-price elasticity of demand for SSBs weighted by SSB category consumption shares of −1.21, ranging from −3.87 to −0.69 (Appendix Table 3). This means that a 10% increase in the price of soft drinks would result in a 12.1% reduction in consumption. This study utilizes the estimate from the Powell et al. study as it better reflects the narrower product category subject to the proposed tax compared to the broader estimate of soft drink elasticity presented by Andreyeva et al. Based on the lowest AIC score out of a range of standard continuous distributions and visual comparison to the weighted distribution of elasticity estimates included in the Powell et al. review, an exponential function (β=0.52511, Shift=0.6892) was used to incorporate the mean and range from the Powell et al. review into probabilistic sensitivity analyses.
This analysis made a number of assumptions about consumer responses to SSB price change, including:
Estimates of the own-price elasticity of demand were based on purchase of beverages for at-home consumption, which required the assumption that consumers will respond to changes in beverage prices in restaurants in a similar fashion and that demand elasticity is constant across age and gender. Of note, Wang and colleagues found among children and adolescents that 60% to 80% of SSB and fruit juice calories are consumed in the home.2 This provides some confidence that any bias from applying elasticity estimates from at-home consumption to overall consumption will have a limited impact on the outcome.
Elasticity estimates derived from relatively small price changes were assumed to apply to the much larger change in price that would be achieved by the proposed policy.
Income effects were assumed to be negligible given the small impact of the tax on overall household budget and are not included in the model.
Direct Effect of Change in Sugar-Sweetened Beverage Consumption on Change in BMI
A number of systematic reviews and meta-analyses have been published on the relationship between SSB intake and weight or BMI.5, 62, 89–99 From these reviews, one double-blind, placebo-controlled randomized trial of the effect of an increase in consumption of SSBs on weight among youth was identified.46 In the 18-month trial, de Ruyter et al. randomized 641 Dutch children aged 4-11 years to receive either 8-ounces/day of a SSB (104 kcal/day) (n=322) or an artificially-sweetened sugar-free beverage (n=319) in identical containers. Height and weight were measured at baseline, 6, 12, and 18 months follow-up. In this study, the impact of a reduction in SSB consumption as a result of the proposed SSB tax in youth (2-19 years of age) was modeled based on the de Ruyter et al. 18-month follow-up estimate of 1.01 kg (95% CI: −1.54, −0.48; p<0.001) lower weight gain among children consuming 8ounces/day of artificially-sweetened beverages compared to 8ounces/day of SSBs.
From the reviews listed previously, four large longitudinal studies in adults42–45 of sufficient duration were identified that assessed a change in SSB consumption and impact on weight status without controlling for total energy (Appendix Table 4). The relationship was modeled using a uniform distribution based on the range of the estimates of the effect of a one serving reduction on BMI (from 0.21 to 0.57). Details on how BMI estimates were extracted from these studies are available upon request.
Costs
All costs are expressed in July 2014 dollars, with data from other years inflated/deflated using the U.S. Bureau of Labor Statistics Consumer Price Index.100 Tax administration and auditing costs were provided by the State Departments of Revenue of West Virginia and Washington following outreach to six states currently administering beverage excise taxes. In the primary scenario, per capita costs were applied to the 2015 U.S. population 2 years of age or older to estimate the cost of national implementation. The national and per-capita costs, sources, and assumptions are included in Appendix Table 5.
It was conservatively assumed that administrative costs would be proportional to state population size (ignoring potential economies of scale). This may result in overestimation of the cost of administration of excise taxes as returns to scale likely evident in the administration of tax collection were not included. It was also assumed that costs of tax compliance (in time and direct costs) from the beverage industry would be equal to the cost of administration reported by the government.
Tax Revenue
Tax payment and revenue represent transfer payments between taxpayers and the state and therefore cancel out from the societal perspective. As such, tax payments were not considered in calculation of the ICER. However, total tax revenue was estimated in order to inform the implementation filter analysis. Annual national revenue was calculated by multiplying daily post-tax SSB consumption among the U.S. population by 365.25 days and by the $0.01/ounce tax rate in July 2014 dollars. Post-tax daily consumption was modeled using 2011-2012 NHANES consumption data shifted downwards based on the projected 16% price increase and on the range of own-price elasticities identified in the review by Powell et al.41
Scenario Analyses
Effect of Change in Sugar-Sweetened Beverage Intake on Change in Total Energy Intake
From previous reviews, two observational studies in children were identified that assessed the relationship between change in SSB consumption and change in total energy intake (Appendix Table 6). Striegel-Moore et al. followed girls aged 9-10 years for nine years and assessed SSB intake and total energy intake annually with 3-day food records.101 Using a mixed-effect model, they estimated that a 41 kcal change in soda consumption resulted in an 81.4 kcal change in TEI. Wang et al. analyzed NHANES 24-hour recall data to compare total energy intake across days on which SSBs were and were not consumed.82 They found that an 8-ounce change in SSB consumption was associated with a 104 kcal change in TEI. These estimates suggest a 1.99 and 1.14 kcal reduction in TEI for every 1 kcal reduction in SSB consumption, respectively. Four trials102–105 in adults estimating energy compensation from changes in SSB consumption were identified (Appendix Table 6). These three-week to one-month trials found that a 1 kcal increase in consumption led to 0.63-1.17 kcal increase in TEI.
Estimate of Change in Total Energy Intake Using Cross-Price Elasticities for Milk and Juice
Brownell et al. estimated that 25% of the reduction in calories from SSB consumption in response to taxation would be replaced from other sources.11 Similar to Smith et al.,106 this study estimated substitution of calories from juice and milk using consumption data from NHANES 2011-2012 and cross-price elasticities for these beverages. The distribution of own-price elasticities for SSBs was based on a review by Powell et al. (Appendix Table 3).41 Estimates of cross-price elasticities for juice and milk were taken from eight studies included in the Powell et al. review (Appendix Table 3). Sweetened coffee/tea was included in this study’s SSB category and, unlike Smith et al., this analysis did not calculate change in calories for unsweetened coffee/tea due to their minimal caloric contribution.
Mean percent compensation varied substantially by age and gender in the tertiary analysis. On average, consumers replaced 32% of calories reduced from SSBs with energy from milk and juice based on analysis of cross-price elasticities. Due to their low SSB consumption and relatively high milk and juice consumption, mean compensation among children 2-4 years of age was 133%. However, as milk and juice consumption declined and SSB consumption increased into adolescence and young adulthood, the percent compensation dropped, so that males aged 20-29 years compensated only 12% of the reduction of SSB consumption with calories from milk or juice. Compensation to other beverages was also higher in older age groups that do not consume high levels of SSBs.
Energy Change to Weight Change Conversion
Previous models of the impact of a SSB tax on weight have converted changes in daily energy consumption to weight change assuming that every cumulative reduction in 3,500 kcal results in the loss of 1 lb of body weight.70, 106 However, there is emerging consensus that reductions in average daily energy intake do not lead to indefinite weight loss, but result in a new steady-state weight following 3-5 years of gradual weight loss, with half of the weight loss occurring within the first year.107 In this study, steady-state changes in weight were estimated based on different linear equations in young children (2-4 years of age), youth (5-19 years of age) and adults (>19 years of age). In adults, Hall et al.’s estimate that a daily reduction of 100 kilojoules (kj) of energy intake would result in a loss of 1 kilogram of body weight at steady-state was used.47 Age- and gender-specific estimates for youth were used due to differences in metabolism and the energy cost of growth for children and adolescents. For youth, the age and gender-specific linear equations from Hall et al.51 for ages 7-18 years were extended for use in the 5-year cohort model to ages 5-19 years using the midpoint age from each 5-year cohort. For boys, the equation is: kcal per day per kg=68-2.5*age and for girls: kcal per day per kg=62-2.2*age. For young children 2-4 years of age, Schofield’s age- and sex-specific equations were used to estimate the change in basal metabolic rate (BMR) in kilojoules per kilogram change in body weight, which were used by the United Nations and WHO as the basis for consensus estimates of human energy requirements.108 This coefficient was then multiplied by age-specific coefficients for physical activity level (PAL) from a meta-analysis of doubly-labeled water studies of total energy expenditure and physical activity among children and adolescents in developed countries (PAL=total energy expenditure/BMR).109 The products are then age- and gender-specific coefficients for change in weight per change in total energy expenditure, which is equivalent to changes in weight per change in total energy intake. The resulting coefficients are then 216 kj/d/kg for boys 2-4 years of age and 204 kj/d/kg for girls 2-4 years of age. Age- and gender-specific coefficients were sampled from a triangular distribution with lower and upper bounds based on +/− 1.96 times the standard error of the PAL estimates from the Hoos et al. meta-analysis. Changes in weight were converted to changes in BMI using age- and gender-specific average height from NHANES 2009-2012.
Cost as Percentage of Revenue
In 2009, state governments collected $15.753 billion in gross tobacco revenue and $15.517 billion in net revenue from tobacco excise taxes.52 As such, ongoing state-based tobacco excise tax programs utilize 1.5% of total revenue for administrative expenditures. In order to provide an upper bound on the cost estimates for state-implemented SSB taxes, the cost of implementation of the SSB excise tax was estimated based on 1.5% of expected revenues. To be consistent with the primary scenario modeling of costs to industry equivalent to those borne by government, total costs of compliance and administration were estimated as 3% of revenues.
Alternative Tax Pass-Through Rates
The beverage industry may change pricing strategy to minimize the impact of the tax on the effective price. While traditional economic theory suggests that all taxes will be passed on to consumers85 and empirical evidence suggests that the beverage industry may in fact over-shift taxes to consumers,81 it is possible that companies will absorb some of the tax, which would reduce the impact on consumers. The impact of varying the assumption that taxes are passed through to consumers was tested by running scenarios where taxes are passed through either 50% or 150%, which would result in a 8% and 25% price increase, respectively. Using the average price elasticity estimate in the model, this would lead to a 10% or 30% reduction in consumption, respectively.
Lowest Identified Elasticity
Given the large impact of the elasticity estimate on the model, a scenario was modeled using the lower bound (absolute value) of the range of own-price elasticity for SSBs (0.69-3.87) presented by Powell et al., which would lead to an 11.3% reduction in consumption based on the 16% increase in price in the primary scenario.41
Appendix Figure 1.
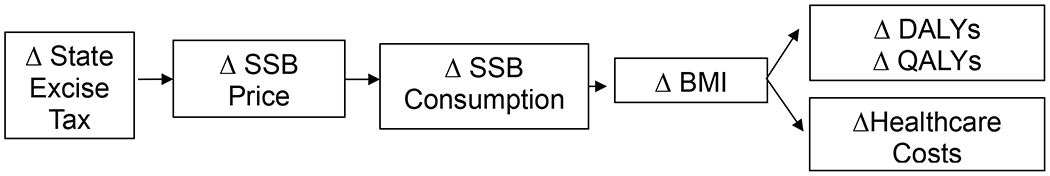
Logic pathway linking excise tax on sugar-sweetened beverages (SSB) to change in DALYs and QALYs
The estimated change in SSB consumption in response to the proposed tax is based on the review of own-price elasticities and average beverage prices published by the beverage industry. The primary scenario models the direct link between change in consumption and change in BMI based on RCTs and observational studies. Quality-adjusted life years (QALYs) gained and Disability Adjusted Life Years (DALYs) averted resulting from a change in gender- and age-specific BMI are calculated using the CHOICES multi-state Markov cohort model.
Appendix Table 1.
Key Model Variables for Scenario and Sensitivity Analyses: Mean Values and 95% Uncertainty Intervals
| Parameters | Mean Value | 95% Uncertainty Interval | Sources and Modeling Parameters |
|---|---|---|---|
| Scenario 2 | |||
| Secondary scenario: Δ in SSB intake (kcal/day) to change in TEI (kcal/day) in youth (2-19 years of age) | 1.56 | (1.16; 1.97) | Samples drawn from a uniform distribution (min=1.14, max=1.99) based on estimates two studies of change in TEI from change in SSB82, 101 |
| Secondary scenario: Δ in SSB intake (kcal/day) to change in TEI (kcal/day) in adults (>19 years of age) | 0.90 | (0.64; 1.16) | Samples drawn from a uniform distribution (min=0.63, max=1.17) based on the range of estimates from four studies of change in TEI from change in SSB102–105 |
| Scenario 3 | |||
| Cross-price elasticity of demand for milk | 0.15 | (−0.01; 0.33) | Samples drawn from a beta distribution (min=−0.078, m. likely=0.150, max=0.411) based on the mean and range from eight studies identified in a review by Powell et al.41 |
| Cross-price elasticity of demand for juice | 0.69 | (0.27; 1.19) | Samples drawn from a beta distribution (min=0.14, m. likely=0.637, max=1.447) based on the mean and range from seven studies identified in a review by Powell et al.41 |
| Energy-to-Weight Conversions | |||
| Factor to convert change in TEI (kj/day) to change in body weight (kg) in youth 2-4 years of age | 216 (males) 204 (females) | 193 to 238 (males) 183 to 224 (females) | Samples drawn from age-specific triangular distributions of coefficients for kj/day/kg based on age- and gender-specific estimates of change in BMR per kg from Schofield equations and meta-analysis of PAL.108, 109 See Appendix |
| Factor to convert change in TEI (kcal/day) to change in body weight (kg) in youth 5-19 years of age | 103-212 | N/A | Age- and gender-specific estimates of kcal/day/kg from Hall et al.51 |
| Factor to convert change in TEI (kj/day) to change in body weight (kg) in adults (>19 years of age) | 100 | N/A | Energy-to-weight conversion estimate of 100 kj/day/kg from Hall et al. 47 |
KCAL, kilocalories; KJ, kilojoule; TEI, total energy intake; BMR, basal metabolic rate; PAL, physical activity level
Appendix Table 2.
U.S. Per Capita Consumption of Sugar-Sweetened Beverages (SSB), Juice, and Milk by Age and Gender Measured in National Health and Examination Survey (NHANES, 2011-2012)
| Kcal/day (s.e.m.) | Fluid ounce/day (s.e.m.) | |||||||||||
|---|---|---|---|---|---|---|---|---|---|---|---|---|
| Male | Female | Male | Female | |||||||||
| Age | SSB | Milk | Juice | SSB | Milk | Juice | SSB | Milk | Juice | SSB | Milk | Juice |
| 2-4 | 58 (8) | 231 (19) | 89 (13) | 66 (9) | 191 (10) | 64 (7) | 5.2 (0.7) | 13.5 (1) | 6.0 (0.9) | 5.6 (0.7) | 11.3 (0.4) | 4.3 (0.4) |
| 5-9 | 136 (10) | 194 (14) | 51 (6) | 104 (7) | 152 (7) | 38 (5) | 11.8 (0.8) | 10.9 (0.6) | 3.5 (0.4) | 9.0 (0.5) | 9.0 (0.5) | 2.5 (0.3) |
| 10-14 | 188 (15) | 170 (19) | 29 (6) | 149 (17) | 123 (11) | 30 (4) | 17.2 (1.5) | 10.2 (1.2) | 1.9 (0.4) | 13.4 (1.6) | 7.7 (0.7) | 2.0 (0.3) |
| 15-19 | 266 (24) | 150 (15) | 53 (19) | 197 (14) | 75 (15) | 35 (7) | 22.9 (2) | 9.7 (1.1) | 3.4 (1.1) | 18.2 (1.4) | 5.0 (1.1) | 2.4 (0.5) |
| 20-29 | 273 (22) | 59 (9) | 36 (6) | 182 (20) | 45 (8) | 36 (7) | 23.9 (1.8) | 3.7 (0.6) | 2.5 (0.4) | 15.8 (1.8) | 2.8 (0.4) | 2.4 (0.4) |
| 30-39 | 235 (16) | 71 (8) | 42 (9) | 152 (12) | 63 (10) | 23 (4) | 20.6 (1.4) | 4.9 (0.6) | 2.9 (0.6) | 14.4 (1.3) | 4.1 (0.6) | 1.6 (0.2) |
| 40-49 | 201 (28) | 80 (8) | 19 (3) | 151 (18) | 52 (8) | 26 (8) | 17.6 (2.4) | 5.2 (0.5) | 1.3 (0.2) | 13.9 (1.1) | 3.5 (0.5) | 1.8 (0.5) |
| 50-59 | 160 (19) | 79 (20) | 39 (8) | 95 (15) | 48 (6) | 19 (3) | 14.9 (2.1) | 4.8 (1.2) | 2.6 (0.5) | 9.3 (1.3) | 3.4 (0.4) | 1.4 (0.3) |
| 60-69 | 106 (13) | 84 (9) | 51 (12) | 59 (9) | 56 (4) | 20 (4) | 9.5 (1.2) | 5.8 (0.7) | 4.3 (1.2) | 5.7 (0.9) | 4.0 (0.4) | 1.5 (0.3) |
| 70-79 | 74 (13) | 75 (12) | 31 (7) | 65 (12) | 77 (15) | 29 (5) | 6.9 (1.1) | 4.9 (0.7) | 2.3 (0.4) | 6.5 (1.2) | 5.2 (0.9) | 2.0 (0.3) |
| 80+ | 68 (14) | 89 (12) | 38 (9) | 29 (6) | 92 (10) | 37 (6) | 7.0 (1.2) | 6.5 (1) | 2.6 (0.5) | 2.7 (0.5) | 6.4 (0.6) | 2.5 (0.4) |
Kcal, kilocalories; s.e.m., standard error of the mean
Appendix Table 3.
Sugar-Sweetened Beverages Own- and Cross-Price Elasticities for Milk and Juice
| Study | SSBa | Milk | Juice | SSB Category Label | Notes |
|---|---|---|---|---|---|
| Brown MG (2008)110 | −1.956 to −1.715 | 0.2978 | 0.7452 | Soda | Uncompensated cross-price elasticities were averaged for orange (0.4478), grapefruit (0.7459), apple (0.7642), grape (0.8652), remaining fruit juice (0.7160), and vegetable juice (0.9323). For milk, the uncompensated cross-price elasticity for “milk and shakes” (0.2978) was used |
| Zheng and Kaiser (2008)111 | −0.521 to −0.306 | −0.078 | 0.549 | Soft drinks | Compensated cross-price elasticities from the AIDS model were used as no uncompensated cross-price elasticities were presented |
| Zheng and Kaiser (2008) 112 | −0.609 | −0.0635 | 0.518 | Soft drinks | Compensated cross-price elasticities were averaged for milk (−0.091 and −0.036; average: −0.0635) and juice (0.529 and 0.507; average: 0.518) from two model specifications as no uncompensated cross-price elasticities were presented |
| Duffey et al. (2010)22 | −0.712 | 0.411 | N/A | Soda | Cross-price elasticity for whole milk was used based on reported 4.11% increase in whole milk consumption in response to a 10% increase in the price of soda |
| Finkelstein et al. (2010)70 | 𡈒0.87 to −0.73 | N/A | N/A | SSB | Cross-price elasticities for milk and juice were not presented |
| Fletcher, Frisvold and Tefft (2010)113 | N/A | N/A | N/A | Soft drinks | Own-price elasticities and cross-price elasticities for milk and juice were not presented |
| Fletcher, Frisvold and Tefft (2010)18 | N/A | N/A | N/A | Soft drinks | Cross-price elasticities for milk and juice were not presented |
| Smith TA, Lin BH, and Lee JY (2010)106 | −1.264 | 0.178 | 0.557 | Caloric Sweetened Beverages | Uncompensated cross-price elasticities were averaged for skim, low-fat and whole milk (0.198, 0.115, 0.222; average: 0.178) and the uncompensated cross-price elasticity for juices was used (0.557) |
| Sturm et al. (2010)21 | N/A | N/A | N/A | Soda | Own-price elasticities and cross-price elasticities for milk and juice were not presented |
| Zheng, Kinnucan, and Kaiser (2010)114 | −0.772 to −0.366 | N/A | N/A | Soft drinks | Cross-price elasticities for milk and juice were not presented |
| Dharmasena and Capps (2011)115 | −3.865 to −0.6892 | 0.234 | 1.447 | Regular soft drinks, isotonics, fruit drinks | Cross-price elasticities were estimated based on simulated percent change in consumption of juice (28.94%), low-fat milk (10.94%) and high-fat milk (−1.60%) in response to a 20% tax on SSBs (incorporating separate elasticities for isotonics, regular soft drinks, and fruit drinks). Cross-price elasticities were calculated for juice (28.94/20=1.447), low-fat milk (10.94/20=0.547), and high-fat milk (−1.60/20=−0.08). The cross-price elasticities for low-fat and high-fat milk (0.234) were averaged |
| Lin et al. (2011)116 | −1.292 to −0.949 | −0.013 | 0.501 | Sugary Drinks | Uncompensated cross price elasticities for low-income and high-income consumers were averaged for juices (0.473, 0.529; average: 0.501), skim milk (−0.583, 0.344; average: −0.120), low-fat milk (−0.250, 0.227; average: −0.012), and whole milk (0.242, −0.054; average: 0.094). Cross-price elasticities for skim, low-fat and whole milk were then averaged (−0.120, −0.012, 0.094; average: −0.013) |
| Zhen et al. (2011)117 | −2.65 to −0.53 | 0.234 | 0.14 | Regular carbonated soft drinks | Cross-price elasticities for regular carbonated soft drinks were averaged from four model specifications for fruit juice(−0.02, 0.01, 0.33, 0.24; average:0.14), low-fat milk(0.05, −0.07, 0.37, 0.25; average: 0.15) and whole milk (0.03, 0.13, 0.61, 0.50; average: 0.318). The estimates for low-fat and whole milk were then averaged (0.15, 0.318; average: 0.234) |
| Weighted Mean (range) | −1.21 (−3.87, −0.689) | 0.150 (−0.078, 0.411) | 0.637 (0.14, 1.447) |
Note: The mean and range of SSB own-price elasticities are weighted based on the share of total SSB consumption represented by the product category in each study as reported in a review published by Powell et al.41 Own-price elasticities are interpreted as the percent change in purchases of SSBs for a percent change in the price. The mean and range of cross-price elasticities for milk and juice are based on the estimates presented in this table. Cross-price elasticities are the percent change in purchases for a substitute or complement for a given percent change in the price of SSBs. For example, a cross-price elasticity for milk of 0.16 means that milk purchases increase by 1.6% for a 10% increase in the price of SSBs.
Appendix Table 4.
Change in Sugar-Sweetened Beverages (SSB) Consumption and Change in BMI or Weight Among U.S. Adults
| Study | Study Design | Sample | Duration | Weight/BMI Change (SE) | Servings | Change in BMI per 12ounce Reductiona |
|---|---|---|---|---|---|---|
| Schulze45 (2004) | Longitudinal | 51,603 females; Mean age: 36 | 4 years | Average of difference in BMI change from 1/wk to 1/daye and 1/day to 1/wk vs. those remaining the same | −0.54 | |
| Palmer44 (2008) | Longitudinal | 43,960 females; Age range: 21-69 | 6 years | Average of difference in kg change from 1/wk to 1/daye and 1/day to 1/wk vs. those remaining the same across soft drinks juice drinks | Glass/day | −0.51 |
| Chen42 (2009) | Longitudinal analysis of RCT | 810 adults, 62% female; Mean age: 50 | 18 months | 1.64 kg (95% CI: 0.70, 2.59; P = 0.001) | 12 fl ounce/day | −0.57 |
| Mozaffarian 43 (2011) | Longitudinal | 120,877 adults, 81% female; Mean age: 37.5-52.2 | 4 years | 1.32 kg (95% CI: 1.03, 1.62, p<0.001) | Servings/dayf | −0.21 |
Kcal, kilocalories; wk, week
Used average female (1.62m) and male (1.76m) and overall (1.69m) adult height from NHANES 2003-2006 to calculate BMI (kg/m2), with 1lb=0.454kg
Assumed that 12 ounces of SSB provides 140 kcal (Wang 2008)
Assumed that one glass equivalent to 12 ounces
Assumed that serving equivalent to 12 ounces and month is 30 days.
Assumed that serving equivalent to 12 ounces. Per serving effect is size based on median intake within each consumption category by time, which was provided by the authors for this study.
Assumed that serving equivalent to 12 ounces.
Appendix Table 5.
Intervention Costs
| Resource | Number of Items per Million People | Cost per Item (dollars) | Total Cost per Million People (dollars) | Total National Annual Costa (dollars) | Description/Source |
|---|---|---|---|---|---|
| Government | |||||
| Tax department administrator | 0.32 FTE | 89,500 | 28,700 | 8,960,000 | Average per capita FTE data from West Virginia (WV) and Washington (WA) State Departments of Revenue. U.S. Bureau of Labor Statistics 2013 mean salary for Occupation 13-2081: Tax examiners, collectors, and revenue agents. Assume 56% non-salary benefits |
| Field audit salary costs | 0.30 FTE | 89,500 | 26,900 | 8,310,000 | Per capita FTE data from WV State Department of Revenue. U.S. Bureau of Labor Statistics 2013 mean salary for Occupation 13-2081: Tax examiners, collectors, and revenue agents. Assume 56% non-salary benefits |
| Field audit direct costs | 1 | 9,160 | 2,870,000 | Per capita direct field audit costs from WV State Department of Revenue | |
| Tax certification system operating costs | 1 | 11,900 | 3,710,000 | Per capita tax certification system operating costs from WV State Department of Revenue | |
| Subtotal | 76,500 | 23,800,000 | |||
| Industry | |||||
| Industry tax auditor | 0.32 FTE | 106,000 | 33,900 | 10,600,000 | Assume FTE equivalent to government. Apply to U.S. Bureau of Labor Statistics 2013 mean salary for Occupation 13-2011: Accountants and auditors. Assume 43% non-salary benefits |
| Field audit compliance salary costs | 0.30 FTE | 106,000 | 31,800 | 9,840,000 | Assume FTE equivalent to government. Apply to U.S. Bureau of Labor Statistics 2013 mean salary for Occupation 13-2011: Accountants and auditors. Assume 43% non-salary benefits |
| Field audit compliance direct costs | 1 | 9,160 | 2,870,000 | Assume equivalent to government costs | |
| Tax certification system operating costs | 1 | 11,900 | 3,710,000 | Assume equivalent to government costs | |
| Subtotal | 86,800 | 27,000,000 | |||
| Total | 163,000 | 50,900,000 | |||
Dollars, 2005 U.S. dollars; FTE, full-time equivalent
Costs are based on average inputs in 2014 dollars and will differ from simulation results, may not sum due to rounding
Appendix Table 6.
Change in Sugar-Sweetened Beverages (SSB) Consumption and Change in Total Energy Intake (TEI) Among U.S. Children and Adults
| Study | Study design | Sample | Duration | Energy change | Servings | TEI (kcal) change per kcal SSB reduced |
|---|---|---|---|---|---|---|
| Children | ||||||
| Striegel-Moore (2006)101 | Cohort | 2,379 females; Age range: 9-10 years | 9 years | 81.4 kcal | 41 kcal | −1.99 |
| Wang (2009)82 | Cohort | 1,566 females, 1,532 males; Age range: 2-19 years | 1 week | 106 kcal | 8ounces.=93 kcala | −1.14 |
| Adults | ||||||
| Tordoff (1990)103 | Cross-over trial | 9 females, 21 males; Mean age: 28 years (females), 23 years (males) | 3 weeks | 336 kcal | 530 kcal | −0.63 |
| DiMeglio (2000)102 | Cross-over trial | 8 females, 7 males; Mean age: 22 years | 1 month | 523 kcal | 450 kcal | −1.17 |
| Van Wymelbeke (2004)104 | Cross-over trial | 12 females, 12 males; Age range: 20-25 years | 1 month | 3088 KJ=738 kcal | 3344 KJ=799 kcal | −0.92 |
| Reid (2007)105 | RCT | 133 females; Mean age: 32 years | 1 month | 1185KJ=283 kcal | 1800KJ=430 kcal | −0.66 |
kcal/d, kilocalories per day; KJ, kilojoules
Based on the assumption that a 12-ounce serving of SSB=140 kcal
Footnotes
No financial disclosures were reported by the authors of this paper.
References
- 1.Nielsen SJ, Popkin BM. Changes in beverage intake between 1977 and 2001. Am J Prev Med. 2004;27(3):205–210. 10.1016/j.amepre.2004.05.005. [DOI] [PubMed] [Google Scholar]
- 2.Wang YC, Bleich SN, Gortmaker SL. Increasing caloric contribution from sugar-sweetened beverages and 100% fruit juices among U.S. children and adolescents, 1988–2004. Pediatrics. 2008;121(6):e1604–1614. [DOI] [PubMed] [Google Scholar]
- 3.Bleich SN, Wang YC, Wang Y, Gortmaker SL. Increasing consumption of sugar-sweetened beverages among U.S. adults: 1988–1994 to 1999–2004. Am J Clin Nutr. 2009;89(1):372–381. 10.3945/ajcn.2008.26883. [DOI] [PubMed] [Google Scholar]
- 4.Kit BK, Fakhouri TH, Park S, Nielsen SJ, Ogden CL. Trends in sugar-sweetened beverage consumption among youth and adults in the United States: 1999–2010. Am J Clin Nutr. 2013;98(1):180–188. 10.3945/ajcn.112.057943. [DOI] [PMC free article] [PubMed] [Google Scholar]
- 5.Malik VS, Popkin BM, Bray GA, Despres JP, Hu FB. Sugar-sweetened beverages, obesity, type 2 diabetes mellitus, and cardiovascular disease risk. Circulation. 2010;121(11):1356–1364. 10.1161/CIRCULATIONAHA.109.876185. [DOI] [PMC free article] [PubMed] [Google Scholar]
- 6.Chen L, Caballero B, Mitchell DC, et al. Reducing consumption of sugar-sweetened beverages is associated with reduced blood pressure: a prospective study among United States adults. Circulation. 2010;121(22):2398–2406. 10.1161/CIRCULATIONAHA.109.911164. [DOI] [PMC free article] [PubMed] [Google Scholar]
- 7.U.S. Department of Agriculture, U.S. DHHS. Dietary Guidelines for Americans, 2010. Washington, D.C.: U.S. Government Printing Office, 2010. [Google Scholar]
- 8.Andreyeva T, Long MW, Brownell KD. The impact of food prices on consumption: a systematic review of research on the price elasticity of demand for food. Am J Public Health. 2010;100(2):216–222. 10.2105/AJPH.2008.151415. [DOI] [PMC free article] [PubMed] [Google Scholar]
- 9.Chaloupka FJ, Powell LM, Chriqui JF. Sugar-sweetened beverage taxes and public health: a research brief. Minneapolis: Robert Wood Johnson Foundation, Healthy Eating Research, 2009. [Google Scholar]
- 10.Wagenaar AC, Salois MJ, Komro KA. Effects of beverage alcohol price and tax levels on drinking: a meta-analysis of 1003 estimates from 112 studies. Addiction. 2009;104(2):179–190. 10.1111/j.1360-0443.2008.02438.x. [DOI] [PubMed] [Google Scholar]
- 11.Brownell KD, Farley T, Willett WC, et al. The public health and economic benefits of taxing sugar-sweetened beverages. N Engl J Med. 2009;361(16):1599–1605. 10.1056/NEJMhpr0905723. [DOI] [PMC free article] [PubMed] [Google Scholar]
- 12.IOM. Local government actions to prevent childhood obesity. Washington, D.C.: National Academy of Science, 2009. [PubMed] [Google Scholar]
- 13.Chriqui JF, Eidson SS, Chaloupka FJ. State sales taxes on regular soda (as of January 2014)-BTG Fact Sheet. Chicago, IL: Bridging the Gap Program, Health Policy Center, Institute for Health Research and Policy, University of Illinois at Chicago, 2014. [Google Scholar]
- 14.Rudd Center for Food Policy and Obesity. 2013 SSB tax legislation: 9 states and 1 City with excise, 2 with sales, and 1 with both. New Haven: Rudd Center for Food Policy & Obesity; 2014. www.yaleruddcenter.org/resources/upload/docs/what/policy/SSBtaxes/SSB_Sales_and_Excise_Tax_Legislation_2013/SSB_Sales_and_Excise_Tax_Legislation_20140623.htm. [Google Scholar]
- 15.Lochner T Berkeley becomes nation’s first to pass soda tax; S.F. tax fails. Oakland Tribune. 2014, November 5;Sect. State and Regional News. [Google Scholar]
- 16.Mytton OT, Clarke D, Rayner M. Taxing unhealthy food and drinks to improve health. BMJ. 2012;344:e2931. 10.1136/bmj.e2931. [DOI] [PubMed] [Google Scholar]
- 17.Preliminary Results of the Effects of Tax in Mexico on Sugar-Sweetened Beverages Cuernavaca, Mexico: Instituto Nacional de Salud Publica; 2014. www.insp.mx/epppo/blog/preliminares-bebidas-azucaradas.html. [Google Scholar]
- 18.Fletcher JM, Frisvold DE, Tefft N. The effects of soft drink taxes on child and adolescent consumption and weight outcomes. J Public Econ. 2010;94:967–974. 10.1016/j.jpubeco.2010.09.005. [DOI] [Google Scholar]
- 19.Powell LM, Chriqui J, Chaloupka FJ. Associations between state-level soda taxes and adolescent body mass index. J Adolesc Health. 2009;45(3 Suppl):S57–63. 10.1016/j.jadohealth.2009.03.003. [DOI] [PubMed] [Google Scholar]
- 20.Fletcher JM, Frisvold DE, Tefft N. Non-linear effects of soda taxes on consumption and weight outcomes. Health economics. 2014. 10.1002/hec.3045. [DOI] [PMC free article] [PubMed] [Google Scholar]
- 21.Sturm R, Powell LM, Chriqui JF, Chaloupka FJ. Soda taxes, soft drink consumption, and children’s body mass index. Health Aff (Millwood). 2010;29(5):1052–1058. 10.1377/hlthaff.2009.0061. [DOI] [PMC free article] [PubMed] [Google Scholar]
- 22.Duffey KJ, Gordon-Larsen P, Shikany JM, Guilkey D, Jacobs DR Jr., Popkin BM. Food price and diet and health outcomes: 20 years of the CARDIA Study. Arch Intern Med. 2010;170(5):420–426. 10.1001/archinternmed.2009.545. [DOI] [PMC free article] [PubMed] [Google Scholar]
- 23.Wendt M, Todd JE. The effect of food and beverage prices on children’s weight. Washington, D.C.: U.S. Department of Agriculture, Econonomic Research Service, 2011. ERR-118 Contract No.:118. [Google Scholar]
- 24.Brownell KD, Frieden TR. Ounces of prevention--the public policy case for taxes on sugared beverages. N Engl J Med. 2009;360(18):1805–1808. 10.1056/NEJMp0902392. [DOI] [PubMed] [Google Scholar]
- 25.WHO. WHO technical manual on tobacco tax administration. Geneva, Switzerland: WHO; 2010. http://whqlibdoc.who.int/publications/2010/9789241563994_eng.pdf?ua=1. [Google Scholar]
- 26.Finkelstein EA, Zhen C, Bilger M, Nonnemaker J, Farooqui AM, Todd JE. Implications of a sugar-sweetened beverage (SSB) tax when substitutions to non-beverage items are considered. J Health Econ. 2013;32(1):219–239. 10.1016/j.jhealeco.2012.10.005. [DOI] [PubMed] [Google Scholar]
- 27.Hahn R The potential economic impact of a U.S. excise tax on selected beverages: A report to the American Beverage Association. Washington, D.C.: Georgetown University, Center for Business and Public Policy, 2009. [Google Scholar]
- 28.Lin BH, Smith TA, Lee JY, Hall KD. Measuring weight outcomes for obesity intervention strategies: The case of a sugar-sweetened beverage tax. Econ Hum Biol. 2011;9(4):329–341. 10.1016/j.ehb.2011.08.007. [DOI] [PubMed] [Google Scholar]
- 29.Wang YC, Coxson P, Shen YM, Goldman L, Bibbins-Domingo K. A penny-per-ounce tax on sugar-sweetened beverages would cut health and cost burdens of diabetes. Health Aff (Millwood). 2012;31(1):199–207. 10.1377/hlthaff.2011.0410. [DOI] [PubMed] [Google Scholar]
- 30.Pear R Tax proposals draw critics in talks on financing health insurance. The New York Times. 2009. May 20, 2009;Sect. A.
- 31.Hakim D, Confessore N. Paterson seeks huge cuts and $1 billion in taxes and fees. The New York Times. 2010. January 20, 2010;Sect. A.
- 32.Leonhardt D The battle over taxing soda. The New York Times. 2010. May 19, 2010;Sect. B.
- 33.Haby MM, Vos T, Carter R, et al. A new approach to assessing the health benefit from obesity interventions in children and adolescents: the assessing cost-effectiveness in obesity project. Int J Obes (Lond). 2006;30(10):1463–1475. 10.1038/sj.ijo.0803469. [DOI] [PubMed] [Google Scholar]
- 34.Carter R, Moodie M, Markwick A, et al. Assessing cost-effectiveness in obesity (ACE-obesity): an overview of the ACE approach, economic methods and cost results. BMC public health. 2009;9:419. 10.1186/1471-2458-9-419. [DOI] [PMC free article] [PubMed] [Google Scholar]
- 35.Vos T, Carter R, Barendregt J, et al. Assessing cost-effectiveness in prevention (ACE-Prevention): final report. Brisbane: University of Queensland and Deakin University, 2010. [Google Scholar]
- 36.Siegel JE, Weinstein MC, Russell LB, Gold MR. Recommendations for reporting cost-effectiveness analyses. Panel on Cost-Effectiveness in Health and Medicine. JAMA. 1996;276(16):1339–1341. 10.1001/jama.1996.03540160061034. [DOI] [PubMed] [Google Scholar]
- 37.Muennig P, Lubetkin E, Jia H, Franks P. Gender and the burden of disease attributable to obesity. Am J Public Health. 2006;96(9):1662–1668. 10.2105/AJPH.2005.068874. [DOI] [PMC free article] [PubMed] [Google Scholar]
- 38.Finkelstein EA, Trogdon JG. Public health interventions for addressing childhood overweight: analysis of the business case. Am J Public Health. 2008;98(3):411–415. 10.2105/AJPH.2007.114991. [DOI] [PMC free article] [PubMed] [Google Scholar]
- 39.Gortmaker SL, Long MW, Resch SC, et al. Cost-effectiveness of childhood obesity interventions: evidence and methods for CHOICES. Am J Prev Med. 2015;49(1):102–11. 10.1016/j.amepre.2015.03.032 [DOI] [PMC free article] [PubMed] [Google Scholar]
- 40.Powell LM, Isgor Z, Rimkus L, Chaloupka FJ. Sugar-sweetened beverage prices: Estimates from a national sample of food outlets. Chicago, IL: Bridging the Gap Program, Health Policy Center, Institute for Health Research and Policy, University of Illinois at Chicago; 2014. www.bridgingthegapresearch.org/_asset/ww9rpz/btg_SSB_price_brief_FINAL_Jan_2014.pdf. [Google Scholar]
- 41.Powell LM, Chriqui JF, Khan T, Wada R, Chaloupka FJ. Assessing the potential effectiveness of food and beverage taxes and subsidies for improving public health: a systematic review of prices, demand and body weight outcomes. Obes Rev. 2013;14(2):110–128. 10.1111/obr.12002. [DOI] [PMC free article] [PubMed] [Google Scholar]
- 42.Chen L, Appel LJ, Loria C, et al. Reduction in consumption of sugar-sweetened beverages is associated with weight loss: the PREMIER trial. Am J Clin Nutr. 2009;89(5):1299–1306. 10.3945/ajcn.2008.27240. [DOI] [PMC free article] [PubMed] [Google Scholar]
- 43.Mozaffarian D, Hao T, Rimm EB, Willett WC, Hu FB. Changes in diet and lifestyle and long-term weight gain in women and men. N Engl J Med. 2011;364(25):2392–2404. 10.1056/NEJMoa1014296. [DOI] [PMC free article] [PubMed] [Google Scholar]
- 44.Palmer JR, Boggs DA, Krishnan S, Hu FB, Singer M, Rosenberg L. Sugar-sweetened beverages and incidence of type 2 diabetes mellitus in African American women. Arch Intern Med. 2008;168(14):1487–1492. 10.1001/archinte.168.14.1487. [DOI] [PMC free article] [PubMed] [Google Scholar]
- 45.Schulze MB, Manson JE, Ludwig DS, et al. Sugar-sweetened beverages, weight gain, and incidence of type 2 diabetes in young and middle-aged women. JAMA. 2004;292(8):927–934. 10.1001/jama.292.8.927. [DOI] [PubMed] [Google Scholar]
- 46.de Ruyter JC, Olthof MR, Seidell JC, Katan MB. A trial of sugar-free or sugar-sweetened beverages and body weight in children. N Engl J Med. 2012;367(15):1397–1406. 10.1056/NEJMoa1203034. [DOI] [PubMed] [Google Scholar]
- 47.Hall KD, Sacks G, Chandramohan D, et al. Quantification of the effect of energy imbalance on bodyweight. Lancet. 2011;378(9793):826–837. 10.1016/S0140-6736(11)60812-X. [DOI] [PMC free article] [PubMed] [Google Scholar]
- 48.Retail sales tax compliance costs: A national estimate. Washington, D.C.: PricewaterhouseCoopers LLP; 2006. http://netchoice.org/wp-content/uploads/cost-of-collection-study-sstp.pdf. [Google Scholar]
- 49.Annual Report FY 2012-2013. Sacramento, CA: California State Board of Equalization; 2014. www.boe.ca.gov/annual/2012-13/stats.html. [Google Scholar]
- 50.Gold MR, Siegel JE, Russell LB, Weinstein MC, eds. Cost-effectiveness in health and medicine. New York: Oxford University Press; 1996. [Google Scholar]
- 51.Hall KD, Butte NF, Swinburn BA, Chow CC. Dynamics of childhood growth and obesity: development and validation of a quantitative mathematical model. Lancet Diabetes Endocrinol. 2013:1(2):97–105. 10.1016/S2213-8587(13)70051-2. [DOI] [PMC free article] [PubMed] [Google Scholar]
- 52.Orzechowski W, Walker RC. The tax burden on tobacco. Arlington, VA: Orzechowski and Walker, 2009. [Google Scholar]
- 53.CDC. Defining Overweight and Obesity. Atlanta, GA: CDC; 2012. www.cdc.gov/obesity/adult/defining.html. [Google Scholar]
- 54.CDC. Basics About Childhood Obesity. Atlanta, GA: CDC; 2012. www.cdc.gov/obesity/childhood/basics.html. [Google Scholar]
- 55.Drummond M, Scuplher M, Torrance G, O’Brien B, Stoddard G. Methods for the economic evaluation of health care programmes. Oxford: Oxford University Press; 2005. [Google Scholar]
- 56.Federal Trade Commission. Marketing food to children and adolescents: a review of industry expenditures, activities, and self-regulation-A report to Congress. Washington, D.C.: Federal Trade Commission, Bureau of Consumer Protection and Bureau of Economics, 2008. [Google Scholar]
- 57.Frieden TR, Mostashari F, Kerker BD, Miller N, Hajat A, Frankel M. Adult tobacco use levels after intensive tobacco control measures: New York City, 2002–2003. Am J Public Health. 2005;95(6):1016–1023. 10.2105/AJPH.2004.058164. [DOI] [PMC free article] [PubMed] [Google Scholar]
- 58.Friedman R Public opinion data. New Haven, CT: Yale Rudd Center for Food Policy & Obesity; 2013. www.yaleruddcenter.org/what_we_do.aspx?id=273. [Google Scholar]
- 59.Hamilton WL, Biener L, Brennan RT. Do local tobacco regulations influence perceived smoking norms? Evidence from adult and youth surveys in Massachusetts. Health Educ Res. 2008;23(4):709–722. 10.1093/her/cym054. [DOI] [PMC free article] [PubMed] [Google Scholar]
- 60.Fung TT, Malik V, Rexrode KM, Manson JE, Willett WC, Hu FB. Sweetened beverage consumption and risk of coronary heart disease in women. Am J Clin Nutr. 2009;89(4):1037–1042. 10.3945/ajcn.2008.27140. [DOI] [PMC free article] [PubMed] [Google Scholar]
- 61.Lim S, Sohn W, Burt BA, et al. Cariogenicity of soft drinks, milk and fruit juice in low-income african-american children: a longitudinal study. J Am Dent Assoc. 2008;139(7):959–967; quiz 95. 10.14219/jada.archive.2008.0283. [DOI] [PubMed] [Google Scholar]
- 62.Vartanian LR, Schwartz MB, Brownell KD. Effects of soft drink consumption on nutrition and health: a systematic review and meta-analysis. Am J Public Health. 2007;97(4):667–675. 10.2105/AJPH.2005.083782. [DOI] [PMC free article] [PubMed] [Google Scholar]
- 63.Jou J, Niederdeppe J, Barry CL, Gollust SE. Strategic messaging to promote taxation of sugar-sweetened beverages: lessons from recent political campaigns. Am J Public Health. 2014;104(5):847–853. 10.2105/AJPH.2013.301679. [DOI] [PMC free article] [PubMed] [Google Scholar]
- 64.Kristensen AH, Flottemesch TJ, Maciosek MV, et al. Reducing Childhood Obesity through U.S. Federal Policy: A Microsimulation Analysis. Am J Prev Med. 2014;47(5):604–612. 10.1016/j.amepre.2014.07.011. [DOI] [PMC free article] [PubMed] [Google Scholar]
- 65.Ebbeling CB, Feldman HA, Chomitz VR, et al. A randomized trial of sugar-sweetened beverages and adolescent body weight. N Engl J Med. 2012;367(15):1407–1416. 10.1056/NEJMoa1203388. [DOI] [PMC free article] [PubMed] [Google Scholar]
- 66.Ebbeling CB, Feldman HA, Osganian SK, Chomitz VR, Ellenbogen SJ, Ludwig DS. Effects of decreasing sugar-sweetened beverage consumption on body weight in adolescents: a randomized, controlled pilot study. Pediatrics. 2006;117(3):673–680. 10.1542/peds.2005-0983. [DOI] [PubMed] [Google Scholar]
- 67.Andreyeva T, Chaloupka FJ, Brownell KD. Estimating the potential of taxes on sugar-sweetened beverages to reduce consumption and generate revenue. Prev Med. 2011;52(6):413–416. 10.1016/j.ypmed.2011.03.013. [DOI] [PubMed] [Google Scholar]
- 68.Congressional Budget Office. Budget options, volume 1: health care. Washington, D.C.: U.S. Government Printing Office, 2008. [Google Scholar]
- 69.Hartocollis A Failure of state soda tax plan reflects power of antitax message. The New York Times. 2010. July 3, 2010;Sect. A.
- 70.Finkelstein EA, Zhen C, Nonnemaker J, Todd JE. Impact of targeted beverage taxes on higher- and lower-income households. Arch Intern Med. 2010;170(22):2028–2034. 10.1001/archinternmed.2010.449. [DOI] [PubMed] [Google Scholar]
- 71.Lin BH, Slpmith TA, Lee JY. The effects of a sugar-sweetened beverage tax: consumption, calorie intake, obesity, and tax burden by income Agricultural and Applied Economics Association Annual Meeting; Denver, 2010. [Google Scholar]
- 72.Powell LM, Wada R, Persky JJ, Chaloupka FJ. Employment impact of sugar-sweetened beverage taxes. Am J Public Health. 2014;104(4):672–677. 10.2105/AJPH.2013.301630. [DOI] [PMC free article] [PubMed] [Google Scholar]
- 73.Food and Drug Administration. Required warnings for cigarette packages and advertisements, final rule. Fed Regis. 2011;76:36628–36777. [PubMed] [Google Scholar]
- 74.Food and Drug Administration. Food Labeling: Nutrition Labeling of Standard Menu Items in Restaurants and Similar Retail Food Establishments, Final Regulatory Impact Analysis. Silver Spring, MD: DHHS, 2014. [PubMed] [Google Scholar]
- 75.Chaloupka FJ, Warner KE, Acemoglu D, et al. An evaluation of the FDA’s analysis of the costs and benefits of the graphic warning label regulation. Tob Control. 2014. 10.1136/tobaccocontrol-2014-052022. [DOI] [PMC free article] [PubMed] [Google Scholar]
- 76.Song AV, Brown P, Glantz SA. When health policy and empirical evidence collide: the case of cigarette package warning labels and economic consumer surplus. Am J Public Health. 2014;104(2):e42–51. 10.2105/AJPH.2013.301737. [DOI] [PMC free article] [PubMed] [Google Scholar]
- 77.Kumar G, Onufrak S, Zytnick D, Kingsley B, Park S. Self-reported advertising exposure to sugar-sweetened beverages among U.S. youth. Public Health Nutr. 2014:1–7. 10.1017/S1368980014001785. [DOI] [PMC free article] [PubMed] [Google Scholar]
- 78.CDC. Best practices for comprehensive tobacco control programs−-2007. Atlanta: U.S. DHHS, CDC, National Center for Chronic Disease Prevention and Health Promotion, Office on Smoking and Health, 2007. October 2007. Report No. [Google Scholar]
- 79.Popkin BM, Kim S, Rusev ER, Du S, Zizza C. Measuring the full economic costs of diet, physical activity and obesity-related chronic diseases. Obes Rev. 2006;7(3):271–293. 10.1111/j.1467-789X.2006.00230.x. [DOI] [PubMed] [Google Scholar]
- 80.Trogdon JG, Finkelstein EA, Hylands T, Dellea PS, Kamal-Bahl SJ. Indirect costs of obesity: a review of the current literature. Obes Rev. 2008;9(5):489–500. 10.1111/j.1467-789X.2008.00472.x. [DOI] [PubMed] [Google Scholar]
- 81.Besley TJ, Rosen HS. Sales taxes and prices: an empirical analysis. Natl Tax Journal. 1999;52(2):157–178. [Google Scholar]
- 82.Wang YC, Ludwig DS, Sonneville K, Gortmaker SL. Impact of change in sweetened caloric beverage consumption on energy intake among children and adolescents. Arch Pediatr Adolesc Med 2009;163(4):336–43. [DOI] [PubMed] [Google Scholar]
- 83.U.S. Department of Agriculture Agricultural Research Service. USDA Food and Nutrient Database for Dietary Studies 2011-2012. Beltsville, MD: U.S. Department of Agriculture, 2014. [Google Scholar]
- 84.Ahuja JKA, Montville JB, Omolewa-Tomobi G, Heendeniya KY, Martin CL, Steinfeldt LC, et al. USDA Food and Nutrient Database for Dietary Studies, 5.0. Beltsville, MD: U.S. Department of Agriculture, Agricultural Research Service, Food Surveys and Research Group, 2012. [Google Scholar]
- 85.Kotlikoff LJ, Summers LH. Tax Incidence. In: Auerbach AJ, Feldstein M, editors. The Handbook of Public Economics. Amdsterdam: Elsevier Science; 1987. p. 1043–92. [Google Scholar]
- 86.Berardi N, Sevestre P, Tepaut M, Vigneron A. The impact of a ‘soda tax’ on prices: Evidence from French micro data. Working paper No. 415. Paris, France: Banque de France, 2012. http://ssrn.com/abstract=2192470. [Google Scholar]
- 87.Guthrie A Mexico soda tax dents Coke bottler’s sales: Coca-Cola Femsa says Mexican sales volume has fallen more than 5% this year. New York, NY: WSJ.com. Dow Jones and Company, Inc., 2014. updated February 26 http://online.wsj.com/articles/SB10001424052702303801304579407322914779400. [Google Scholar]
- 88.National Policy and Legal Analysis Network to Prevent Obesity (NPLAN). Model sugar-sweetened beverage tax legislation. Oakland: Public Health Law and Policy, 2010. http://www.nplanonline.org/childhood-obesity/products/model-SSB-tax-legislation. [Google Scholar]
- 89.Te Morenga L, Mallard S, Mann J. Dietary sugars and body weight: systematic review and meta-analyses of randomised controlled trials and cohort studies. BMJ 2013;346:e7492. [DOI] [PubMed] [Google Scholar]
- 90.Bray GA. Soft drink consumption and obesity: it is all about fructose. Curr Opin Lipidol 2010;21(1):51–7. [DOI] [PubMed] [Google Scholar]
- 91.Libuda L, Kersting M. Soft drinks and body weight development in childhood: is there a relationship? Curr Opin Clin Nutr Metab Care 2009;12(6):596–600. [DOI] [PubMed] [Google Scholar]
- 92.Malik VS, Willett WC, Hu FB. Sugar-sweetened beverages and BMI in children and adolescents: reanalyses of a meta-analysis. Am J Clin Nutr 2009;89(1):438–9; author reply 9–40. [DOI] [PubMed] [Google Scholar]
- 93.van Baak MA, Astrup A. Consumption of sugars and body weight. Obes Rev 2009;10 Suppl 1:9–23. [DOI] [PubMed] [Google Scholar]
- 94.Olsen NJ, Heitmann BL. Intake of calorically sweetened beverages and obesity. Obes Rev 2009;10(1):68–75. [DOI] [PubMed] [Google Scholar]
- 95.Gibson S Sugar-sweetened soft drinks and obesity: a systematic review of the evidence from observational studies and interventions. Nutr Res Rev 2008;21(2):134–47. [DOI] [PubMed] [Google Scholar]
- 96.Forshee RA, Anderson PA, Storey ML. Sugar-sweetened beverages and body mass index in children and adolescents: a meta-analysis. Am J Clin Nutr 2008;87(6):1662–71. [DOI] [PubMed] [Google Scholar]
- 97.Harrington S The role of sugar-sweetened beverage consumption in adolescent obesity: a review of the literature. J Sch Nurs 2008;24(1):3–12. [DOI] [PubMed] [Google Scholar]
- 98.Drewnowski A, Bellisle F. Liquid calories, sugar, and body weight. Am J Clin Nutr 2007;85(3):651–61. [DOI] [PubMed] [Google Scholar]
- 99.Levy DT, Friend KB, Wang YC. A review of the literature on policies directed at the youth consumption of sugar sweetened beverages. Adv Nutr 2011;2(2):182S–200S. [DOI] [PMC free article] [PubMed] [Google Scholar]
- 100.Crawford M, Church J. CPI Detailed Report: Data for July 2014. Washington, D.C.: U.S. Department of Labor, Bureau of Labor Statistics, 2014. [Google Scholar]
- 101.Striegel-Moore RH, Thompson D, Affenito SG, Franko DL, Obarzanek E, Barton BA, et al. Correlates of beverage intake in adolescent girls: the National Heart, Lung, and Blood Institute Growth and Health Study. J Pediatr 2006;148(2):183–7. [DOI] [PubMed] [Google Scholar]
- 102.DiMeglio DP, Mattes RD. Liquid versus solid carbohydrate: effects on food intake and body weight. Int J Obes Relat Metab Disord 2000;24(6):794–800. [DOI] [PubMed] [Google Scholar]
- 103.Tordoff MG, Alleva AM. Effect of drinking soda sweetened with aspartame or high-fructose corn syrup on food intake and body weight. Am J Clin Nutr 1990;51(6):963–9. [DOI] [PubMed] [Google Scholar]
- 104.Van Wymelbeke V, Beridot-Therond ME, de La Gueronniere V, Fantino M. Influence of repeated consumption of beverages containing sucrose or intense sweeteners on food intake. Eur J Clin Nutr 2004;58(1):154–61. [DOI] [PubMed] [Google Scholar]
- 105.Reid M, Hammersley R, Hill AJ, Skidmore P. Long-term dietary compensation for added sugar: effects of supplementary sucrose drinks over a 4-week period. Br J Nutr 2007;97(1):193–203. [DOI] [PubMed] [Google Scholar]
- 106.Smith TA, Lin BH, Lee JY. Taxing caloric sweetened beverages: potential effects on beverage consumption, calorie intake, and obesity. Washington, D.C.: U.S. Department of Agriculture, Economic Research Service, 2010. Contract No.: ERR-100. [Google Scholar]
- 107.Hall KD. Mechanisms of metabolic fuel selection: modeling human metabolism and body-weight change. Engineering in Medicine and Biology Magazine. 2010:36–41. [DOI] [PubMed] [Google Scholar]
- 108.Joint FAO/WHO/UNU Expert Consultation. Human energy requirements. Rome: Food and Nutrition Organization, United Nations, 2001. [Google Scholar]
- 109.Hoos MB, Gerver WJ, Kester AD, Westerterp KR. Physical activity levels in children and adolescents. Int J Obes Relat Metab Disord 2003;27(5):605–9. [DOI] [PubMed] [Google Scholar]
- 110.Brown MG. Impact of income on price and income responses in the differential demand system. J Agr Appl Econ 2008;40(2):593–608. [Google Scholar]
- 111.Zheng Y, Kaiser HM. Advertising demand and U.S. nonalcoholic beverage demand. Agr Resource Econ Rev 2008;37(2):147–59. [Google Scholar]
- 112.Zheng Y, Kaiser HM. Estimating asymmetric advertising response: an application to U.S. nonalcoholic beverage demand. J Agr Appl Econ 2008;40(3):837–49. [Google Scholar]
- 113.Fletcher JM, Frisvold D, Tefft N. Taxing soft drinks and restricting access to vending machines to curb child obesity. Health Aff (Millwood) 2010;29(5):1059–66. [DOI] [PubMed] [Google Scholar]
- 114.Zheng Y, Kinnucan H, Kaiser H. Measuring and testing advertising-induced rotation in the demand curve. Appl Econ 2010;42:1601–14. [Google Scholar]
- 115.Dharmasena S, Capps O Jr. Intended and unintended consequences of a proposed national tax on sugar-sweetened beverages to combat the U.S. obesity problem. Health Econ 2012;21(6):669–94. [DOI] [PubMed] [Google Scholar]
- 116.Lin BH, Smith TA, Lee JY, Hall KD. Measuring weight outcomes for obesity intervention strategies: the case of a sugar-sweetened beverage tax. Econ Hum Biol 2011;9(4):329–41. [DOI] [PubMed] [Google Scholar]
- 117.Zhen C, Wohlgenant MK, Karns S, Kaufman P. Habit formation and demand for sugar-sweetened beverages. Am J Agr Econ 2011;93(1):175–93. [Google Scholar]