

Abstract

Microfluidic paper-based analytical devices (μPADs) are promising biosensors that may be used in a variety of bioanalytical applications. A μPAD for automating the competitive enzyme-linked immunosorbent assay (ELISA) of small-sized target detection at the femtogram level using submicroliter samples is reported in this study. The proposed μPAD was integrated with a sucrose valve to automate the sequential delivery of reagents, providing simple control of reagent delivery time and simple operation. The use of a sample solution dropping location at the zones on the device that had been prepared with an antibody-conjugated enzyme before immersion in a running buffer allowed minimization of sample volume to 0.6 μL, while eliminating the possible loss of a target molecule by adsorption on the membrane, thus improving detection sensitivity. Furthermore, the proposed device was successfully applied to the automation of competitive ELISA for the detection of aflatoxin B1 (AFB1), a potent carcinogen that causes substantial health risks to humans worldwide, with a detection limit of 60 femtograms or 0.1 ng/mL. The method developed in this study provides high sensitivity, small sample volume, on-site and equipment-free measurements, low-cost operation, and user-friendliness. This approach could be used to analyze small-sized molecules in the fields of food safety and quality control, environmental monitoring, and clinical diagnostics.
Introduction
Increasing the biosensor sensitivity yields important benefits for bioanalytical applications. These benefits include improvement to health outcomes and survival rates; for example, early stage cancer detection can facilitate diagnosis and treatment1 and food toxin monitoring can be used to support public health by assuring food safety.2 Consequently, identifying a new analytical method for improving the sensitivity of biosensor applications is crucial.
Aflatoxin B1 (AFB1) is a highly toxic mycotoxin produced mainly by the ubiquitous soil filamentous fungus Aspergillus flavus.3 AFB1 contamination in foods (e.g., cereals, rice, nuts, and corn) is a worldwide health concern.4,5 Because of its toxic, mutagenic, immunotoxic, teratogenic, and carcinogenic effects on humans and animals, AFB1 is classified as a group 1 carcinogen by the International Agency for Research on Cancer (IARC) classification of carcinogenic substances.6 Therefore, monitoring the content of AFB1 is important for public health.
Enzyme-linked immunosorbent assay (ELISA) offers high specificity and high sensitivity through signal amplification by enzyme and substrate. Because of the small molecular structure of the AFB1 antigen, which prevents the simultaneous binding of two antibodies,7 competitive ELISA has been commonly used for AFB1 detection. Despite the benefits of sensitivity and specificity, standard ELISA that is based on 96-microwell plates often requires labor-intensive and time-consuming procedures with skilled operators and spectroscopic instrumentation,8 which are not suitable for on-site detection and general users.
Immunochromatographic test strips or an immunochromatographic assay (ICA) have been reported for AFB1 detection.9−12 However, the sensitivity of one step-ICA without amplification is relatively low, and high-sensitivity ICA with signal amplification requires multistep operations.
Microfluidic paper-based analytical devices (μPADs) were pioneered by Whitesides et al. in 2007.13 Owing to their low cost, ease of use, and portability, μPADs have been increasingly used in various analytical applications in the biomedical, environmental, clinical analysis, food processing, and chemical industry fields.14,15 Existing μPADs have been associated with several detection methods, including electrochemistry,16,17 colorimetry,18,19 fluorescence,20 and electrochemiluminescence.21 Among these methods, colorimetry has been the most commonly used because it is simple, easy to operate, and meets the basic needs for on-site detection without complex equipment.22
Although many colorimetric ELISA μPADs provide ease of use, rapidity, cost-effectiveness, and portability, only a few have been specifically designed for detecting small targets,23,24 particularly in relation to monitoring AFB1 content using competitive ELISA.25
Our group previously developed the first automated sandwich ELISA for an inkjet-printed μPAD.26 This μPAD used baffle lines to automate the sequential delivery of reagents based on the migration time differences between fluids in the nondelaying and delaying channels. The number of baffles increased the delay between the two substances arriving at the test zone. The device required only a single sample application, directly immersing the device into a sample solution, to run the entire assay. The intensity of the insoluble color product from an alkaline phosphatase (ALP) reaction was used to determine the level of human chorionic gonadotropin (hCG) on the μPAD. The device achieved fully automated-sandwich ELISA with a limit of detection (LOD) of 1 ng/mL, using 70 μL of sample solution. The automated-competitive ELISA μPAD, however, was not well studied.
Dissolvable materials have been utilized to delay flow on μPADs, such as pullulan film,27 surfactant,24 wax,28 and sugar.29 Yager et al. reported on the use of dissolvable sucrose on paper to create programmable flow delays to program automated multistep fluidic protocols.29 We employed this dissolvable sucrose valve to improve the usability of our device by controlling the reagent delivery time without the need for changes to the structural design of the device.
In this study, a novel automated enzyme-enhanced competitive ELISA μPAD integrated sucrose valve was developed for aflatoxin B1 detection at the femtogram level using a submicroliter sample (0.6 μL). We achieved high sensitivity and minimized sample volume simultaneously by using a new sample-loading method: directly applying the sample solution at the zones on the device that had been prepared with an antibody-conjugated enzyme before immersion in a running buffer.
Experimental Section
Chemicals and Reagents
Analytical-grade reagents and 18 MΩ·cm resistance water (obtained from a Barnstrad Milli-Q purification system) were used throughout the experiments. Nitrocellulose membrane (Immunopore RP, code number 78356403) was purchased from GE Healthcare Japan Ltd. Absorbent pads (CFSP203000) were purchased from the EMD Millipore Corporation. The BCIP/NBT (5-bromo-4-chloro-39-indolyphosphate p-toluidine salt, nitro-blue tetrazolium chloride) substrate solution, substrate buffer solution, and methanol were purchased from Nacalai Tesque (Kyoto, Japan). An alkaline phosphatase-labeling kit was purchased from Dojindo (Rockford, IL, U.S.A.). Aflatoxin B1–BSA conjugate from Aspergillus flavus (AFB1–BSA), aflatoxin B1 antigen (AFB1), and bovine serum albumin (BSA) were purchased from Sigma-Aldrich (St. Louis, MO, U.S.A.). Anti-aflatoxin B1 antibody and goat anti-mouse IgG H&L were purchased from Abcam (Cambridge, U.K.). Boric acid, casein, sucrose, polyoxyethylene (20), sorbitan monolaurate (Tween 20), tris(hydroxymethyl)aminomethane, and sodium hydroxide were purchased from Wako (Wako Pure Chemical Industries, Japan).
Instruments
The AFB1 detection results on the paper-based devices were imaged using a desktop scanner (LiDE 220 Scanner, Canon Inc., Japan) that operated at −50 brightness and +20 contrast and then analyzed with the ImageJ software (National Institutes of Health, Bethesda, MD) to determine the gray intensity values. The nitrocellulose membrane (NCM) was engraved using a laser (VLS 3.50, Universal Laser Systems, Scottsdale, AZ). A digital hot plate/stirrer PMC 720 series was purchased from Barnstead Thermolyne Corporation and used to dry the sucrose valve on the paper-based device. An oven was purchased from Yamato (Yamato DKN301, Japan) and used to dry the nitrocellulose membrane.
Automated Sequential Delivery of Reagents Using a Sucrose Valve
To demonstrate the automated sequential delivery of reagents using a sucrose valve, a yellow and red dye were used. The yellow dye was dropped into zones located within the non-delayed channels, between points 1 and 1.5 cm from the bottom of the device. This zone is also the application point for antibody-conjugated enzymes (ALP-Ab), so is also called the ALP-Ab zone. The red dye was dropped into the BCIP/NBT substrate zone, which is located inside the temporary delayed channel. After drying for 10 min, the device was immersed in 70 μL of water. Reagent delivery time was studied using sucrose solutions at 0, 20, 40, 60, 80, 90, and 100% (w/v). The image and video of the device during the experiments were recorded using a digital camera (G9X, Canon Inc., Japan).
Preparation of Reagents for AFB1 Competitive ELISA
AFB1–BSA and anti-mouse IgG were prepared in 50 mM Tris-HCl buffer (pH 7.6) at 1 and 0.125 mg/mL, respectively. The ALP-anti-AFB1 mAb (ALP-Ab) was conjugated using an alkaline phosphatase-labeling kit purchased from Dojindo (Rockford, IL, U.S.A.) according to the manufacturer’s instructions, and prepared at 10 μg/mL with 50 mM Tris-HCl buffer (pH 7.6) containing 1% (v/v) BSA. The BCIP/NBT substrate was prepared in a substrate buffer solution (1:4 dilution). The running buffer was prepared with the substrate buffer containing 20% (v/v) methanol and 0.1% (v/v) BSA, and 70 μL of solution was placed into the microwells for each experiment. Test sample solutions were prepared by diluting the AFB1 solution with running buffer. The sucrose solution was prepared in 18 MΩ·cm resistance water at 80% (w/v). The blocking solution was 50 mM boric acid buffer with 1% (w/v) casein (pH 8.5), and the washing solution was 20 mM Tris-HCl buffer (pH 7.6) with 0.1% (v/v) Tween.
Automated Paper-Based Device Fabrication for Competitive ELISA of AFB1
A ready-to-use device consisted of a reaction pad and an absorbent pad, as shown in Figure 1a. The proposed device was designed to have a reaction pad size of 5 mm in width and 2.5 cm in length. The pattern of the reaction pad was designed using CorelDRAW (Corel Corporation), and the NCM was engraved by a laser. The membrane was then cleaned by dipping in water for 30 min and drying at 37 °C for 30 min before the immobilization of reagents. The test and control zones of the device were prepared by spotting 0.3 μL of 0.5 mg/mL of AFB1–BSA and goat anti-mouse IgG (0.125 mg/mL) in 50 mM Tris-HCl buffer (pH 7.6). After drying for 30 min at room temperature, the membrane was treated with blocking and washing solution for 30 min at room temperature, then dried overnight. The absorbent pad was attached to the membrane using a regular office stapler. The sucrose valve was applied by dropping 0.6 μL of 80% w/v sucrose solution and allowed to dry for 30 min at room temperature. The ALP-Ab (0.3 μL at 10 μg/mL) and the BCIP/NBT substrate (0.6 μL at 1:4 dilution) were spotted by hand and dried at room temperature for 10 min.
Figure 1.
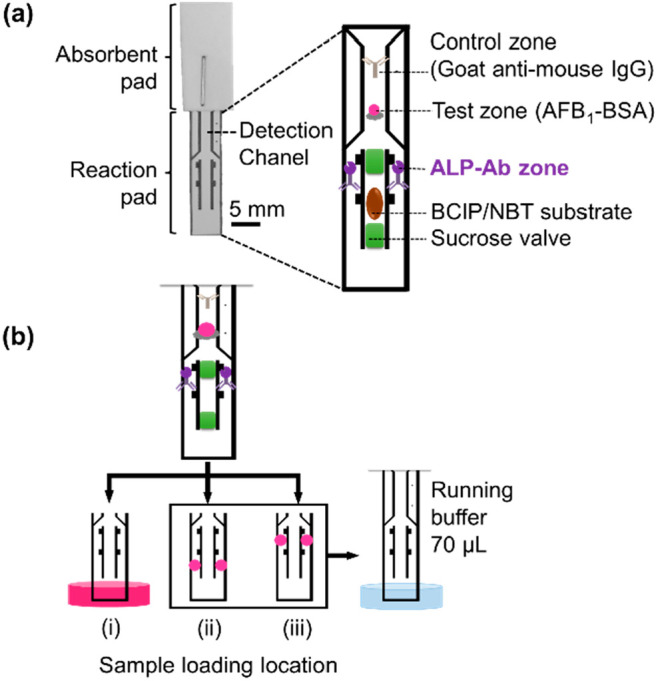
Schematic illustration of the reagent locations on paper-based devices. (a) A ready-to-use paper-based device. All of the reagents, including AFB1–BSA (control zone), ALP–anti-AFB1 mAb (ALP-Ab zone), BCIP/NBT substrate, and sucrose valves, were dropped onto the reaction pad. The reaction pad was attached to the absorbent pad using a standard office stapler. Before use, a sample solution was dropped at the ALP-Ab zone, then the device was immersed in a running buffer. (b) Experimental design to study the effect of the sample-loading location: (i) immersing the device in 70 μL of AFB1 sample; (ii) dropping 0.3 μL of AFB1 sample at 1 mm below each ALP-Ab zone before immersing the device into running buffer; and (iii) dropping 0.3 μL of AFB1 sample at each ALP-Ab zone before immersing the device into a running buffer.
Effect of Sample-Loading Location
To study the effect of sample-loading locations, the devices were prepared with an 80% w/v sucrose valve and 10 μg/mL of ALP-Ab at 0.6 μL. As shown in Figure 1b, sample solutions were placed in three different locations: 70 μL in a well plate (i), 0.6 μL on the membrane at a location 1 mm below the ALP-Ab zones (ii), and 0.6 μL on the membrane at the ALP-Ab zones (iii). In case (i), the device was dipped into a well plate of the sample solution, and ALP-Ab was delivered to the detection channel by capillary flow of the sample solution. In cases (ii) and (iii), after loading the sample solution, the device was dipped into a well plate containing 70 μL of running buffer, and ALP-Ab and the sample solution were delivered to the detection channel by capillary flow. After the solutions were loaded (70 μL of sample or running buffer), the BCIP/NBT substrate (1.5 μL) was manually dropped to cover the detection channel on the device to complete the enzymatic reaction and signal visualization. This manually applied substrate was used to clearly observe the sensitivity influenced by the immunoreaction between the sample antigen and ALP-Ab.
Optimizing Antibody-Conjugated Enzyme Concentration
To optimize the concentration of the ALP-Ab, the sample solutions (blank and 0.1 ng/mL AFB1) were dropped at the ALP-Ab zones, prepared with ALP-Ab at 5, 10, 15, 20, and 25 μg/mL. After immersing the device in 70 μL of the running buffer, the BCIP/NBT substrate (1.5 μL) was manually applied to cover the detection channel on the device.
AFB1 Determination Using the Automated Paper-Based Device
The sample solution containing the AFB1 antigen (0.3 μL each) was applied to the ALP-Ab zones that were prepared by ALP-Ab at 10 μg/mL on a ready-to-use device. The device was then immersed in 70 μL of running buffer.
Results and Discussion
Automated Sequential Delivery of Reagents Using a Sucrose Valve
To demonstrate the automated sequential delivery of reagents using a sucrose valve, a yellow dye was dropped at the non-delayed channel and red dye was dropped at the temporary-delayed channel. Figure 2a shows a schematic illustration of the automated sequential delivery of reagents using a sucrose valve in three steps: immunoreaction, sucrose valve opening, and enzymatic reaction. Automated sequential delivery of reagents was initiated after the device was immersed in solution. The yellow arrow represents the flow of sample antigen and ALP-Ab. The red arrow represents the flow of the BCIP/NBT substrate. In STEP 1, the solution initially flows through the device, allowing antigen and ALP-Ab to flow to the detection channel and enable immunoreaction. In STEP 2, the sucrose valves (green arrow) were sequentially dissolved and opened by the solution. In STEP 3, the substrate is released into the detection channel, facilitating the enzymatic reaction for signal amplification.
Figure 2.

Automated sequential delivery of reagents using a sucrose valve. (a) Schematic illustration of automated sequential delivery of reagents using a sucrose valve in three steps. (b) Images of the automated paper-based device using an 80% w/v sucrose valve after immersing the device (with dyes) in the solution from 0–530 s. (c) Correlation between reagent (dyes) delivery time and concentration of the sucrose valve; the data are derived from three repeated tests.
To confirm the automated sequential delivery of reagents using a sucrose valve, the device was prepared using 80% w/v sucrose valve, red dye, and yellow dye. A video of the automated solution flow is shown in the Supporting Information. After loading 70 μL of water, the solution flowed by capillary force from the bottom of the device to the absorbent pad. As shown in Figure 2b, the solution moved through the non-delayed channel, where the ALP-Ab was initially present. At approximately 20 s, the yellow dye, which represented the complex of antigen and ALP-Ab, rapidly migrated to the detection channel, allowing STEP 1 for the immunoreaction. Simultaneously, the solution flowed through the sucrose valves inside the temporally delayed channel. The sucrose valves were sequentially dissolved and opened in STEP 2. Finally, in STEP 3 for the enzymatic reaction, the red dye, which represented the BCIP/NBT substrate, was automatically released into the detection channel at approximately 184 s. These results indicated that integrating 80% (w/v) sucrose valves could successfully delay the red-dye delivery time by approximately 164 s compared to the delivery time of the device without sucrose valves. As a result, sucrose valve integration enabled automated sequential delivery of reagents, allowing for a user-friendly device that was capable of automating multistep assays.
The reagent delivery time was studied using sucrose concentrations of 0, 20, 40, 60, 80, 90, and 100% (w/v) on the device. Figure 2c shows the correlation between the reagent (dye) delivery time and the sucrose valve concentration. As expected, the delivery time of the red dye inside the middle channel increased with increasing concentration of the applied sucrose valve. The relatively large variation at high concentrations of sucrose was possibly due to less effective penetration of high-viscosity solutions into the NCM pores, and less uniform sucrose crystallization during valve drying. This reduced performance in the high-concentration valve could be improved by combining sucrose with fructose for better penetration and crystallization.30 These results confirm that the sequential delivery of the reagent was simply controlled by adjusting the concentration of the sucrose valve without adjusting the physical pattern of the paper-based device. For further experiments using competitive ELISA for AFB1 detection, an 80% (w/v) sucrose valve was selected to automate the sequential delivery of reagents.
Effect of Sample-Loading Location
To study the effect of the sample-loading location, three different locations were used for sample loading: in a well plate (i), on the membrane below the ALP-Ab zones (ii), and at the ALP-Ab zones (iii). In case (i), the device was dipped into a well plate of the sample solution, and ALP-Ab was delivered to the detection channel by capillary flow of the sample solution. In cases (ii) and (iii), after loading the sample solution, the device was dipped into a well plate containing 70 μL of running buffer, and ALP-Ab and the sample solution were delivered to the detection channel through capillary flow. As shown in Figure 3, when 70 μL of sample solution was loaded into a well plate, there was a very small difference in intensity (Δ = 11 a.u.) in the test zones of the devices between the blank and 10 ng/mL AFB1 samples. Similarly, when 0.6 μL of sample solution was dropped on the membrane at locations below the ALP-Ab zones, the difference in intensity at the device test zones between blank and 10 ng/mL AFB1 samples was relatively small (Δ = 14 a.u.). However, when 0.6 μL of sample solution was dropped on the membrane directly in the ALP-Ab zones, the difference in intensity at the test zones between blank and 10 ng/mL AFB1 samples was significantly increased (Δ = 30 a.u.), demonstrating improved reaction and sensitivity.
Figure 3.

Effect of sample-loading location. (a) Paper-based device images and (b) plots of the mean color intensity of AFB1 competitive ELISA when sample solutions were placed in three different locations: 70 μL in a well plate (i), 0.6 μL on the membrane at a location below the ALP-Ab zones (ii), and at the ALP-Ab zones (iii). The data are derived from three repeated tests. The Δ value represents the mean intensity difference between the blank and 10 ng/mL samples. CZ, BG, and TZ represent the control zone, the background zone, and the test zone, respectively.
Larger sample volumes are frequently required to achieve higher sensitivity because of sample losses during transport on the membrane.31 Our method showed simultaneously higher sensitivity and minimized sample volume by using the same zones of the ALP-Ab for the sample loading location.
To investigate the mechanism of high sensitivity in case (iii), a mixture solution containing the sample (70 μL) and ALP-Ab (0.6 μL) was used with a simple device (without prepared ALP-Ab and BCIP/NBT on the membrane), as shown in Figure S1(a). The test zone signal on the device was almost unnoticeable to the naked eye at 10 ng/mL AFB1, as shown in Figure S1(b). The difference in intensity at the test zones between the blank and 10 ng/mL AFB1 samples was significant (Δ = 47 a.u.), as shown in Figure S1(c), indicating a sufficient reaction between AFB1 and ALP-Ab in the well plate.
In cases (i) and (ii), the insufficient reaction and low sensitivity may have resulted from a loss of the antigen sample by adsorption on the membrane, from loading sample antigens in a well plate and on the membrane at the location below the ALP-Ab zones. As AFB1 is generally soluble in moderately polar organic solvents (e.g., methanol or chloroform) and scarcely soluble in water,32,33 a portion of these sample AFB1 antigens could have become trapped on the membrane and unable to flow to bind with antibodies at the upper locations. In case (iii), by dropping the sample solution directly at the same location as the Ab-ALP zones, AFB1 was able to bind with ALP-Ab immediately. Binding with ALP-Ab may have improved the solubility of the AFB1 and suppressed adsorption onto the membrane. This could have reduced the possible loss of the AFB1. More sample dropping positions on the membrane were investigated as shown in Figure S2. The difference in intensity at the test zones was highest (Δ = 32 a.u.) when the ALP-Ab and sample positions were totally overlapped, confirming the most sufficient position to improve reaction. By using only the same zones of the ALP-Ab for sample loading, improved reaction and sensitivity were achieved without any need for changes to the reaction components or structural design of the device.
Optimization of the Antibody-Conjugated Enzyme Concentration
Since the concentration of ALP-Ab affects the sensitivity and LOD of the device, optimization of ALP-Ab concentration was necessary. Different concentrations of ALP-Ab were examined, including concentrations of 5, 10, 15, 20, and 25 μg/mL. As shown in Figure 4, the results demonstrated that a concentration of 10 μg/mL ALP-Ab provided the largest difference in color intensity in the test zone between the blank and 0.1 ng/mL. This is an indication of the highest sensitivity for competitive ELISA of AFB1. As a result, an ALP-Ab concentration of 10 μg/mL was chosen for preparing the automated paper-based device.
Figure 4.

Antibody optimization. (a) Images of the paper-based device and (b) plots of the mean color intensity of the AFB1 competitive ELISA at 0.1 ng/mL, using different antibody concentrations. The data are derived from three identical tests.
AFB1 Determination Using the Automated Paper-Based Device
Automated competitive ELISA for the determination of AFB1 was conducted after obtaining the optimal conditions by loading the standard AFB1 in the ALP-Ab zones. Figure 5a illustrates the results of competitive ELISA testing samples at different concentrations (0–10000 ng/mL AFB1) on our devices.
Figure 5.

Automated competitive ELISA for the determination of AFB1. (a) Images of the paper-based devices and (b) the calibration curve of AFB1 competitive ELISA from 0 to 10000 ng/mL using automated delivery of reagents by a sucrose valve at 80% w/v. Data were derived from three identical tests.
The blank, 0.01 ng/mL, and 0.1 ng/mL samples resulted in the most significant color intensity change at the test zone. The color intensity decreased in the 1 to 10000 ng/mL samples. Figure 5b shows the standard curves fitted to logarithmic regressions with correlation coefficients (R2 = 0.9438) throughout the concentration range of 0.01–10000 ng/mL. The LOD was calculated to be 0.1 ng/mL, based on the concentration equivalent to the mean of the blank sample minus the triple standard deviation. The coefficient of variation (CV, the ratio of the standard deviation to the mean of signal intensity) of AFB1 at 1 ng/mL (n = 3) was 8.0%.
To demonstrate the performance of the device, real sample measurement was also done as shown in Figure S3. A sample of soy sauce was spiked with AFB1 and analyzed by our device. The LOD in soy sauce was calculated to be 4.8 ng/mL. The recovery from the spiked soy sauce sample at 5 ng/mL (n = 3) was found to be 91.3 ± 7.2%, as shown in Table S1.
The maximum residue limits (MRLs) for AFB1 depend on the type of product and country.34,35 However, the most common limit for AFB1 is 5 μg/kg (or 5 ng/mL) in food and animal feed.36 Our device achieved an LOD of 0.1 ng/mL from Figure 5, which is 50× lower than common regulatory limits of AFB1. Our device achieved simple operation, low-volume sample, and high sensitivity. Simple two-step operation required a user to drop the sample, and immerse the device in a running buffer. Extremely low-volume samples (0.6 μL) could be greatly beneficial in a variety of applications, particularly when dealing with rare or small quantities of samples and reagents, such as biomarkers in blood, saliva, and tears. The proposed device provided high sensitivity at the femtogram level. Based on a sample volume of 0.6 μL and an LOD of 0.1 ng/mL, the lowest detectable amount of AFB1 was calculated to be 60 fg, which is 2–4 orders of magnitude lower than other reported paper-based devices for AFB1 detection, as shown in Table 1.
Table 1. Comparison of Reported Paper-Based Devices for AFB1 Detectiona.
| device | detection method | user operation | sample volume (μL) | LOD (ng/mL) | LOD (g) | ref |
|---|---|---|---|---|---|---|
| ICA test strip | enzyme-catalyzed chemiluminescence | multistep | 50 | 0.15 | 7.5 × 10⁻¹² | (9) |
| ICA test strip | fluorescent microspheres probe | two-step | 100 | 2.5 | 2.5 × 10⁻¹⁰ | (10) |
| ICA test strip | colorimetric | one-step | 50 | 0.1 | 5.0 × 10⁻¹² | (11) |
| ICA test strip | colorimetric | one-step | 100 | 0.25 | 2.5 × 10⁻¹¹ | (12) |
| PAD | colorimetric | one-step | 10 | 2.7 | 2.70 × 10⁻¹¹ | (37) |
| μPAD | colorimetric | multistep | 20 | 9.45 | 1.89 × 10⁻¹⁰ | (38) |
| μPAD | colorimetric ELISA | two-step | 50 | 1.31 | 6.55 × 10⁻¹¹ | (25) |
| μPAD | colorimetric ELISA | two-step | 0.6 | 0.1 | 6.0 × 10⁻¹⁴ | this work |
ICA: immunochromatography assay; multistep: three or more steps, manual operation.
Conclusions
A novel automated enzyme-enhanced type competitive ELISA μPAD integrated sucrose valve was developed to improve sensitivity for simple and portable quantitative measurements of AFB1, while minimizing sample volume by directly applying sample solution to specific device zones that had been prepared with an antibody-conjugated enzyme. The use of a sucrose valve for the automation of sequential delivery of reagents provided excellent feasibility for the device, as the reagent delivery time can be simply controlled by adjusting the concentration of the applied sucrose solution. The use of the sample solution dropping location at the zones on the device, which had been prepared with an antibody-conjugated enzyme before immersing in a running buffer, allowed the minimization of the sample volume to 0.6 μL while enhancing the sensitivity of the detection. The proposed device enabled an automated quantitative measurement with a calculated LOD of 0.1 ng/mL. Consequently, the device offers an alternative approach to small-molecule detection, providing low-cost, small sample volume, user-friendliness, on-site, and equipment-free measurements, portability, and high sensitivity.
Acknowledgments
This work was supported by JSPS KAKENHI (Grant Number JP20H02592). The authors would like to thank Mr. Taniguchi Shunpei from the Design Research Lab, School of Knowledge Science, JAIST, for his assistance with the instruments, and the laser cutting facility consulting.
Supporting Information Available
The Supporting Information is available free of charge at https://pubs.acs.org/doi/10.1021/acs.analchem.1c05401.
Author Contributions
All authors have given approval to the final version of the manuscript.
The authors declare no competing financial interest.
Supplementary Material
References
- Schubert S. M.; Arendt L. M.; Zhou W.; Baig S.; Walter S. R.; Buchsbaum R. J.; Kuperwasser C.; Walt D. R. Sci. Rep. 2015, 5, 11034–11034. 10.1038/srep11034. [DOI] [PMC free article] [PubMed] [Google Scholar]
- Chai C.; Oh S. W. Food Science and Biotechnology 2020, 29 (7), 879–887. 10.1007/s10068-020-00776-w. [DOI] [PMC free article] [PubMed] [Google Scholar]
- Alshannaq A. F.; Gibbons J. G.; Lee M.-K.; Han K.-H.; Hong S.-B.; Yu J.-H. Sci. Rep. 2018, 8, 16871. 10.1038/s41598-018-35246-1. [DOI] [PMC free article] [PubMed] [Google Scholar]
- Zhang W.; Liu Y.; Liang B.; Zhang Y.; Zhong X.; Luo X.; Huang J.; Wang Y.; Cheng W.; Chen K. Sci. Rep. 2020, 10 (1), 7973. 10.1038/s41598-020-64295-8. [DOI] [PMC free article] [PubMed] [Google Scholar]
- Ok H. E.; Kim H. J.; Shim W. B.; Lee H.; Bae D. H.; Chung D. H.; Chun H. S. Journal of Food Protection 2007, 70 (12), 2824–2828. 10.4315/0362-028X-70.12.2824. [DOI] [PubMed] [Google Scholar]
- Jallow A.; Xie H.; Tang X.; Qi Z.; Li P. Comprehensive reviews in food science and food safety 2021, 20 (3), 2332–2381. 10.1111/1541-4337.12734. [DOI] [PubMed] [Google Scholar]
- Pietschmann J.; Spiegel H.; Krause H. J.; Schillberg S.; Schröper F. Toxins 2020, 12 (5), 337. 10.3390/toxins12050337. [DOI] [PMC free article] [PubMed] [Google Scholar]
- Liu D.; Li X.; Zhou J.; Liu S.; Tian T.; Song Y.; Zhu Z.; Zhou L.; Ji T.; Yang C. Biosens. Bioelectron. 2017, 96, 332–338. 10.1016/j.bios.2017.04.044. [DOI] [PubMed] [Google Scholar]
- Zangheri M.; Di Nardo F.; Anfossi L.; Giovannoli C.; Baggiani C.; Roda A.; Mirasoli M. Analyst 2015, 140 (1), 358–365. 10.1039/C4AN01613K. [DOI] [PubMed] [Google Scholar]
- Liu D.; Huang Y.; Chen M.; Wang S.; Liu K.; Lai W. Food Control 2015, 50, 659–662. 10.1016/j.foodcont.2014.10.011. [DOI] [Google Scholar]
- Liao J.-Y.; Li H. Microchimica Acta volume 2010, 171 (3–4), 289–295. 10.1007/s00604-010-0431-0. [DOI] [Google Scholar]
- Li X.; Li P.; Zhang Q.; Li R.; Zhang W.; Zhang Z.; Ding X.; Tang X. Biosens. Bioelectron. 2013, 49, 426–432. 10.1016/j.bios.2013.05.039. [DOI] [PubMed] [Google Scholar]
- Martinez A. W.; Phillips S. T.; Butte M. J.; Whitesides G. M. Angewandte Chemie (International ed. in English) 2007, 46 (8), 1318–1320. 10.1002/anie.200603817. [DOI] [PMC free article] [PubMed] [Google Scholar]
- Morbioli G. G.; Mazzu-Nascimento T.; Stockton A. M.; Carrilho E. Anal. Chim. Acta 2017, 970, 1–22. 10.1016/j.aca.2017.03.037. [DOI] [PubMed] [Google Scholar]
- Fu L.-M.; Wang Y.-N. TrAC Trends in Analytical Chemistry 2018, 107, 196–211. 10.1016/j.trac.2018.08.018. [DOI] [Google Scholar]
- Wonsawat W.; Limvongjaroen S.; Supromma S.; Panphut W.; Ruecha N.; Ratnarathorn N.; Dungchai W. Analyst 2020, 145 (13), 4637–4645. 10.1039/D0AN00515K. [DOI] [PubMed] [Google Scholar]
- Dungchai W.; Chailapakul O.; Henry C. S. Anal. Chem. 2009, 81 (14), 5821–5826. 10.1021/ac9007573. [DOI] [PubMed] [Google Scholar]
- Preechakasedkit P.; Siangproh W.; Khongchareonporn N.; Ngamrojanavanich N.; Chailapakul O. Biosens. Bioelectron. 2018, 102, 27–32. 10.1016/j.bios.2017.10.051. [DOI] [PubMed] [Google Scholar]
- Chaiyo S.; Kalcher K.; Apilux A.; Chailapakul O.; Siangproh W. Analyst 2018, 143 (22), 5453–5460. 10.1039/C8AN01122B. [DOI] [PubMed] [Google Scholar]
- Taudte R. V.; Beavis A.; Wilson-Wilde L.; Roux C.; Doble P.; Blanes L. Lab Chip 2013, 13 (21), 4164–4172. 10.1039/c3lc50609f. [DOI] [PubMed] [Google Scholar]
- Li L.; Li W.; Ma C.; Yang H.; Ge S.; Yu J. Sensors & Actuators B: Chemical 2014, 202, 314–322. 10.1016/j.snb.2014.05.087. [DOI] [Google Scholar]
- Evans E.; Gabriel E. F. M.; Coltro W. K. T.; Garcia C. D. Analyst 2014, 139 (9), 2127–2132. 10.1039/C4AN00230J. [DOI] [PMC free article] [PubMed] [Google Scholar]
- Komatsu T.; Sato Y.; Maeki M.; Ishida A.; Tani H.; Tokeshi M. Anal. Chim. Acta 2021, 1144, 85–95. 10.1016/j.aca.2020.12.003. [DOI] [PubMed] [Google Scholar]
- Lai Y. T.; Tsai C. H.; Hsu J. C.; Lu Y. W. Micromachines 2019, 10 (12), 837. 10.3390/mi10120837. [DOI] [PMC free article] [PubMed] [Google Scholar]
- Busa L. S. A.; Mohammadi S.; Maeki M.; Ishida A.; Tani H.; Tokeshi M. Analyst 2016, 141 (24), 6598–6603. 10.1039/C6AN01475E. [DOI] [PubMed] [Google Scholar]
- Apilux A.; Ukita Y.; Chikae M.; Chailapakul O.; Takamura Y. Lab Chip 2013, 13 (1), 126–135. 10.1039/C2LC40690J. [DOI] [PubMed] [Google Scholar]
- Jahanshahi-Anbuhi S.; Henry A.; Leung V.; Sicard C.; Pennings K.; Pelton R.; Brennan J.; Filipe C. Lab Chip 2014, 14, 229–236. 10.1039/C3LC50762A. [DOI] [PubMed] [Google Scholar]
- Meng H.; Chen C.; Zhu Y.; Li Z.; Ye F.; Ho J. W. K.; Chen H. Lab Chip 2021, 21, 4166–4176. 10.1039/D1LC00638J. [DOI] [PubMed] [Google Scholar]
- Lutz B.; Liang T.; Fu E.; Ramachandran S.; Kauffman P.; Yager P. Lab Chip 2013, 13 (14), 2840–2847. 10.1039/c3lc50178g. [DOI] [PMC free article] [PubMed] [Google Scholar]
- Tu D.; Holderby A.; Dean J.; Mabbott S.; Coté G. L. Anal. Chem. 2021, 93 (10), 4497–4505. 10.1021/acs.analchem.0c04706. [DOI] [PubMed] [Google Scholar]
- Nguyen M. P.; Meredith N. A.; Kelly S. P.; Henry C. S. Anal. Chim. Acta 2018, 1017, 20–25. 10.1016/j.aca.2018.01.036. [DOI] [PMC free article] [PubMed] [Google Scholar]
- Choochuay S.; Phakam J.; Jala P.; Maneeboon T.; Tansakul N. Int. J. Anal. Chem. 2018, 2018, 1–8. 10.1155/2018/4650764. [DOI] [PMC free article] [PubMed] [Google Scholar]
- Zhang L.; Dou X. W.; Zhang C.; Logrieco A. F.; Yang M. H. Toxins (Basel) 2018, 10, 65. 10.3390/toxins10020065. [DOI] [PMC free article] [PubMed] [Google Scholar]
- Milićević D.; Udovički B.; Petrović Z.; Janković S.; Radulović S.; Gurinović M.; Rajković A. Meat Technology 2020, 61 (1), 1–36. 10.18485/meattech.2020.61.1.1. [DOI] [Google Scholar]
- Ali N. Toxicology reports 2019, 6, 1188–1197. 10.1016/j.toxrep.2019.11.007. [DOI] [PMC free article] [PubMed] [Google Scholar]
- Shim W. B.; Kim K.; Ofori J. A.; Chung Y. C.; Chung D. H. Journal of Food Protection 2012, 75 (11), 1991–1999. 10.4315/0362-028X.JFP-12-190. [DOI] [PubMed] [Google Scholar]
- Sheini A. Mikrochimica acta 2020, 187 (3), 167. 10.1007/s00604-020-4147-5. [DOI] [PubMed] [Google Scholar]
- Tang X.; Su R.; Luo H.; Zhao Y.; Feng L.; Chen J. Food Control 2022, 132, 108497. 10.1016/j.foodcont.2021.108497. [DOI] [Google Scholar]
Associated Data
This section collects any data citations, data availability statements, or supplementary materials included in this article.