

Abstract
Objectives:
This study aims to provide modern estimates of survival for untreated HNC and to identify patient- and tumor-specific factors associated with not receiving definitive treatment.
Methods:
Adults with mucosal HNC were identified from the SEER database. Median overall survival of untreated patients was calculated and stratified by site and stage. Cause-specific survival and factors associated with no treatment were investigated with advanced statistics.
Results:
The study cohort included 6,477 patients who received no treatment. Overall, untreated patients had a median survival of 12 months, with significant variability by site and stage. Multivariable analysis identified advanced age, black race, unmarried status, and lack of private insurance as associated with no treatment.
Conclusion:
Survival of HNC without treatment is dismal, yet substantial variation exists by tumor site and stage. Higher rates of no treatment among the poor and racial minorities are potentially driven by disparities in care availability and provision.
INTRODUCTION
Head and neck cancer (HNC) is one of the ten most common cancers in the United States with roughly 53,000 new cases each year[1]. Despite advances in surgical techniques, radiation, and chemotherapy, the median five-year survival remains 60 percent[2]. Recent literature has demonstrated that definitive surgery for patients with advanced age can still be performed safely[3]. However, in patients with advanced disease, treatment is often morbid, requiring disfiguring surgeries, increased risk of dysphagia, dysphonia, and worsened quality of life. In a recent study of 1,729 patients who underwent treatment for HNC, 61% felt some degree of regret over their treatment decision due to symptoms[4]. The challenges facing practitioners counseling elderly or comorbid patients are two-fold: 1) how to properly prognosticate outcomes for patients interested in palliative non-oncologic treatment only and 2) how to identify patients likely to forgo treatment to provide additional support and resources to ensure they are being appropriately managed.
The literature on the natural history of untreated head and neck cancer to date is mostly comprised of single institution studies from more than a decade ago. Several single institution studies have been performed with median survival ranging from 11.5 weeks to 9 months but were all limited by variable patient selection, inclusion criteria, and poor generalizability[5–8]. One database study performed in 2017 identified a median survival of 4 months and found African-American race, pharynx subsites and stage II disease associated with lack of treatment[6]. However, this study only focused on relative survival, which has limited reliability in a population with higher than average comorbidities, such as HNC patients and those most likely to forgo treatment.
Due to the discrepancies in the literature and lack of recent relevant publications, the objectives of this study are to identify the patient and oncologic factors associated with not receiving definitive treatment and provide prognostic data for patients with untreated HNC based on nationally representative data.
METHODS
Adults (age ≥ 18 years) with mucosal squamous cell carcinoma of the head and neck were identified from the Surveillance, Epidemiology, and End Results (SEER) 18 database. Patients were included from 2004 to 2014 to allow use of the TNM staging system throughout. Patients were excluded for other malignant diagnoses, lack of histologic confirmation, unknown survival or missing treatment data (Fig. 1).
Figure 1:
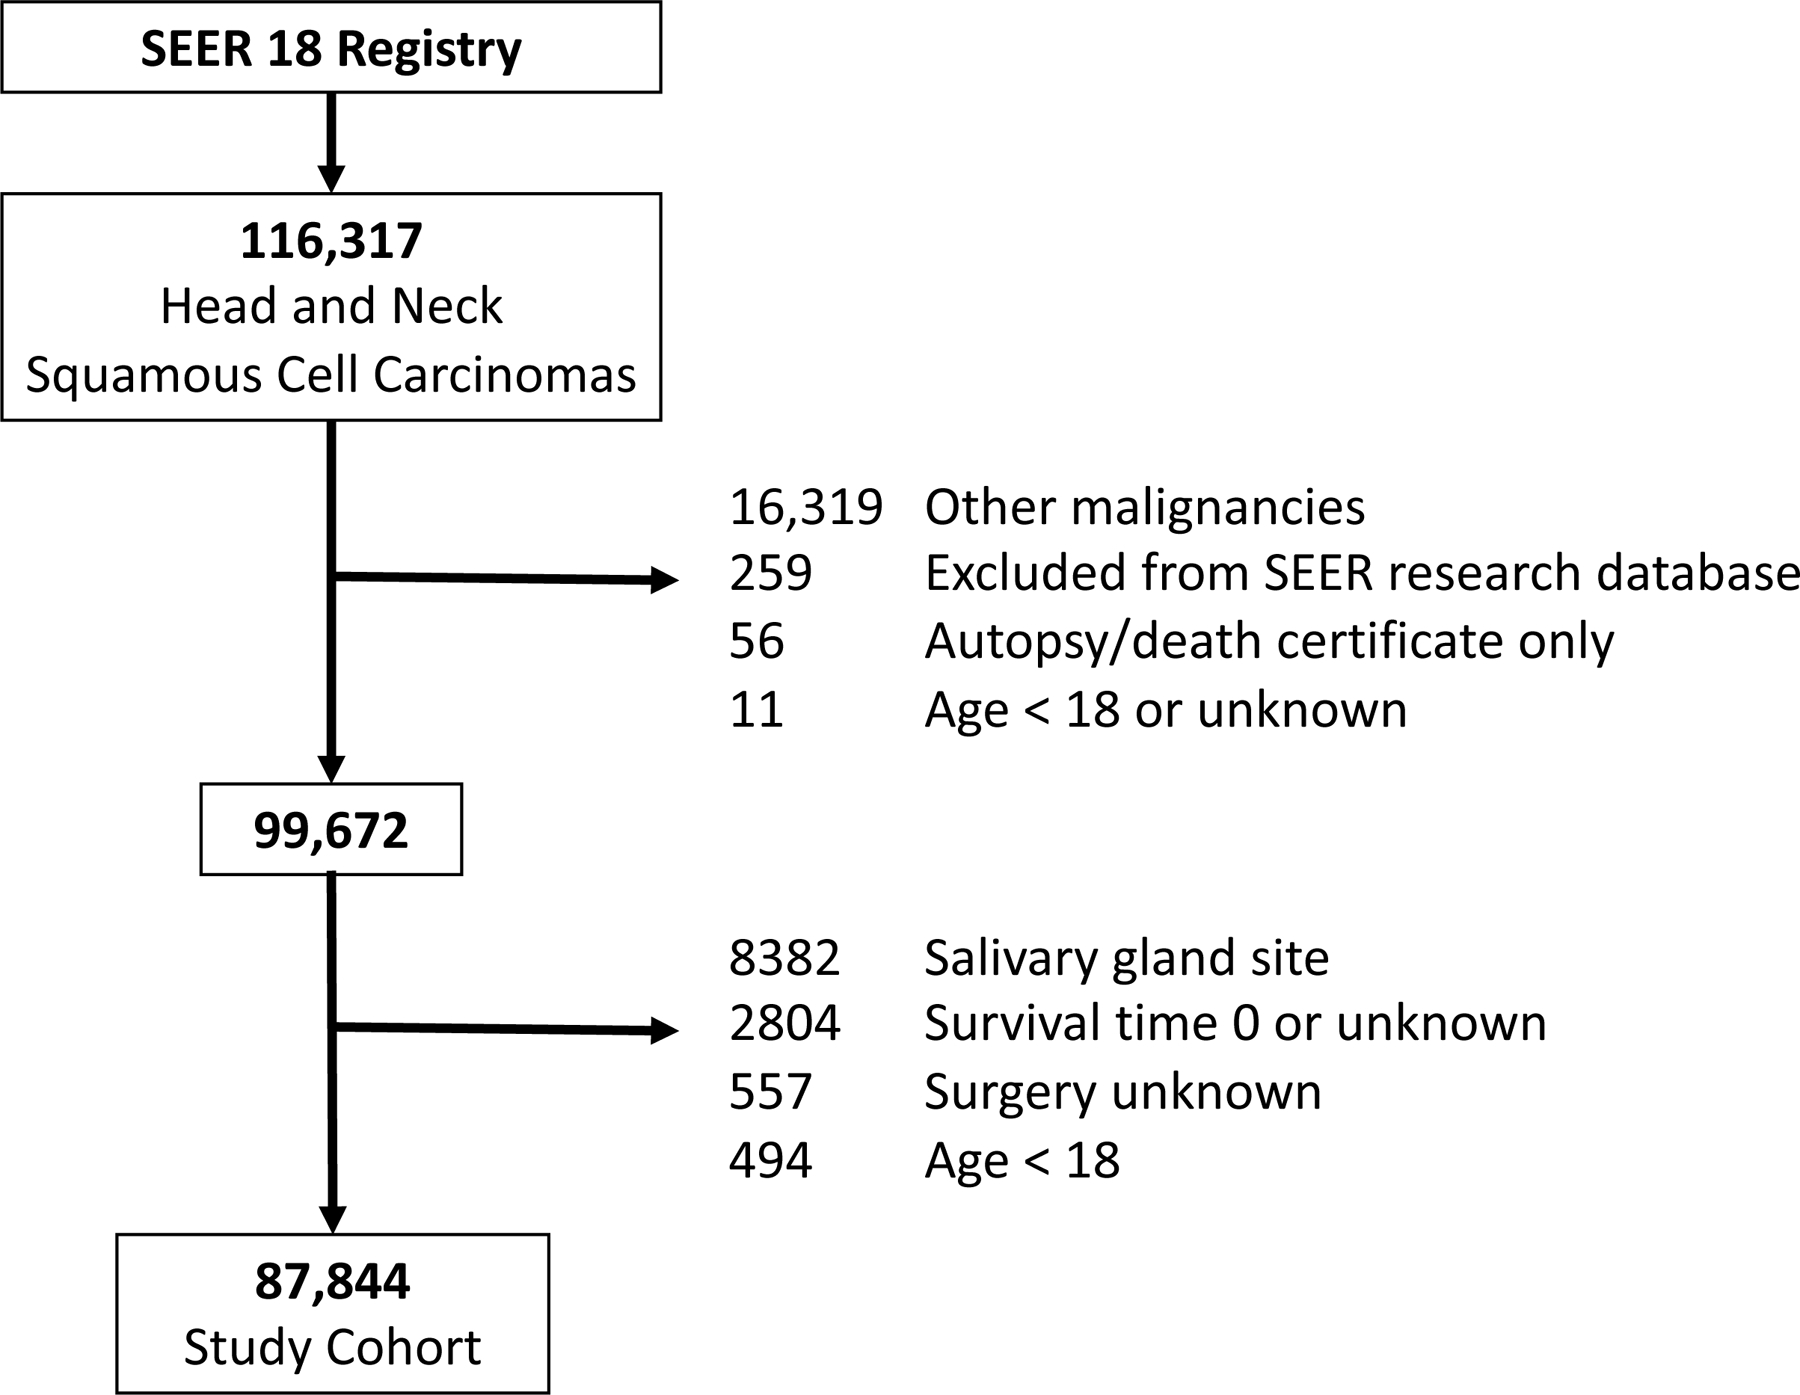
Flow diagram for study cohort section
In order to determine factors associated with no treatment, the primary outcome was untreated status. Patients with no treatment recorded for any available treatment variables, including surgery, radiation, chemotherapy, and immunotherapy, were classified as untreated. Surgery limited to biopsies was not considered oncologic treatment. Tumor stage, site, grade, size, treatments, and sociodemographic variables were collected. The 6th edition of the American Joint Committee on Cancer staging system was used since this was available for throughout the study timeframe. Poverty, education, and smoking rate were assessed at the county level.
The cohort of treated and untreated patients was characterized with descriptive statistics. Associations with no treatment were assessed by univariable and multivariable logistic regression models. Variables whose odds ratio (OR) excluded 1 with 99% confidence were included in the multivariable model. Additionally stage was included in all models based on its clinical importance. A planned subset analysis was performed for Stages I-IVa only. This eliminates stages IVb and IVc, which are not generally considered curable by established treatments, and therefore the decision whether to pursue treatment may differ. Effect sizes are reported as odds ratios (OR) for univariable analysis and adjusted odds ratios (aOR) for multivariable analysis with precision reported as 99% confidence intervals (CI). A sensitivity analysis was performed by including chemotherapy only in the untreated group since chemotherapy alone can prolong life but is not recommended for curative intent[9, 10].
Overall survival of untreated versus treated patients was calculated with Kaplan-Meier methods and stratified by site and stage. Median survival was reported for each site and stage combination and reported with 95% CI. To account for substantial mortality from causes other than the index cancer among HNC patients, especially those declining treatment, survival differences were further investigated using competing risk models. Cumulative mortality functions were created using two endpoints: death attributed to the index HNC cancer and death from any other cause. Cause of death was classified based on the SEER methodology which uses additional oncologic and patient data to improve classification accuracy compared to death certificates alone[11]. A multivariable Fine and Gray competing risk regression model was used to assess cancer-specific survival of untreated HNC by site with stage included as a covariate. Results were reported as sub-distribution hazard ratios (sHR) with 99% CI.
Data was extracted using SEER*Stat version 8.3.5 and exported to R version 3.5.1 for analysis using the survival and cmprsk packages.
RESULTS
The study cohort included a total of 87,844 eligible patients, of which 6,477 (7.4%) received no oncologic treatment (Fig. 1). The distribution of baseline sociodemographic characteristics, tumor subsite, stage, and treatment type and results from univariate logistic regression separated by treatment status are presented in Table 1. Multivariable analysis of demographic variables revealed that older age (aOR 1.05 each year, 99% CI: 1.04 to 1.05), black race (aOR 1.27, CI: 1.06 to 1.53), and unmarried status (divorced/separated status with aOR 1.66, CI: 1.39 to 1.98; single status with aOR 2.01, CI: 1.71 to 2.36; widowed status with aOR 1.39, CI: 1.13 to 1.71) were significantly and strongly associated with being untreated (Table 2). Multivariable analysis of socioeconomic variables revealed that uninsured status (aOR 1.82, CI: 1.41 to 2.33) and Medicaid insurance (aOR 1.48, CI: 1.26 to 1.72) were significantly associated with being untreated. Interestingly, residing in counties below the poverty level was not associated with treatment status.
Table 1.
Cohort Description and Comparison between Treated and Untreated Patients
| Any Treatment | No Treatment | Odds Ratio for No Treatment (99% CI)* | |
|---|---|---|---|
| n | 81367 | 6477 | |
| Age (mean (sd)) | 60.8 (12.6) | 66.1 (13.7) | 1.03 (1.03 – 1.04) |
| Sex (n, % Male) | 60417 (74.3) | 4662 (72.0) | 0.89 (0.83 – 0.96) |
| Race (n, %) | |||
| White | 60095 (74.4) | 4404 (70.8) | ref |
| Black | 8418 (10.4) | 874 (14.1) | 1.42 (1.28 – 1.56) |
| Hispanic | 6595 (8.2) | 529 (8.5) | 1.09 (0.97 – 1.24) |
| Other | 5643 (7.0) | 412 (6.6) | 1.00 (0.87 – 1.14) |
| Marital Status (n, %) | |||
| Married | 43216 (56.6) | 2184 (40.8) | ref |
| Divorced/Separated | 10939 (14.3) | 851 (15.9) | 1.54 (1.38 – 1.71) |
| Single | 15307 20.0) | 1475 (27.5) | 1.91 (1.74 – 2.09) |
| Widowed | 6893 (9.0) | 847 (15.8) | 2.43 (2.18 – 2.71) |
| Insurance (n, %) | |||
| Insured | 47786 (79.5) | 2902 (70.2) | ref |
| Uninsured | 3114 (5.2) | 303 (7.3) | 1.60 (1.36 – 1.88) |
| Any Medicaid | 9178 (15.3) | 930 (22.5) | 1.67 (1.51 – 1.85) |
| % Persons in County Below Poverty (mean (sd)) | 14.2 (5.3) | 15.0 (5.4) | 1.03 (1.02 – 1.03) |
| County Median Family Income (mean (sd)) | $69533 (17063) | $67497 (16708) | 0.96 (0.96 –0.97)† |
| % Smokers in County (mean (sd)) | 18.5 (5.8) | 18.29 (5.86) | 1.00 (0.99 – 1.00) |
| Site (n, %) | |||
| Oral Cavity | 34373 (42.2) | 2710 (41.8) | ref |
| Hypopharynx | 3262 (4.0) | 379 (5.9) | 1.47 (1.27 – 1.71) |
| Larynx | 18900 (23.2) | 1696 (26.2) | 1.14 (1.05 – 1.24) |
| Nasopharynx | 4255 (5.2) | 349 (5.4) | 1.04 (0.89 – 1.21) |
| Sinonasal | 4178 (5.1) | 295 (4.6) | 0.90 (0.76 – 1.05) |
| Oropharynx | 15472 (19.0) | 861 (13.3) | 0.71 (0.64 – 0.78) |
| Other Oral Cavity and Pharynx | 927 (1.1) | 187 (2.9) | 2.56 (2.06 – 3.15) |
| Stage (n, %) | |||
| I | 16553 (23.3) | 729 (18.7) | ref |
| II | 9079 ( 12.8) | 446 (11.4) | 1.12 (0.95 – 1.31) |
| III | 11674 (16.5) | 556 ( 14.2) | 1.08 (0.93 – 1.25) |
| IVa | 23257 ( 32.8) | 1060 (27.2) | 1.03 (0.91 – 1.18) |
| IVb | 4417 (6.2) | 333 (8.5) | 1.71 (1.43 – 2.04) |
| IVc | 2777 (3.9) | 459 ( 11.8) | 3.75 (3.19 – 4.41) |
| IVnos | 3198 (4.5) | 321 ( 8.2) | 2.28 (1.90 – 2.72) |
| Tumor classification (n, %) | |||
| T0 | 149 (0.2) | 8 (0.2) | |
| T1 | 24286 (35.3) | 1026 (26.7) | ref |
| T2 | 20671 (30.0) | 914 (23.8) | 1.05 (0.93 – 1.18) |
| T3 | 10099 (14.7) | 659 (17.2) | 1.54 (1.35 – 1.76) |
| T4 | 1146 ( 1.7) | 92 (2.4) | 1.90 (1.41 – 2.52) |
| T4a | 9932 ( 14.4) | 843 (22.0) | 2.01 (1.78 – 2.27) |
| T4b | 2610 (3.8) | 296 (7.7) | 2.68 (2.24 – 3.20) |
| Node Classification (n, %) | |||
| N0 | 37066 (48.8) | 2504 (53.6) | ref |
| N1 | 12392 (16.3) | 813 (17.4) | 0.97 (0.87 – 1.08) |
| N2 | 23802 (31.3) | 1166 (25.0) | 0.73 (0.66 – 0.80) |
| N3 | 2701 (3.6) | 185 (4.0) | 1.01 (0.82 – 1.24) |
| Metastasis (n, %) | 2777 (3.7) | 459 (9.7) | 2.84 (2.47 – 3.24) |
| Year of Diagnosis | 0.99 (0.98 – 1.00) | ||
| Grade (n, %) | |||
| I | 9822 (15.5) | 810 (18.7) | ref |
| II | 30514 (48.2) | 2077 (47.9) | 0.83 (0.74 – 0.92) |
| III | 20577 (32.5) | 1296 (29.9) | 0.76 (0.68 – 0.86) |
| IV | 2348 (3.7) | 156 (3.6) | 0.81 (0.63 – 1.01) |
| Tumor Size (cm, mean (sd)) | 3.1 (3.6) | 3.8 (4.8) | 1.02 (1.02 – 1.03) |
| Treatment (n, %) | |||
| Surgery Only | 18916 (23.2) | ||
| Radiation Only | 10634 (13.1) | ||
| Chemotherapy Only | 2240 (2.8) | ||
| Surgery and Radiation | 11711 (14.4) | ||
| Radiation and Chemotherapy | 23947 (29.4) | ||
| Surgery and Chemotherapy | 811 (1.0) | ||
| Surgery, Radiation and Chemotherapy | 13108 (16.1) | ||
CI: confidence interval. sd: standard deviation. cm: centimeters. ref: reference group.
Results of univariable regression model.
per $5000 of income
US dollars
Table 2.
Factors associated with no treatment: Results of Multivariable Logistic Regression Models
| All Patients, OR (99% CI) | Stage I-IVa only, OR (99% CI) | |
|---|---|---|
| Age | 1.05 (1.04 – 1.05) | 1.05 (1.04 – 1.05) |
| Sex = Male (ref: Female) | 1.03 (0.89 – 1.2) | |
| Race (ref: White) | ||
| Black | 1.27 (1.06 – 1.53) | 1.26 (0.99 – 1.59) |
| Hispanic | 0.91 (0.72 – 1.14) | 0.93 (0.69 – 1.23) |
| Other | 1.15 (0.89 – 1.46) | 1.06 (0.77 – 1.45) |
| Marital Status (ref: Married) | ||
| Divorced/Separated | 1.66 (1.39 – 1.98) | 1.51 (1.20 – 1.89) |
| Single | 2.01 (1.71 – 2.36) | 2.03 (1.66 – 2.48) |
| Widowed | 1.39 (1.13 – 1.71) | 1.36 (1.06 – 1.73) |
| % Persons in County Below Poverty | 1.00 (0.97 – 1.02) | 1.01 (0.98 – 1.04) |
| Median County Income (per $5000) | 0.94 (0.90 – 0.98) | 1.00 (0.95 – 1.04) |
| Insurance | ||
| Uninsured | 1.82 (1.41 – 2.33) | 1.75 (1.25 – 2.41) |
| Any Medicaid | 1.48 (1.26 – 1.72) | 1.56 (1.27 – 1.91) |
| % Smokers in County | 0.97 (0.96 – 0.99) | |
| Year of Diagnosis | 0.98 (0.95 – 1.00) | 0.99 (0.95 – 1.02) |
| Site (ref: Oral Cavity) | ||
| Hypopharynx | 1.41 (1.1– 1.8) | 1.46 (1.04 – 2.01) |
| Larynx | 1.24 (1.05– 1.46) | 1.11 (0.90 – 1.37) |
| Nasopharynx | 1.56 (1.07– 2.23) | 1.57 (0.97 – 2.44) |
| Sinonasal | 0.45 (0.29– 0.67) | 0.54 (0.29 – 0.92) |
| Oropharynx | 0.9 (0.75– 1.08) | 0.90 (0.71 – 1.14) |
| Stage | ||
| I | ref | |
| II | ref: I-IVa | 1.06 (0.68 – 1.64) |
| III | 0.79 (0.50 – 1.22) | |
| IVa | 0.59 (0.36 – 0.97) | |
| IVb | 1.05 (0.74– 1.46) | (excluded) |
| IVc | 2.89 (2.3– 3.61) | (excluded) |
| IVnos | 3.69 (2.44– 5.44) | (excluded) |
| T classification (ref: T1) | ||
| T2 | 1.24 (1.03– 1.49) | 1.25 (0.88 – 1.80) |
| T3 | 1.78 (1.46– 2.19) | 2.17 (1.51 – 3.18) |
| T4 | 1.31 (0.78– 2.14) | 2.12 (0.82 – 5.11) |
| T4a | 1.93 (1.59– 2.35) | 2.75 (1.85 – 4.15) |
| T4b | 3.58 (2.44– 5.28) | |
| N classification (ref: N0) | ||
| N1 | 1.12 (0.85 – 1.48) | 1.19 (0.91 – 1.57) |
| N2 | 1.02 (0.76 – 1.36) | 1.17 (0.85 – 1.61) |
| N3 | 0.67 (0.33 – 1.28) | |
| Tumor Size (per cm) | 1.15 (1.02– 1.26) | 1.01 (1.00 – 1.03) |
| Grade (ref: I) | ||
| II | 0.92 (0.72 – 1.18) | |
| III | 0.93 (0.71 – 1.23) | |
| IV | 1.25 (0.72 – 2.10) | |
OR: Odds ratio. CI: confidence interval. ref: reference group. cm: centimeter
Disease-specific factors also appeared to impact the rate of treatment among patients. On multivariable analysis, compared to oral cavity cancer, hypopharyngeal (aOR 1.41, 99% CI: 1.10 to 1.80), laryngeal (aOR 1.24, CI: 1.05 to 1.46), and nasopharyngeal (aOR 1.56, CI: 1.07 to 2.23) cancers were associated with being untreated while sinonasal cancer (aOR 0.45, CI: 0.29 to 0.67) was associated with treatment. There was no significant difference in treatment rates between oropharyngeal and oral cavity cancer on multivariable analysis. In addition, compared to treated patients, untreated patients were more likely to present with advanced stage IVc disease (aOR 2.89, CI: 2.30 to 3.61). More specifically, more advanced local disease by T stage had a stepwise increase in association with lack of treatment. For instance, compared to T1 disease, T4a (aOR 1.93, CI: 1.59 to 2.35) and T4b HNC (aOR 3.58, CI 2.44 to 5.28) had a nearly two- and four-fold increased odds of not receiving oncologic treatment. Conversely, nodal stage and presence of distant metastases were not independently associated with risk of being untreated.
Similarly, in the subgroup analysis of patients with stage I-IVa disease, multivariable logistic regression revealed advanced age (aOR 1.05 each year, 99% CI: 1.04 to 1.05), unmarried status (divorced/separated status with aOR 1.51, CI: 1.20 to 1.89; single status with aOR 2.03, CI: 1.66 to 2.48; widowed status with aOR 1.36, CI: 1.06 to 1.73), uninsured status (aOR 1.75, CI: 1.25 to 2.41), Medicaid insurance (aOR: 1.56, CI: 1.27 to 1.91), and more advanced local disease (T3 with aOR 2.17, CI: 1.51 to 3.18; T4a with aOR 2.75, CI: 1.85 to 4.15) were associated with no treatment. Black race (aOR 1.26, 99% CI: 0.99 to 1.59) is strongly associated with no treatment given the magnitude of its effect size, but the relationship is not statistically significant given its relative imprecision. Interestingly, stage IVa HNC was associated with treatment compared to stage I HNC (aOR 0.59, 99% CI: 0.36 to 0.97). Similar effect sizes were also observed in the sensitivity analysis that included patients treated with chemotherapy only in the untreated category (supplemental data).
The median survival for untreated patients across the cohort was 12 months (95% CI: 11–13 months) compared to 100 months (95% CI: 98–103 months) for treated patients. For untreated patients, survival curves differed by tumor subsite and stage (Fig. 2). Across subsites, hypopharyngeal cancer demonstrated the worst median overall survival of 4 months (95% CI: 4–4 months) while laryngeal cancer demonstrated the best median overall survival of 21 months (95% CI: 17–27) (Fig. 2). Across tumor stage, there was a stepwise decrease in overall survival with increased stage. Moreover, stage IVc HNC had the worst median overall survival of 3 months (95% CI: 2–3) while stage I HNC had the best overall survival with greater than 50% overall survival after 10 years.
Figure 2:
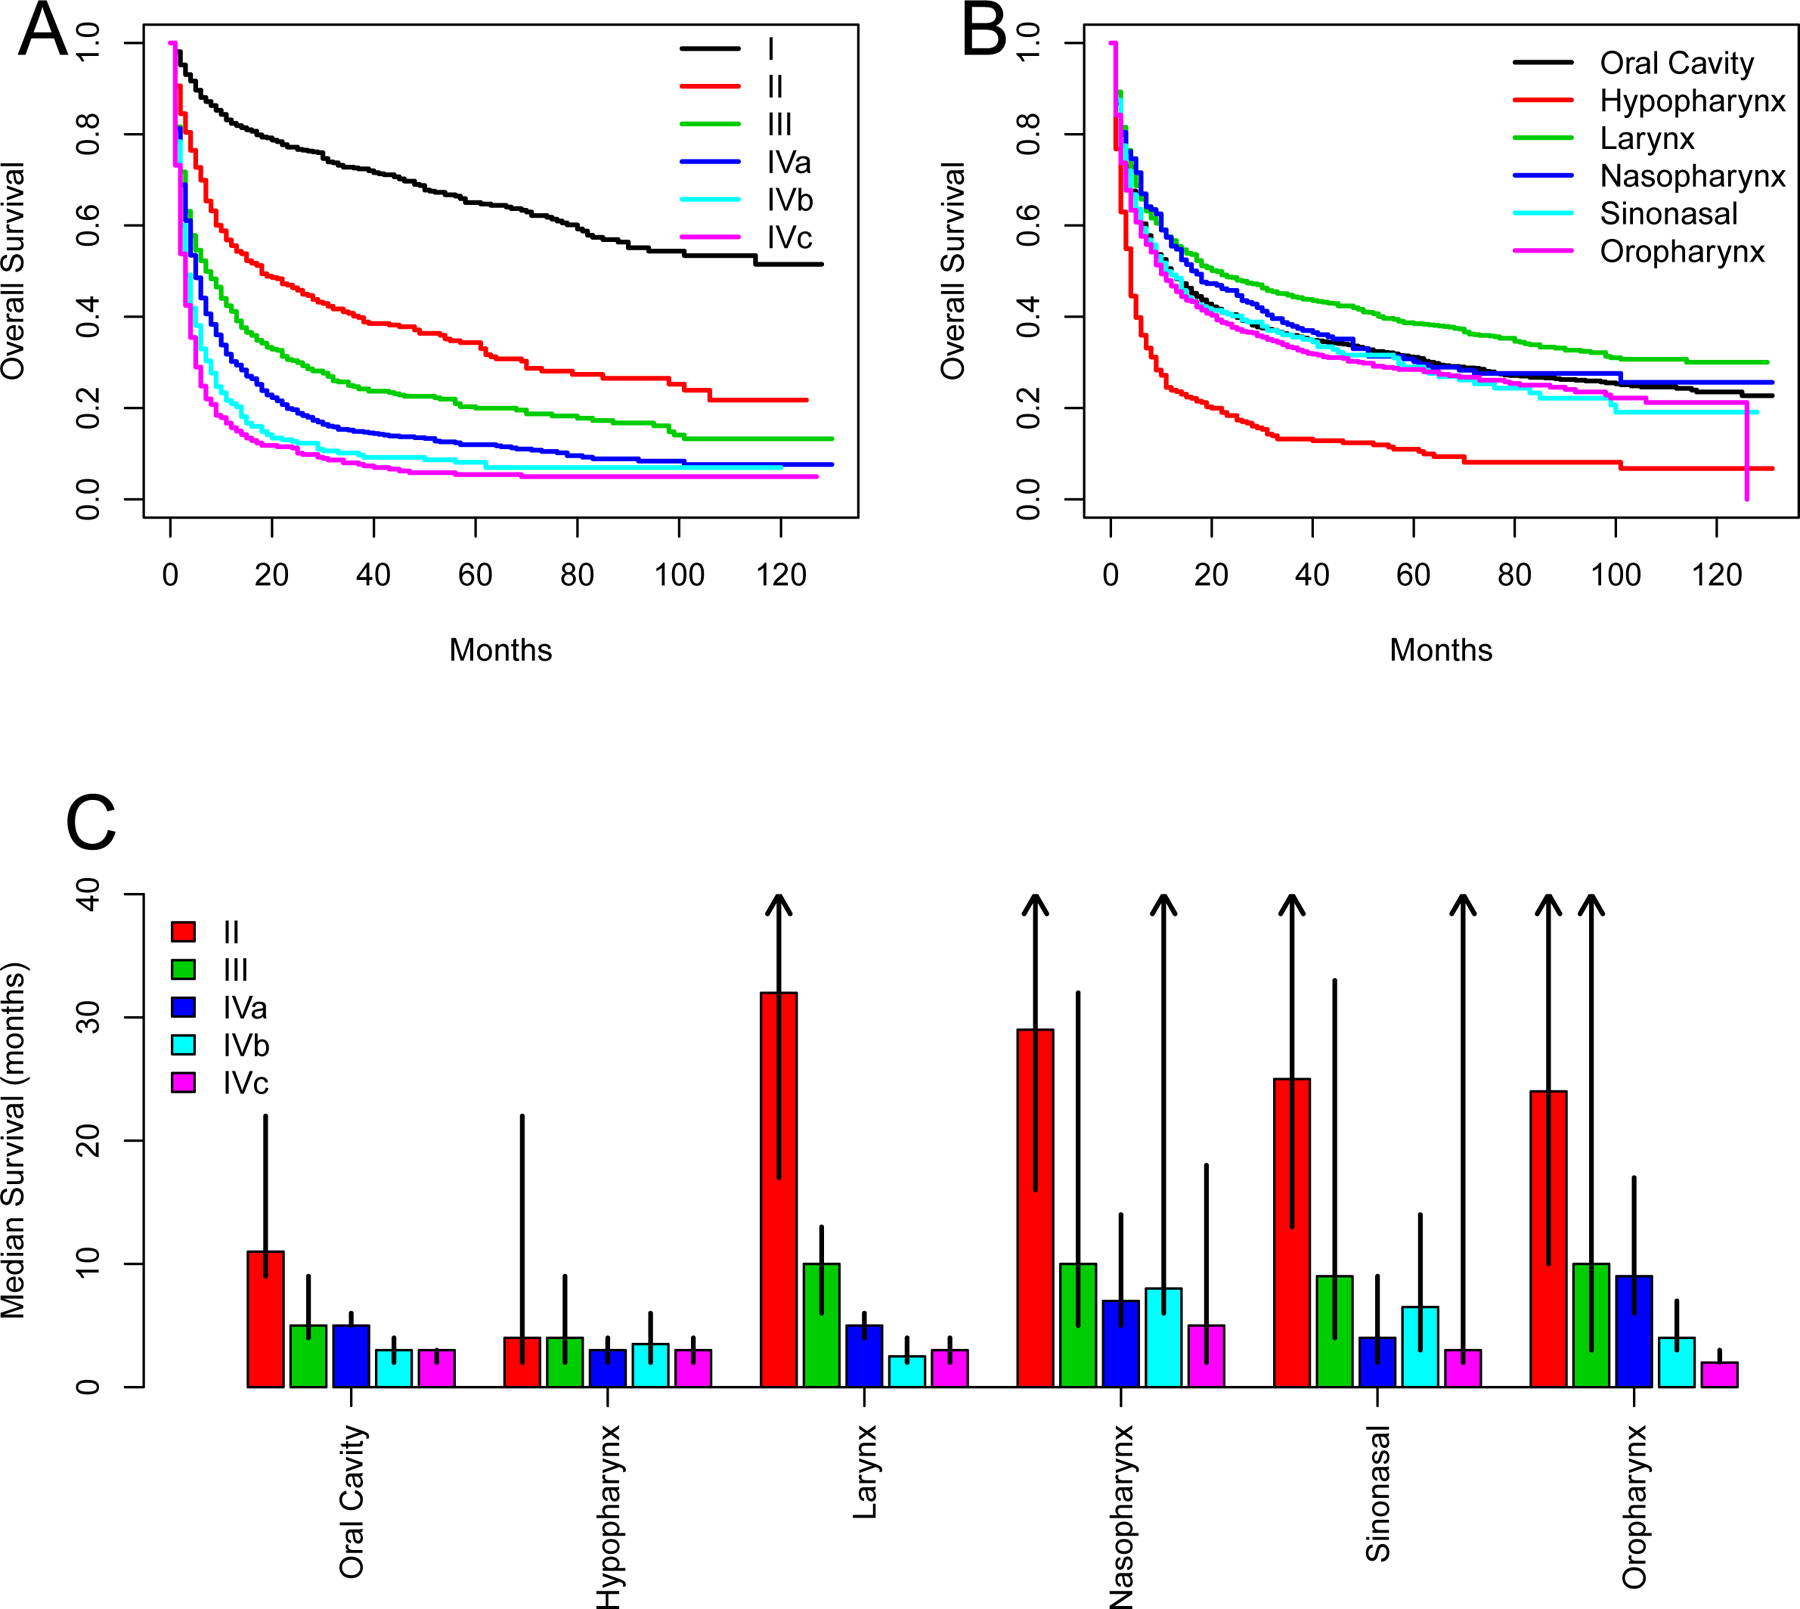
Patient outcomes without oncologic treatment. A, Overall survival by stage. B, Overall survival by tumor subsite. C, Median survival by both stage and subsite. Arrows indicate that median survival not reached [Color figure can be viewed at wileyonlinelibrary.com]
After controlling for stage, cancer-specific survival of untreated hypopharyngeal cancer was confirmed to be lower (sHR 1.16, 99% CI: 0.95–1.42) than untreated oral cavity cancer while cancer-specific survival of untreated laryngeal cancer was higher (sHR 0.87, CI: 0.76–1.00) (Table 3). While not statistically significant given the relatively wide 99% CI, these relationships may be clinically meaningful given the magnitude of the point estimate of effect size.
Table 3.
Cancer-Specific Mortality Risk by Site: Results of Univariable and Multivariable Competing Risk Survival Models
| Univariable | Multivariable | |
|---|---|---|
| sHR (99% CI) | sHR (99% CI) | |
| Site (ref: Oral Cavity) | ||
| Hypopharynx | 1.78 (1.50 – 2.11) | 1.16 (0.95 – 1.42) |
| Larynx | 0.76 (0.68 – 0.86) | 0.87 (0.76 – 1.00) |
| Nasopharynx | 1.05 (0.87 – 1.27) | 0.86 (0.68 – 1.10) |
| Sinonasal | 0.99 (0.79 – 1.23) | 0.87 (0.65 – 1.15) |
| Oropharynx | 1.24 (1.09 – 1.42) | 0.88 (0.75 – 1.03) |
Multivariable model includes overall stage as a covariate.
sHR: sub-distribution hazard ratio. CI: Confidence Interval
Compared to treated patients, untreated patients showed a higher mortality rate from causes other than the index HNC (sHR 1.45, 99% CI: 1.32–1.58). This difference was greatest in the first months after diagnosis (for example at 5 months: 6.5% vs 1.6% mortality from non-cancer causes) (Fig. 3).
Figure 3:
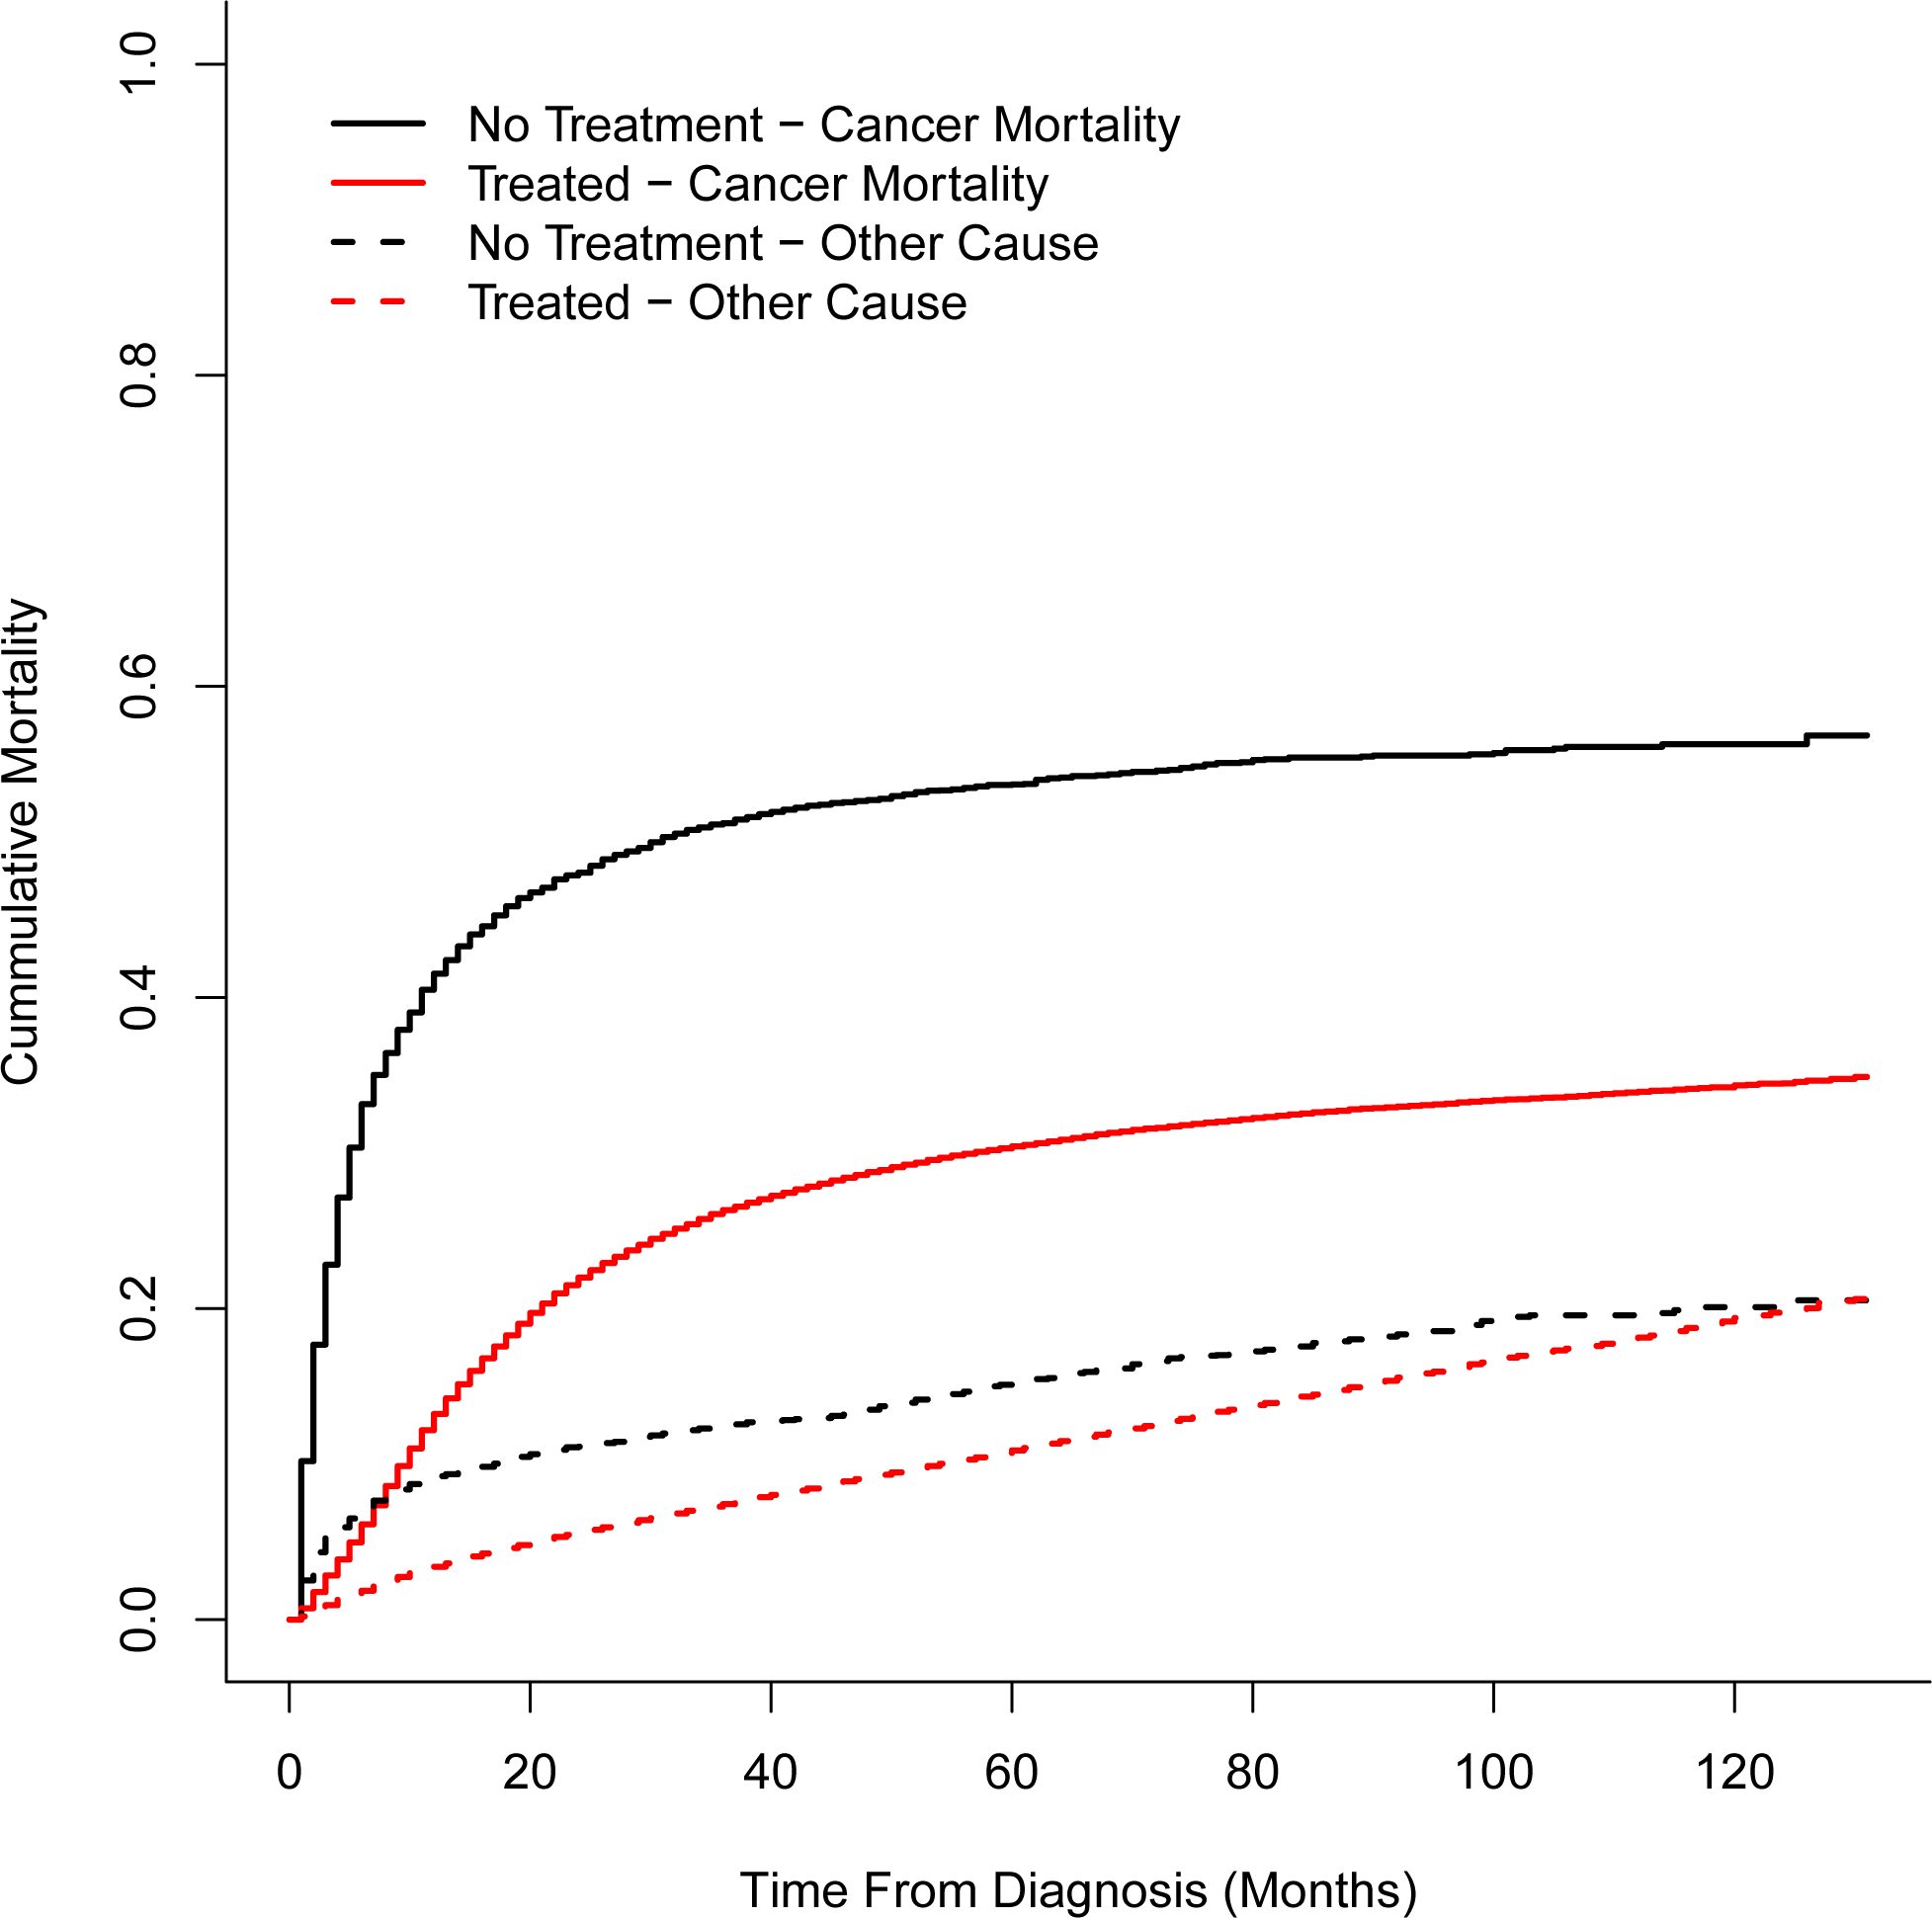
Cumulative mortality following head and neck cancer (HNC) diagnosis secondary to cancer (solid lines) or other cause (dashed line) [Color figure can be viewed at wileyonlinelibrary.com]
DISCUSSION
This SEER database study of 87,844 patients with HNC identified patient and oncologic factors associated with not receiving definitive treatment and provides prognostic data for those considering no treatment. Multivariable analysis of patient-specific variables revealed that older age, black race, unmarried status, uninsured/Medicaid status were strong and clinically meaningful risk factors for going untreated. Multivariable analysis of disease-specific variables revealed that hypopharyngeal, laryngeal, and nasopharyngeal subsites as well as advanced local disease were strong risk factors for untreated status. Conversely, sinonasal subsite was strongly associated with receiving definitive treatment.
In this cohort, approximately 1 of every 14 patients with a new diagnosis of head and neck cancer does not undergo treatment for their disease. There are myriad reasons why people make this decision including advanced age, comorbidities, personal and financial reasons, or a combination of factors. This study revealed that a large number of patients with traditionally curable (stage I-IVa) disease are not being treated and face poor outcomes as a result. Advanced age and unmarried status are strongly associated with being untreated. This is likely due to a constellation of factors including comorbidities, reduced support network, and lack of desire to undergo the rigor of multimodality therapy. This is supported by the finding that patients in the untreated group have a higher risk of non-cancer related mortality than those in the treated group, indicating worse baseline health than the treated population. Recent work has demonstrated that 24–70% of patients with cancer and significant comorbidity do not receive treatment in accordance with published guidelines[12]. This is reflective that comorbidity is a strong negative prognostic indicator in HNC and other cancer patients[13, 14] and these comorbidities tend to progress as a result of cancer treatment[15]. A SEER database study of nearly 65,000 patients demonstrated about one-third died of competing causes including cardiovascular disease, liver disease and other cancers[16], and this is associated with tremendous health and hospital-related costs[17].
In addition to age and comorbidity, we identify that socioeconomic and demographic variables are associated with treatment discrepancies as well. We demonstrate that black race and uninsured or Medicaid status, are independent risk factors for being untreated. This finding is supported by numerous studies across different cancer subtypes indicating a relationship with race, socioeconomic status and access to care with patient treatment. A National Cancer Database (NCDB) study of over 700,000 patients with stage IV metastatic solid tumors from 2000–2008 demonstrated an association between lack of treatment with older age, black race, lack of insurance and lower income[18]. Other studies have shown black race to be a risk factor for suboptimal management in breast cancer, colon cancer, prostate cancer, lung cancer, hepatocellular carcinoma and other curable tumors[19–21]. These data may represent disparities in patient preference, provider decision making, access to care, or other confounding factors.
In HNC, multiple studies have demonstrated that black patients suffer worse outcomes than white patients[22, 23]. These differences may be partially explained by underlying socioeconomic constraints including employment, disability and insurance status[24, 25]. A retrospective study of 1,208 HNC patients demonstrated a profound difference in 5-year survival between black patients(23.5%) and white patients (49.3%), but this difference was almost entirely due to outcome disparities in uninsured or Medicaid patients[26]. In contrast, however, a retrospective study of 20,915 HNC patients identified both black race and poverty to be independently associated with worse outcomes[23].
The ability to counsel patients about the prognosis associated with each management option is critical in developing an appropriate treatment plan and managing patient expectations. To date, strong, generalizable data about patient outcomes in the absence of treatment have been lacking. Here we demonstrate that untreated head and neck cancer is largely associated with poor outcomes. However, median survival times vary widely based on the tumor subsite and clinical stage with more advanced stage HNC and hypopharyngeal subsite associated with decreased overall survival. In addition, the study’s findings may be used to better predict which patients are most at risk of not receiving oncologic treatment, and those at highest risk may benefit from more proactive counseling and outreach in order to limit the number of patients that go untreated without making an explicit, well-informed decision.
These prognostic data are largely in line with the published literature regarding the natural course of untreated patients with head and neck cancer. Most of the single institution retrospective studies are derived from university and major cancer institutions. Therefore, untreated patients in those studies tend to have higher stage disease and worse overall health than the general population included in this study. The SEER database is a robust research tool that offers unparalleled sample sizes across many diverse institutions throughout the country.
This study does have its limitations. Inherent to any national database study, coding errors and data omissions are likely present, which may bias the study’s results. Another limitation is the possibility that some patients, especially those with stage I or stage II disease, received treatment outside the registry facility which would falsely indicate they were untreated. It is also unknown if patients received adjunctive treatments such as tracheostomy or gastrostomy tube which can prolong survival. The SEER database is also missing comorbidity data, which likely affects the decision to undergo definitive treatment. Finally, there is no indication of whether patients with oropharyngeal cancer have human papillomavirus (HPV)-associated tumors which tend to have a better overall prognosis than non-HPV tumors.
Many institutions, including our own, are developing multidisciplinary clinics to facilitate and expedite care for HNC patients. Integrated visits include medical providers and ancillary services including speech and swallow therapy, dieticians, primary care referrals, and audiology. This model may improve patient treatment rates and reduce the risk that access to care or chronic medical conditions prevent oncologic treatment in line with patients’ goals and values. Future study of these and other novel care models is needed to understand their impact.
In conclusion, about one in fourteen patients with newly diagnosed head and neck cancer are not undergoing oncologic treatment. These patients face dire outcomes, but the variation by stage and site should be used to inform them of their individual prognosis. Although a variety of reasons may contribute, patient race, support and access to care are likely contributing factors.
Supplementary Material
Contributor Information
Paul Zolkind, Department of Otolaryngology. Washington University in St. Louis
Jake J. Lee, Department of Otolaryngology. Washington University in St. Louis
Ryan S. Jackson, Department of Otolaryngology. Washington University in St. Louis
Patrik Pipkorn, Department of Otolaryngology. Washington University in St. Louis
Sean T. Massa, Department of Otolaryngology. Washington University in St. Louis
References
- [1].Siegel RL, Miller KD, Jemal A. Cancer statistics, 2019. CA: a cancer journal for clinicians. 2019;69:7–34. [DOI] [PubMed] [Google Scholar]
- [2].Chinn SB, Myers JN. Oral Cavity Carcinoma: Current Management, Controversies, and Future Directions. J Clin Oncol. 2015;33:3269–76. [DOI] [PMC free article] [PubMed] [Google Scholar]
- [3].L’Esperance HE, Kallogjeri D, Yousaf S, Piccirillo JF, Rich JT. Prediction of mortality and morbidity in head and neck cancer patients 80 years of age and older undergoing surgery. The Laryngoscope. 2018;128:871–7. [DOI] [PubMed] [Google Scholar]
- [4].Goepfert RP, Fuller CD, Gunn GB, Hanna EY, Lewin JS, Zaveri JS, et al. Symptom burden as a driver of decisional regret in long-term oropharyngeal carcinoma survivors. Head & neck. 2017;39:2151–8. [DOI] [PubMed] [Google Scholar]
- [5].Choi HG, Park B, Ahn S-H. Untreated head and neck cancer in Korea: a national cohort study. European Archives of Oto-Rhino-Laryngology. 2017;274:1643–50. [DOI] [PubMed] [Google Scholar]
- [6].Hughley BB, Sperry SM, Thomsen TA, Charlton ME, Pagedar NA. Survival outcomes in elderly patients with untreated upper aerodigestive tract cancer. Head & neck. 2017;39:215–8. [DOI] [PMC free article] [PubMed] [Google Scholar]
- [7].Kowalski LP, Carvalho AL. Natural history of untreated head and neck cancer. European Journal of Cancer. 2000;36:1032–7. [DOI] [PubMed] [Google Scholar]
- [8].Jeannon JP, Ofu E, Balfour A, Bowman J, Simo R. The natural history of untreated squamous cell carcinoma of the head and neck: how we do it. Clinical Otolaryngology. 2011;36:384–8. [DOI] [PubMed] [Google Scholar]
- [9].Molin Y, Fayette J. Current chemotherapies for recurrent/metastatic head and neck cancer. Anti-cancer drugs. 2011;22:621–5. [DOI] [PubMed] [Google Scholar]
- [10].Pfister DG, Spencer S, Brizel DM, Burtness B, Busse PM, Caudell JJ, et al. Head and neck cancers, version 2.2014. Journal of the National Comprehensive Cancer Network. 2014;12:1454–87. [DOI] [PubMed] [Google Scholar]
- [11].Howlader N, Ries LA, Mariotto AB, Reichman ME, Ruhl J, Cronin KA. Improved estimates of cancer-specific survival rates from population-based data. JNCI: Journal of the National Cancer Institute. 2010;102:1584–98. [DOI] [PMC free article] [PubMed] [Google Scholar]
- [12].Søgaard M, Thomsen RW, Bossen KS, Sørensen HT, Nørgaard M. The impact of comorbidity on cancer survival: a review. Clinical epidemiology. 2013;5:3. [DOI] [PMC free article] [PubMed] [Google Scholar]
- [13].Piccirillo JF. Importance of comorbidity in head and neck cancer. The Laryngoscope. 2000;110:593–602. [DOI] [PubMed] [Google Scholar]
- [14].Wang JR, Habbous S, Espin–Garcia O, Chen D, Huang SH, Simpson C, et al. Comorbidity and performance status as independent prognostic factors in patients with head and neck squamous cell carcinoma. Head & neck. 2016;38:736–42. [DOI] [PubMed] [Google Scholar]
- [15].Eytan DF, Blackford AL, Eisele DW, Fakhry C. Prevalence of Comorbidities among Older Head and Neck Cancer Survivors in the United States. Otolaryngology–Head and Neck Surgery. 2019;160:85–92. [DOI] [PubMed] [Google Scholar]
- [16].Massa ST, Osazuwa-Peters N, Christopher KM, Arnold LD, Schootman M, Walker RJ, et al. Competing causes of death in the head and neck cancer population. Oral oncology. 2017;65:8–15. [DOI] [PubMed] [Google Scholar]
- [17].Genther DJ, Gourin CG. Effect of comorbidity on short-term outcomes and cost of care after head and neck cancer surgery in the elderly. Head & neck. 2015;37:685–93. [DOI] [PubMed] [Google Scholar]
- [18].Small AC, Tsao CK, Moshier EL, Gartrell BA, Wisnivesky JP, Godbold JH, et al. Prevalence and characteristics of patients with metastatic cancer who receive no anticancer therapy. Cancer. 2012;118:5947–54. [DOI] [PubMed] [Google Scholar]
- [19].Morris AM, Rhoads KF, Stain SC, Birkmeyer JD. Understanding racial disparities in cancer treatment and outcomes. Journal of the American College of Surgeons. 2010;211:105–13. [DOI] [PubMed] [Google Scholar]
- [20].Mathur AK, Osborne NH, Lynch RJ, Ghaferi AA, Dimick JB, Sonnenday CJ. Racial/ethnic disparities in access to care and survival for patients with early-stage hepatocellular carcinoma. Archives of surgery. 2010;145:1158–63. [DOI] [PubMed] [Google Scholar]
- [21].Rugo HS, Brufsky AM, Yood MU, Tripathy D, Kaufman PA, Mayer M, et al. Racial disparities in treatment patterns and clinical outcomes in patients with HER2-positive metastatic breast cancer. Breast cancer research and treatment. 2013;141:461–70. [DOI] [PMC free article] [PubMed] [Google Scholar]
- [22].Arbes SJ, Olshan AF, Caplan DJ, Schoenbach VJ, Slade GD, Symons MJ. Factors contributing to the poorer survival of black Americans diagnosed with oral cancer (United States). Cancer Causes & Control. 1999;10:513–23. [DOI] [PubMed] [Google Scholar]
- [23].Molina MA, Cheung MC, Perez EA, Byrne MM, Franceschi D, Moffat FL, et al. African American and poor patients have a dramatically worse prognosis for head and neck cancer: an examination of 20,915 patients. Cancer. 2008;113:2797–806. [DOI] [PubMed] [Google Scholar]
- [24].Ragin CC, Langevin SM, Marzouk M, Grandis J, Taioli E. Determinants of head and neck cancer survival by race. Head & neck. 2011;33:1092–8. [DOI] [PMC free article] [PubMed] [Google Scholar]
- [25].Du XL, Liu C-C. Racial/Ethnic disparities in socioeconomic status, diagnosis, treatment and survival among medicare-insured men and women with head and neck cancer. Journal of health care for the poor and underserved. 2010;21:913–30. [DOI] [PubMed] [Google Scholar]
- [26].Gourin CG, Podolsky RH. Racial disparities in patients with head and neck squamous cell carcinoma. The Laryngoscope. 2006;116:1093–106. [DOI] [PubMed] [Google Scholar]
Associated Data
This section collects any data citations, data availability statements, or supplementary materials included in this article.