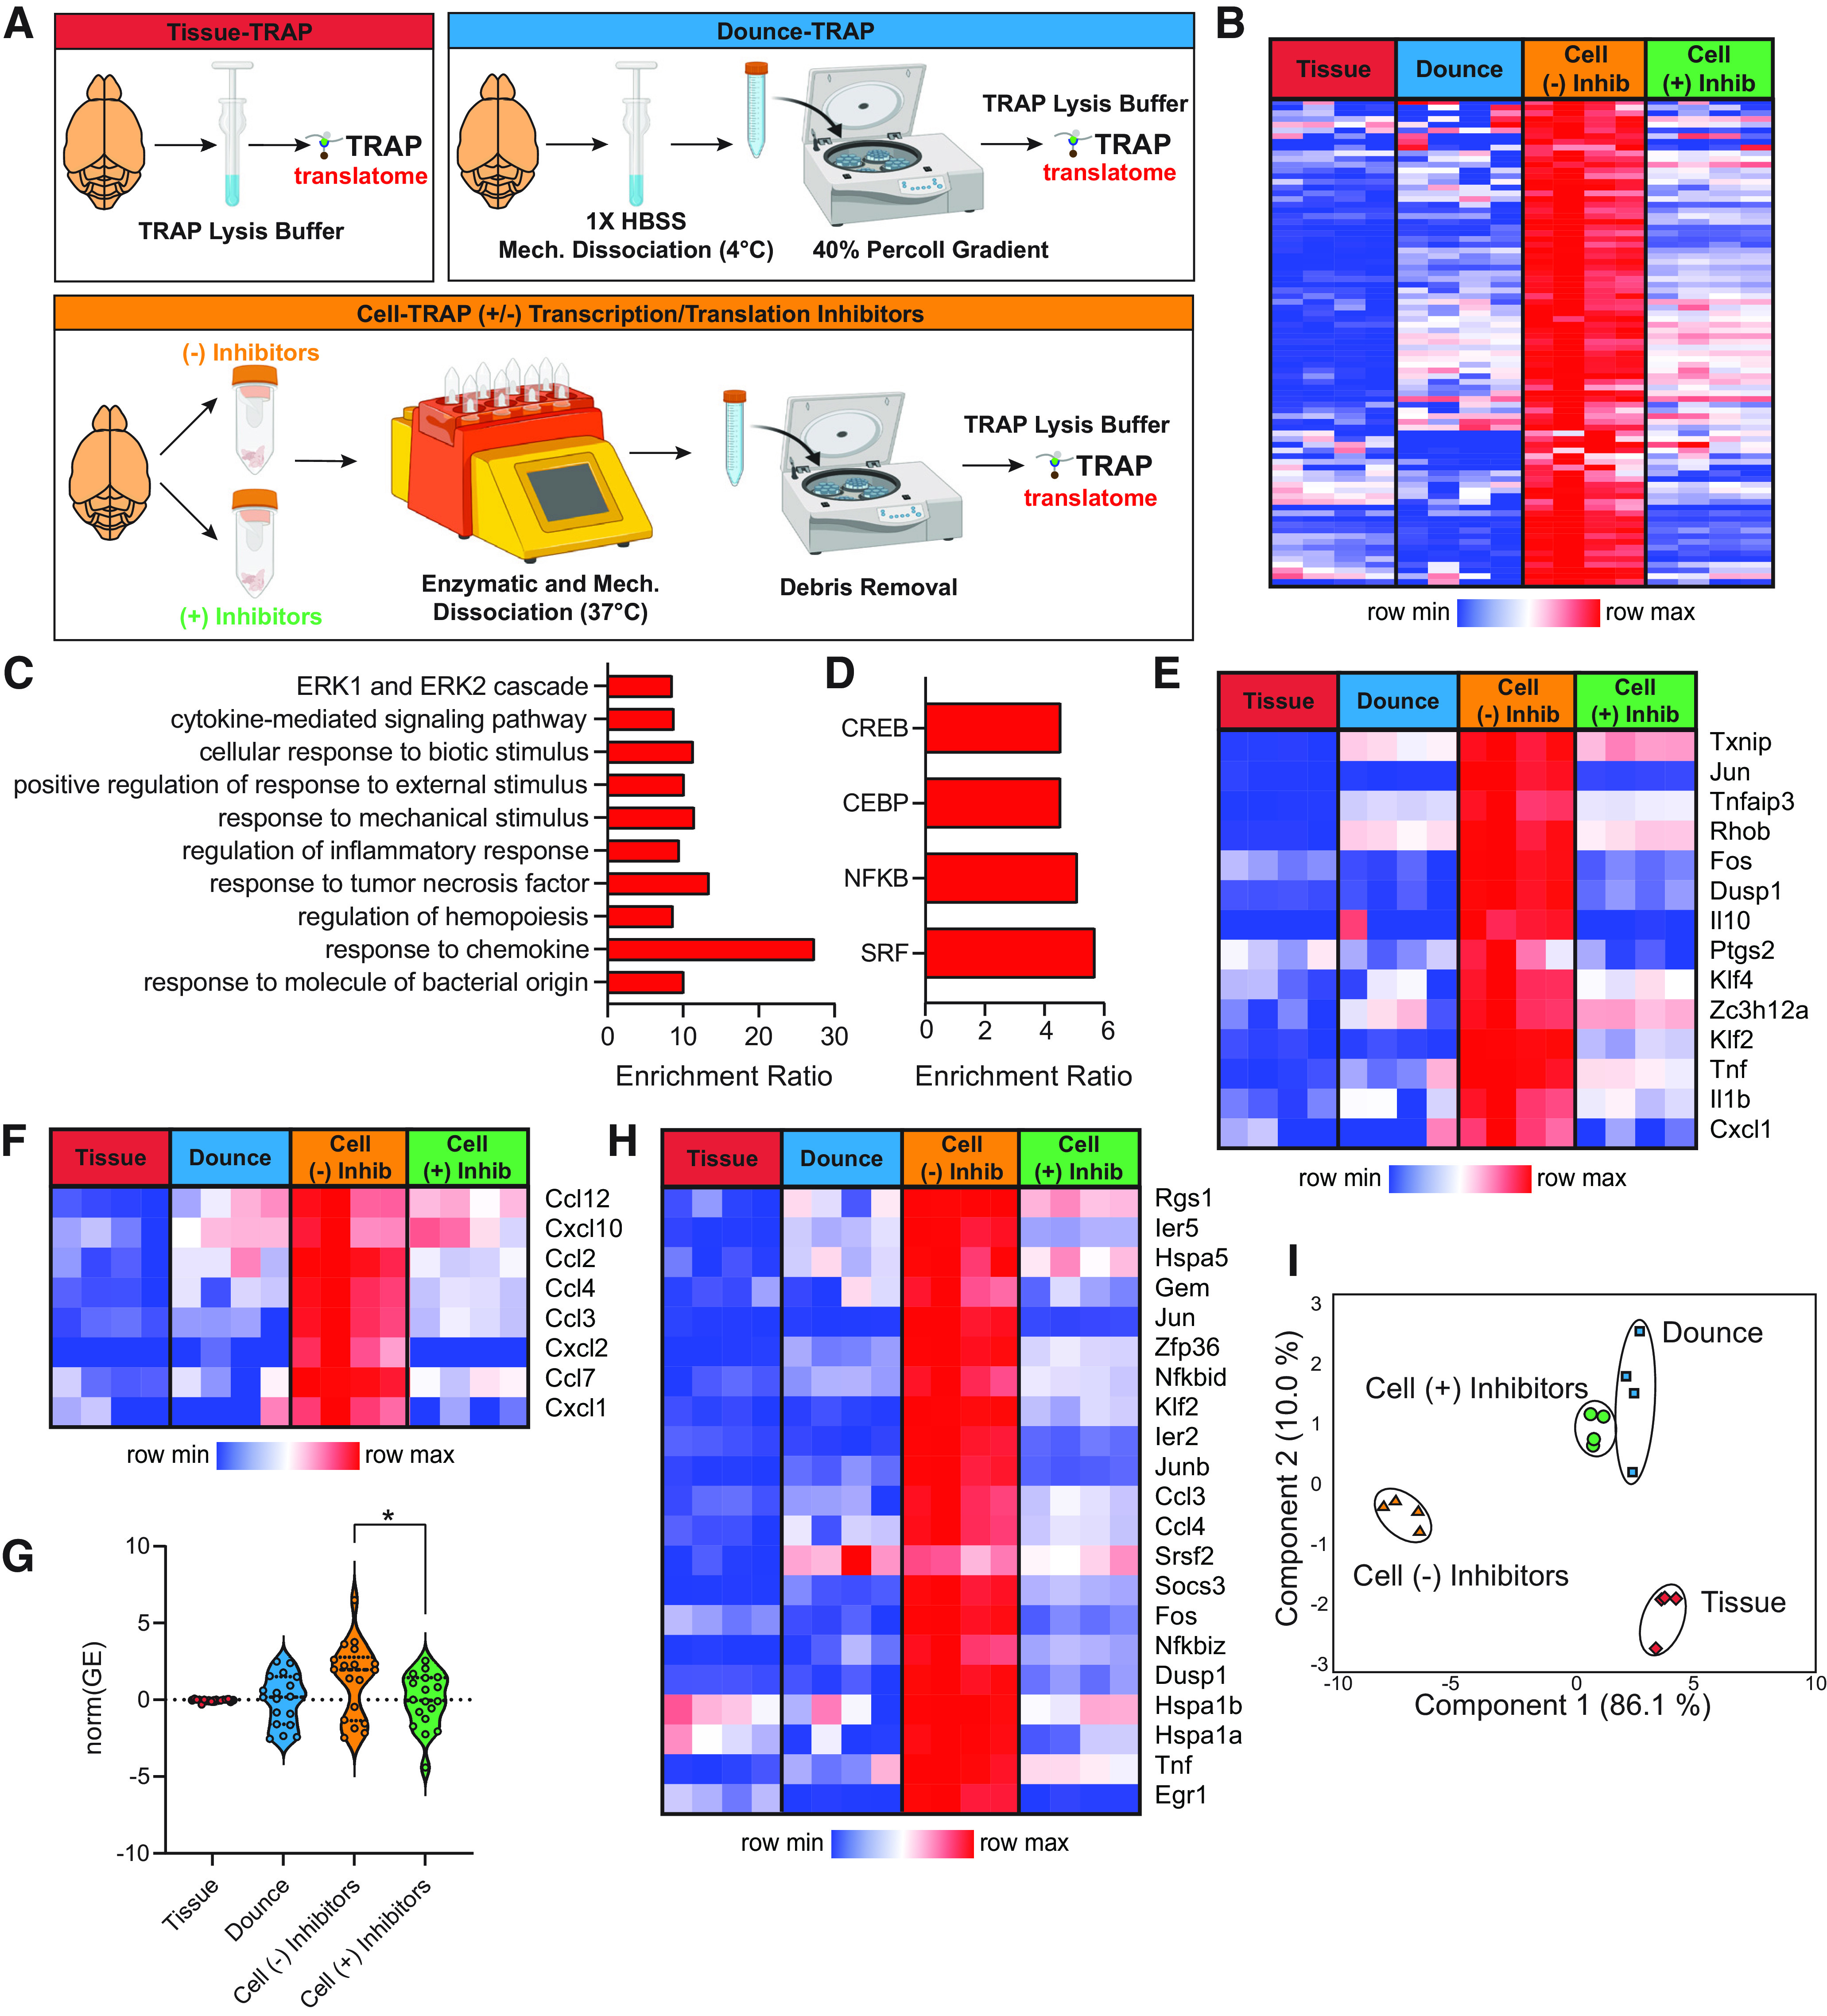
Figure 7.

Ex vivo activational profiles by cell preparation method. Basic sequencing metrics and all source data for Figure 7 are provided in Extended Data Figure 7-1. Gene body coverage plots showed greater 3′ bias in the Tissue- and Dounce-TRAP groups than the Cell-TRAP (+/−) Inhibitors groups (Extended Data Fig. 7-2). A, Schematic of experimental design presented in this figure. B, Differentially expressed genes were called between Tissue-TRAP, Dounce-TRAP, and Cell-TRAP (+/− Inhibitors) groups (Extended Data Figs. 7-1, 7-3). A subset of genes was activated with cell preparation [Up in Cell-TRAP (−) Inhibitors vs Tissue-TRAP] and were decreased with the addition of inhibitors [Down in Cell-TRAP (+) Inhibitors versus Cell-TRAP (−) Inhibitors; one-way ANOVA, BHMTC, SNK FDR < 0.1, |FC|>2]. These genes were classified as ex vivo activational transcripts prevented by the addition of inhibitors and are given in the heatmap. C, Top 10 biological processes overrepresentation in the ex vivo activational genes prevented by the addition of inhibitors (hypergeometic test, BHMTC, FDR < 0.05). D, Transcription factors overrepresented in the ex vivo activational transcripts prevented by the addition of inhibitors (hypergeometic test, BHMTC, FDR < 0.05). E, Heatmap of select response to oxidative stress pathway genes. F, Heatmap of common chemokines. G, Violin plots of senescent cell marker expression (one-way ANOVA, Tukey’s post hoc test, *p < 0.05). H, Heatmap of 21 ex vivo activational genes identified in at least two previous studies (Ayata et al., 2018; Haimon et al., 2018; Marsh et al., 2020). I, PCA of 21 ex vivo activational genes identified in at least two previous studies (Ayata et al., 2018; Haimon et al., 2018; Marsh et al., 2020).
