

Abstract
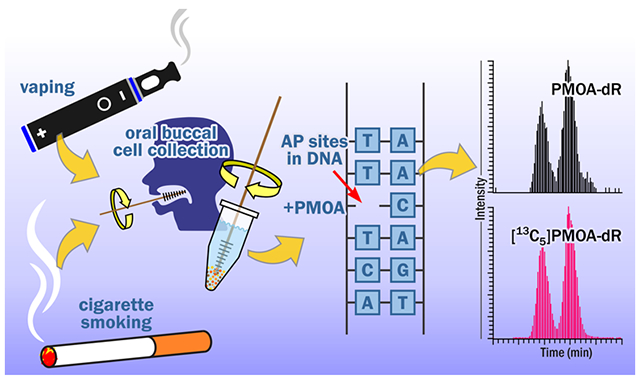
Cigarette smoking is an established risk factor for oral cancer. The health effects of e-cigarettes are still under investigation but may disturb oral cavity homeostasis and cause lung and cardiovascular diseases. Carcinogens and toxicants in tobacco products and e-cigarettes may damage DNA, resulting in the formation of apurinic/apyrimidinic (AP) sites, and initiation of the carcinogenic process. In this study, we optimized a liquid chromatography-nanoelectrospray ionization-high resolution tandem mass spectrometry method to analyze AP sites in buccal cell DNA of 35 nonsmokers, 30 smokers, and 30 e-cigarette users. AP sites in e-cigarette users (median 3.3 per 107 nts) were significantly lower than in smokers (median 5.7 per 107 nts) and nonsmokers (median 6.0 per 107 nts). AP sites in smokers were not significantly different from nonsmokers (p > 0.05). The e-cigarette vaporizing solvents propylene glycol and glycerin were tested and did not protect against AP site formation in in vitro control and carcinogen exposed rat liver homogenates. However, propylene glycol may inhibit bacteria in oral cells, resulting in reduced inflammation and related effects, and reduced AP site levels in e-cigarette user DNA. This is the first study to examine AP site formation in e-cigarette users and to evaluate AP sites in human oral cell DNA.
Graphical Abstract
INTRODUCTION
Cigarette smoking causes about one-third of all cancer deaths in the United States and is the leading cause of lung and oral cavity cancer.1 Due to effective tobacco control policies, cigarette smoking has declined from 21% of adults in 2005 to 14% of adults in 2019, and the proportion of ever smokers who have quit has increased.2 While cigarette smoking has been decreasing, e-cigarette use has dramatically increased, especially in teenagers or young adults; use of e-cigarettes among high school students rose from 1.5% in 2011 to 20.8% in 2018.3,4 The health effects of e-cigarettes are still under investigation but may relate to oral cavity disequilibrium, lung and cardiovascular diseases.4,5
The oral cavity is the first site of contact of tobacco smoke and e-cigarette vapor. Multiple DNA adducts have been detected in oral tissues of cigarette smokers,6 and their levels are frequently higher than in other human tissues.7,8 Compared to other human tissues, oral cell collection procedures for DNA adduct analysis are simple, non-invasive and repeatable. Spontaneous cleavage of the base-deoxyribonucleoside bond of some DNA adducts (such as 7-methyldeoxyguanosine, 7-Me-dGuo) or mechanisms such as base excision repair can result in an apurinic/apyrimidinic (AP) site, which is a location in DNA that has lost either a purine or pyrimidine base, leaving a deoxyribosyl moiety.9,10 Our previous study found that exposure of rats to the tobacco-specific carcinogen 4-(methylnitrosamino)-1-(3-pyridyl)-1-butanone (NNK) resulted in increased formation of AP sites in rat liver and lung DNA both in vivo and in vitro. Increased AP sites were also found in nasal and oral mucosa DNA, target tissues of N’-nitrosonornicotine (NNN), in (S)-NNN exposed rats.11 Although cells have active excision repair mechanisms which restore the normal base sequence in DNA, some unrepaired AP sites can cause genomic instability and result in mutations and cancer.12,13 The quantification of AP sites may provide a general measurement of DNA exposure to mutagens.14
Several approaches have been developed to stabilize deoxyribose in order to quantify AP sites in genomic DNA.11 Chen et al. used O-(pyridin-3-yl-methyl)hydroxylamine (PMOA) to react with AP sites to form PMOA-dR (Scheme 1) before DNA isolation to limit the formation of artifacts during DNA processing.15 Then they used liquid chromatography tandem mass (LC-MS/MS) to measure PMOA-dR in rat tissues. We have applied their approach to derivatize and measure AP sites from rat and human tissues.11
Scheme 1.
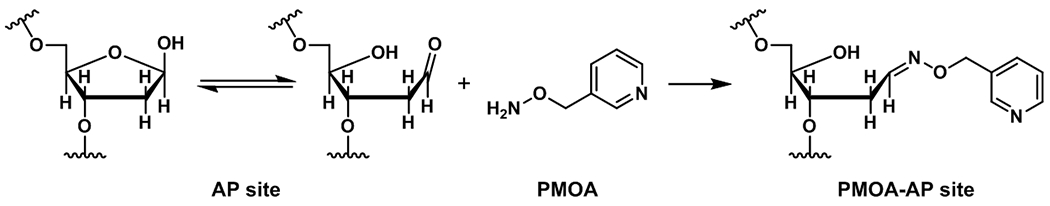
Derivatization reaction of the ring-opened aldehydic form of the deoxyribosyl moiety with PMOA forms a stable hydrazone.11
In this study, we quantified PMOA-dR (AP sites) in oral buccal cells from smokers, e-cigarette users, and nonsmokers, using LC-nanoelectrospray ionization-high resolution MS/MS (LC-NSI-HRMS/MS). Given the low DNA yield in oral buccal cells, we further optimized the method to increase the sensitivity of DNA and PMOA-dR measurements and examined the possible formation of artifacts. This is the first study to investigate AP sites in human oral cells and in e-cigarette users.
MATERIALS AND METHODS
Materials and Chemicals
(3S,4R)-3,4,5-Trihydroxypentanal,O-pyridin-3-yl-methyl oxime (PMOA-dR) and [13C5]PMOA-dR were obtained as described previously.15 Deoxyguanosine (dGuo) was obtained from Chem-Impex Int’l Inc. (Wood Dale, IL). [13C1015N5]dGuo was procured from Cambridge Isotope Laboratories (Tewksbury, MA). 4-[(Acetoxymethyl)nitrosamino]-1-(3-pyridyl)-1-butanone (NNKOAc) was purchased from Toronto Research Chemicals (Toronto, Canada). Glycerin was purchased from Oakwood Products Inc. (Estill, SC). Propylene glycol was purchased from Sigma-Aldrich Chemical Co. (Milwaukee, WI). Porcine liver esterase was obtained from MyBioSource (San Diego, CA). Reagents and enzymes for DNA isolation were obtained from Qiagen Sciences (Germantown, MD). All other chemicals and solvents were purchased from Sigma-Aldrich Chemical Co. (Milwaukee, WI) or Fisher Scientific (Fairlawn, NJ).
Animal experiment
This study was approved by the University of Minnesota Institutional Animal Care and Use Committee. Male F344 rats were purchased from Charles River Laboratories (Kingston, NY) and housed two rats per microisolator cage with Harlan Teklad ¼ in. corn cob bedding (Harlan, Indianapolis, IN) in the Research Animal Resources facility under the following conditions: 20-24 °C, 30-70% relative humidity, and 12/12h light/dark cycle. The rats were sacrificed and the tissues stored at −80 °C. Approximately 50 mg of rat liver tissue was homogenized with a Tissue Ruptor (Qiagen Sciences, Germantown, MD) and incubated with 0 (control), 8.04 mM glycerin, 9.74 mM propylene glycol, or 8.04 mM glycerin plus 9.74 mM propylene glycol without NNKOAc or with 279 μM NNKOAc for 1.5 h in the presence of porcine liver esterase (5.5 U) before being treated by PMOA (n=2 per dose group) for 1.5 h at 37 °C.
Human samples
This study was approved by the University of Minnesota Institutional Review Board.
Oral brushings and urine samples were collected from 30 smokers, 30 e-cigarette users, and 35 nonsmokers recruited to Tobacco Research Programs, University of Minnesota. Inclusion criteria were as follows: age >18, in stable and good physical and mental health, excellent oral health, no current infection as determined by medical history and investigator assessment, no current use of medicinal nicotine products or any tobacco products other than those required for the groups below, avoid the use of marijuana or other non-combustible products 2 days before study visits, no current use of antibiotics or anti-inflammatory agents, body mass index ≤40 kg/m2, consumption of less than 21 alcoholic drinks per week, and not pregnant, nursing or planning on becoming pregnant while enrolled in the study. Smokers were required to have a stable smoking pattern of at least five cigarettes per day for a minimum of four days per week for the past year and have a carbon monoxide (CO) >8 ppm. e-Cigarette users were required to have not smoked cigarettes for at least 12 weeks and have exclusively used e-cigarettes for at least 3 months and at least 4 days per week and have a CO <6 ppm. Both e-cigarette users and smokers did not intend to quit using these products in the next six months. Nonsmokers were required to have smoked no more than 100 cigarettes in their lifetime and have a CO <6 ppm.
Participants visited the clinic once monthly for six months. They were asked to visit in the morning before eating breakfast or after at least a 4-h fast, and no ingestion of alcohol, or use of cigarettes or e-cigarettes immediately before the clinic visit. Participants provided a spot urine sample and buccal brushings. At each visit, a urine sample was collected in a 100 mL sterile specimen cup and immediately frozen at −20 °C . For the buccal brushings collection, the subjects were asked to brush their teeth 15 min before giving a buccal cell sample. The buccal cells were collected by brushing the oral mucosa inside one cheek with a clean “Cytobrush” and swirling the brush for 20 sec in a sterile polypropylene centrifuge tube prefilled with saline (5mL) to transfer the collected buccal cells from the brush into the liquid. The process was then repeated on the other cheek with a new brush and a new tube. After the collection, the samples were centrifuged at 2500 x g for 15 min at 4°C to pellet cells; the pellets were washed twice with 1mL of phosphate buffered saline (pH 7.4), pipetted into 2 mL DNA Lo-bind tubes and stored at −20 °C until DNA isolation and analysis.
All buccal cell donor information is shown in the Supporting Information (SI) Table S1a, b, c. Urinary cotinine, 4-(methylnitrosamino)-1-(3-pyridyl)-1-butanol (NNAL), and cyanoethyl mercapturic acid (CEMA) concentrations were analyzed using previously reported methods.16–18
Derivatization of AP Sites in buccal cells and DNA Isolation
The experimental flow chart is shown in Figure 1. Buccal cell samples were thawed, and those with volume > 400 μL were centrifuged at 16 000g for 5 min at 4 °C and then the supernatant was discarded. All the samples were made up to 400 μL with 0.9% saline solution. Then 400 μL HE buffer [50 mM HEPES buffer and 10 mM EDTA (pH 8.0)], proteinase K (20 μL, 20 mg/mL), 10% sodium dodecyl sulfate (SDS) (85 μL), and PMOA (30 μL of 100 mM) were added into each sample, and the solution was incubated in a water bath at 37 °C for 1.5 h. Butyraldehyde (30 μL, 1 M in 50% isopropanol/H2O) was then added to quench the remaining PMOA by further incubation for 10 min. The samples were kept on ice for 5 min, and then 400 μL ethanol was added. The DNA solution was then loaded on to the QiaAmp DNA Mini spin column and centrifuged at 6000 g for 1 min, and the filtrate was discarded. Qiagen buffer AW1 (500 μL) was then added into the spin column and centrifuged at 6000 g for 1 min, and the filtrate was discarded. Then Qiagen buffer AW2 (500 μL) was added and centrifuged at 20 000 g for 3 min, and the filtrate was discarded. Then 2 × 100 μL H2O was added to the spin column to elute the DNA into the Eppendorf tubes by centrifuging at 6000 g for 1 min.
Figure 1.
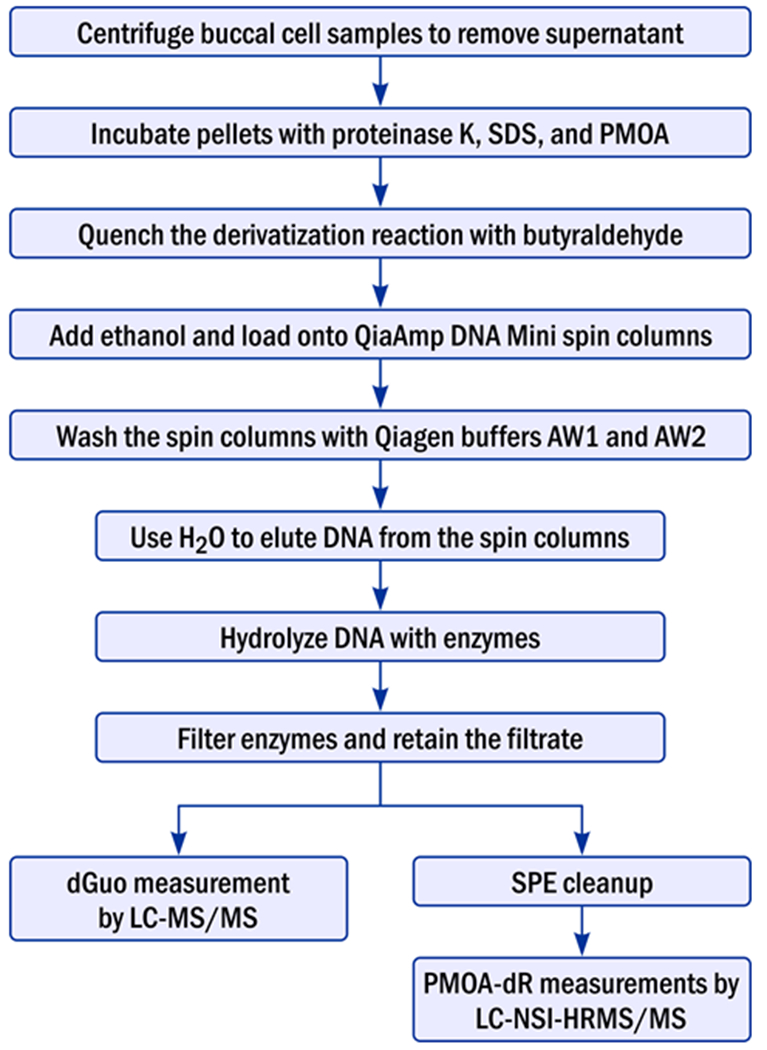
Flow chart of the experimental procedure for analysis of AP sites in DNA of buccal cell samples.
Another buffer system was also tested to evaluate possible artefacts. After discarding the supernatant from centrifugation, 400 μL high salt AL lysis buffer (from Qiagen, content unknown), proteinase K (20 μL), HE buffer (85 μL), and PMOA (30 μL of 100 mM) were added into each sample, and the solution was incubated in a water bath at 37 °C for 1.5 h. The rest of the procedure was the same as above.
Enzymatic Digestion of DNA.
[13C5]PMOA-dR (0.02 pmol) and [13C1015N5]dGuo (1.4 nmol) were added to the DNA prior to enzymatic digestion. The DNA samples were incubated at 37 °C with DNase I (10 U) and nuclease P1 (> 0.1 U) for 3 h, followed by phosphodiesterase I (1 μU) and alkaline phosphatase (6 U) for 15 h. After DNA digestion, the samples were filtered with a 10K filter to remove the enzymes. Ten percent of the filtrate was taken to measure dGuo by LC–MS/MS. The rest was further purified by solid phase extraction (SPE).11
LC–NSI-HRMS/MS Method for Quantitation of PMOA-dR.
Quantitation of PMOA-dR was conducted with a Linear Trap Quadropole (LTQ) Orbitrap Velos instrument (Thermo Scientific, Waltham, MA) interfaced with a Dionex Ultimate 3000 UHPLC system (NCS-3500RS pump and WPS-3000PL autosampler) using NSI. The instrument conditions were summarized previously.11 The chromatograms obrtained from oral cell DNA samples from a blank, a nonsmoker, a smoker, and an e-cigarette user are shown in Figure 2. PMOA-dR and [13C5]PMOA-dR have E and Z isomers, resulting in 2 peaks, but were integrated as a single peak as in previous publications.11,15
Figure 2.
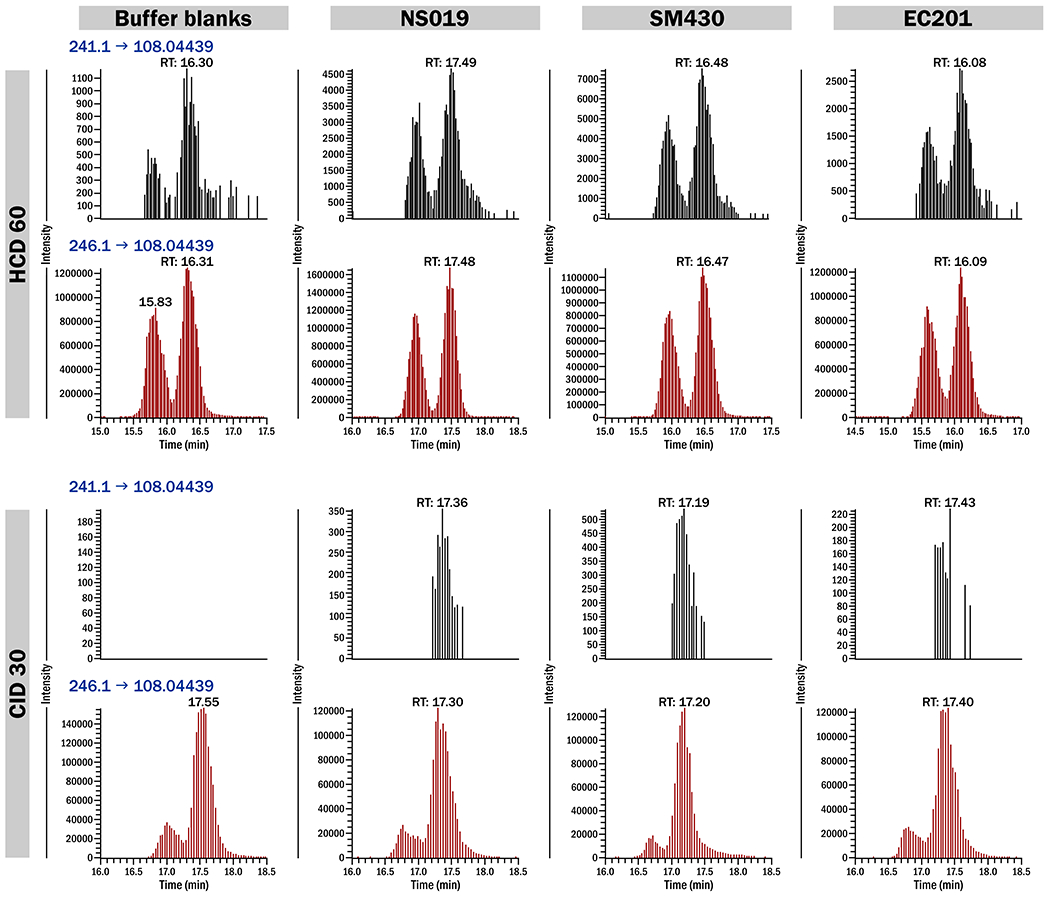
LC-ESI-MS/MS chromatograms of PMOA-dR in buffer blanks, oral buccal cell DNA of a nonsmoker (NS019), a smoker (SM430), and an e-cigarette user (EC201). Each sample was fragmented with either HCD 60 or CID 30. PMOA-dR (black) and [13C5]PMOA-dR (red) were analyzed with a high resolution LTQ Orbitrap Velos mass spectrometer.
Analysis of dGuo by LC–MS/MS.
Analysis of dGuo was performed on a TSQ Vantage triple-quadrupole mass spectrometer (Thermo Scientific, Waltham, MA) interfaced with a Dionex Ultimate 3000 UHPLC system (NCS-3500RS pump and WPS-3000PL autosampler), and a Zorbax C18 column (5 μm particles with 100 Å pores, 150 mm length × 0.5 mm diameter, Agilent) at a flow rate of 10 μL/min at room temperature. The 10% DNA hydrolysis solution filtrate was freeze-dried and diluted with 2 volumes of 5mM NH4OAc before injection onto the column. The LC program was a linear gradient from 3 to 10% CH3CN over a period of 10 min, followed by ramping to 90% CH3CN within 1 min and holding at this composition for 2 min. The gradient was then returned to 3% CH3CN in 1 min followed by 5 min re-equilibration. The first 5 min of the eluants were diverted to waste. Other parameters were the same as described previously.11 The measured dGuo levels are shown in Tables S1a–c.
Quality Control.
While analyzing buccal cell samples, buffer blanks (starting from derivatization or from enzyme hydrolysis), calf thymus DNA (acting as positive control), rat liver DNA (acting as positive control), and E.coli DNA were also analyzed as quality control (QC) samples following the same procedure. The results are shown in Table 1. We analyzed 3 buffer blanks and 2 calf thymus positive control samples in each batch of samples (15 to 20 samples). We detected PMOA-dR in all buffer blanks and oral cell samples. Average PMOA-dR amounts in the blanks accounted for 38 ± 43% in nonsmokers, 31 ± 16% in e-cigarette users, and 17 ± 11% in smokers. The amount of PMOA-dR in the blanks of each batch were subtracted from the samples of the same batch. Samples with PMOA-dR amounts lower than the buffer blanks or with <10 pmol dGuo were classified as not detected. All of these samples were excluded from statistical tests or calculations.
Table 1.
AP site levels (PMOA-dR) in buffer blanks, control rat liver DNA, calf thymus DNA and E.coli DNA analyzed along with human buccal cell samples (reported values are mean ± standard deviation).
| Sample Type | N | PMOA-dR (fmol) | dGuo (pmol) | PMOA-dR (per 107 nt) |
|---|---|---|---|---|
| buffer blanks | 12 | 0.037 ± 0.026 | ND | |
| rat liver DNA | 3 | 0.42 ± 0.20 | 943 ± 278 | 0.78 ± 0.33 |
| calf thymus DNA | 11 | 2.98 ± 0.93 | 21.4 ± 2.3 | 291 ± 75 |
| E. coli DNA | 2 | 0.81 ± 0.16 | 112 ± 5 | 15.4 ± 2.4 |
| maximum bacterial contribution to buccal cell AP sites | 0.20 |
Data Analysis.
Descriptive statistical analyses were completed with Microsoft Excel 2013. Since the data were not normally distributed, the Mann-Whitney U test (one tailed) was used to compare means between the rat liver exposed and control groups and to compare means of every two groups among smokers, e-cigarette users, and non-smokers. Student’s t test (type 1, one tailed, equal variance) was also used to compare every two groups of the log-transformed oral buccal cell sample data since their transformed data were normally distributed; the statistical results can be used to interpret the median differences of original data. Regression analysis was used to investigate the correlation between AP sites and urinary biomarkers, and subject age.
RESULTS
Factors influencing AP site quantification.
We modified our published method11 in order to quantify AP sites in the relatively small amounts of DNA obtained from buccal cells. The protocol is outlined in Figure 1. In a previous study, DNA was isolated using a commercial protocol for DNA purification from oral cells.19 That protocol requires using a cell lysis buffer “AL” with high salt content and heating the samples at 56 °C for 10 min. To avoid the potential formation of AP sites,20 we modified the protocol to omit the heating step. We compared AP site formation in AL buffer and in SDS solution. As shown in Table 2, even though the DNA yield in SDS solution was 2 to 20 times lower than that in AL buffer, AP site artefacts in AL buffer were 2 to 7 fold higher than in SDS solution. To minimize AP site formation during our experimental procedure, we opted to use SDS solution. Especially for the buccal cell samples, the DNA yield was only increased from 594 ± 40 pmol dGuo in SDS solution to 1136 ± 225 pmol dGuo in AL buffer, while AP site levels increased from 0.86 ± 0.08 per 107 nts in SDS solution to 6.04 ± 0.86 per 107 nts in AL buffer.
Table 2.
Comparison of AP site (PMOA-dR) formation using sodium dodecyl sulfate (SDS) solution and AL buffer (reported values are mean ± standard deviation).
| Sample type | Lysis solution | N | dGuo (pmol) | PMOA-dR (per 107 nts) |
|---|---|---|---|---|
| nonsmoker buccal cell DNA | SDS | 2 | 594 ± 40 | 0.86 ± 0.08 |
| AL buffer | 2 | 1136 ± 225 | 6.04 ± 0.86 | |
| E.coli DNA | SDS | 2 | 112 ± 5 | 15.37 ± 2.42 |
| AL buffer | 2 | 357 ± 3 | 23.29 ± 6.09 | |
| calf thymus DNA | SDS | 2 | 23.9 ± 0.2 | 391 ± 5 |
| AL buffer | 2 | 509 ± 6 | 521 ± 21 |
We also found it necessary to increase the sensitivity of dGuo quantification because some buccal cell samples had low amounts of DNA (<0.1 μg). This was accomplished by using 5mM NH4OAc (the aqueous mobile phase in LC-MS/MS) to dissolve the dGuo, which increased the response of dGuo by 14 to 78% compared to using H2O to dissolve dGuo (Table S2). With the optimized method, dGuo was detectable in all the buccal cell samples. Samples (Table S1a–c) with dGuo level <10 pmol were excluded to avoid inflation of DNA based PMOA-dR levels. For samples with dGuo level > 10 pmol, nonsmokers have statistically significant lower dGuo levels than smokers and e-cigarette users (p < 0.05); there are no statistically significant difference in dGuo levels between smokers and e-cigarette users (p < 0.05).
For the instrumentation to analyze AP sites, we initially used LC-MS/MS but failed to detect any peaks in the oral cell samples. Therefore, we switched to an LTQ Orbitrap Velos mass spectrometer, and two methods - higher-energy collisional dissociation (HCD) and collision-induced dissociation (CID) - were used to fragment PMOA-dR. Chen et al. used CID fragmentation while analyzing PMOA-dR by LC-MS/MS.15 For LC-NSI-HRMS/MS, HCD fragmentation has been generally applied. We found that CID fragmentation can achieve a sensitivity of 0.1 fmol PMOA-dR on column whereas HCD can reach as low as 0.005 fmol on column. With this limit of detection, PMOA-dR was also detected in all the buffer blanks (Figure 2). The PMOA-dR in buffer blanks probably came from slight contamination of buffer solutions, so these solutions should be changed frequently to limit this problem in future studies. In this study, average PMOA-dR levels in blanks of each batch were subtracted from the samples in that batch.
Bacteria may be present in oral cell samples and AP sites in the bacterial DNA could mask those being analyzed. Therefore, we analyzed AP sites in E.coli DNA. The PMOA-dR level in E.coli DNA was ~15 per 107 nts (Table 1), which is higher than found in most buccal cell DNA samples. However, buccal cell DNA contained <0.4% E.coli DNA and <1% total bacterial DNA according to amplification of 16S rDNA in E.coli using qPCR in 4 nonsmoker buccal cell samples (unpublished data from our laboratory). Therefore, AP sites contributed by bacteria were <0.2 per 107 nts in the tested buccal cell samples, much lower than the level measured in human DNA. Thus, bacterial contribution of AP sites is not a concern.
AP site levels were also compared in different types of QC samples with different DNA contents as shown in Table 1. The AP site levels in calf thymus DNA (with 21.4 ± 2.3 pmol dGuo), rat liver DNA (with 943 ± 278 pmol dGuo) and E.coli DNA (with 112 ± 5 pmol dGuo) were 291 ± 75, 0.78 ± 0.33, and 15.4 ± 2.4 AP site per 107 nts, respectively, implying the stability and the applicability of this method to derivatize and release PMOA-dR for DNA amounts of <20 pmol to >1000 pmol dGuo.
AP site formation in oral cells of smokers, nonsmokers and e-cigarette users
Since the mouth is the first site of exposure to tobacco smoke, and oral cells are expected to provide relatively high levels of DNA adducts, we measured AP sites in human buccal cells. The subjects included 30 smokers, 35 nonsmokers, and 30 e-cigarette users. The smoking status of these subjects was confirmed by urinary NNAL, cotinine, and CEMA concentrations (Table S1a–c). As shown in Table 3, AP sites were detected in 26 out of 35 nonsmokers, 27 out of 30 smokers, and 28 out of 30 e-cigarette users. The average levels of AP sites among nonsmokers, smokers and e-cigarette users were 9.3 ± 9.8, 8.6 ± 9.2, and 6.0 ± 6.7 AP sites per 107 nts. The median amounts among nonsmokers, smokers and e-cigarette users were 6.0, 5.7, and 3.3 AP site per 107 nts, respectively. AP sites in e-cigarette users were significantly lower than smokers and nonsmokers (Table 3). We also analyzed smoking induced AP site differences among different age groups (Table 3). In the group of ages 30 - 50, AP sites in e-cigarette users were significantly lower than nonsmokers and smokers (p < 0.05). In the group age <= 30, the mean of e-cigarette users were also significantly lower than the mean of nonsmokers (p < 0.05). We also divided the smokers, e-cigarette users, and non-smokers based on gender and race. No significant differences were found among gender or race subgroups (p > 0.05).
Table 3.
Comparison of AP site levels in human buccal cell DNA with different smoking status stratified by age (unit: PMOA-dR per 107 nts)
| age <= 30 | ||||||
|---|---|---|---|---|---|---|
| Smoking status | N | DFa (%) | AP sites: Mean ± SD | U testb | Median | t-test for log-transformedb |
| Nonsmoker | 13 | 87 | 11.3 ± 11.7 | a | 6.2 | a |
| Smoker | 6 | 75 | 7.2 ± 7.3 | ab | 4.5 | a |
| e-cigarette user | 12 | 92 | 8.1 ± 9.6 | b | 3.8 | a |
| age 30-50 | ||||||
| Smoking status | N | DF (%) | Mean ± SD | U testb | Median | t-test for log-transformedb |
| Nonsmoker | 10 | 71 | 8.4 ± 8.2 | a | 5.6 | a |
| Smoker | 15 | 100 | 7.7 ± 4.9 | a | 6.0 | a |
| e-cigarette user | 12 | 92 | 3.9 ± 2.1 | b | 3.0 | b |
| age > 50 | ||||||
| Smoking status | N | DF (%) | Mean ± SD | U testb | Median | t-test for log-transformedb |
| Nonsmoker | 3 | 50 | 3.5 ± 0.9 | NAc | 3.8 | a |
| Smoker | 6 | 86 | 12.3 ± 17.2 | NAc | 5.8 | a |
| e-cigarette user | 4 | 100 | 5.6 ± 4.2 | NAc | 5.1 | a |
| Total | ||||||
| Smoking status | N | DF (%) | Mean ± SD | U testb | Median | t-test for log-transformedb |
| Nonsmoker | 26 | 74 | 9.3 ± 9.8 | a | 6.0 | a |
| Smoker | 27 | 90 | 8.6 ± 9.2 | a | 5.7 | a |
| e-cigarette user | 28 | 93 | 6.0 ± 6.7 | b | 3.3 | b |
DF: detection frequency.
U test: Mann-Whitney U test, used to compare means of two groups of non-normally distributed data. t-test for log-transformed: Student’s t-test was used to compare means of every two groups of transformed data, the test results can be used to interpret median difference of the original data. The statistical test results should be read according to smoking status; the group sharing the same letter do not have statistically different (p < 0.05) PMOA-dR levels. The group with test result “a” is significantly higher than the group with test result “b” (p < 0.05); the group with test result “ab” is not significantly different from the group with test result “a” or the group with test result “b”.
NA: not available.
Propylene glycol and glycerin are the two major components of e-cigarette liquid.17 To test whether propylene glycol and glycerin together or alone have protective effects on the formation of AP sites, we conducted an in vitro experiment by exposing rat liver homogenate to propylene glycol and glycerin in the absence and presence of NNKOAc, a chemically activated form of NNK, which induced extra AP sites in our previous study.11 As shown in Figure 3, propylene glycol and glycerin did not reduce the formation of AP sites in rat liver DNA. But we still observed that AP sites were significantly higher in NNKOAc exposed rat liver homogenates than in the rat liver homogenates without NNKOAc (p<0.01) in this study. Other ingredients in e-cigarettes or certain mechanisms in in vivo cell systems may induce the protective effect on AP site formation.
Figure 3.
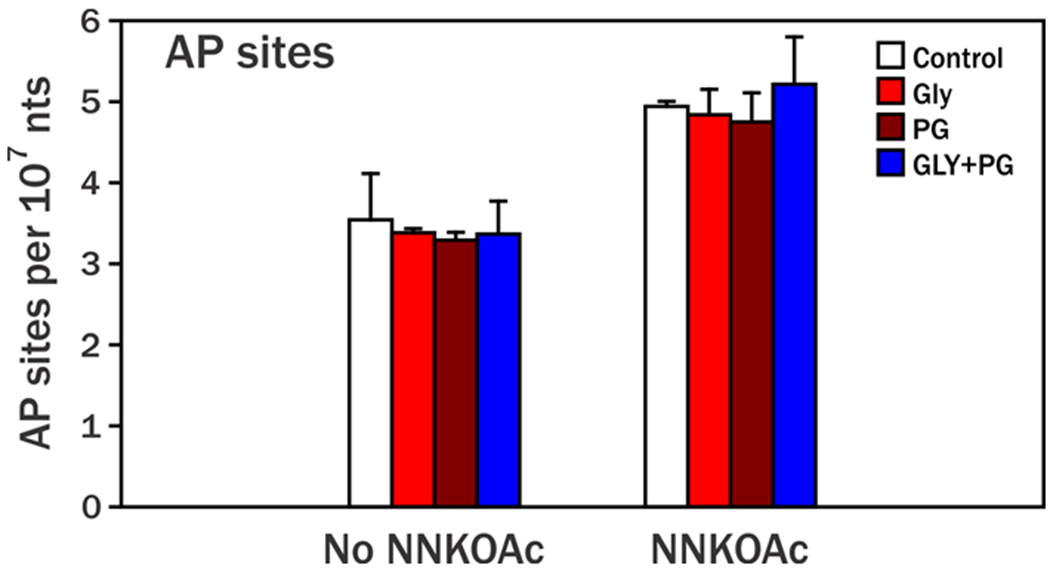
Dependence of AP site formation on exposure to glycerin (Gly), and/or propylene glycol (PG) with or without NNKOAc presence. Liver homogenates (~50 mg) were incubated with 0 (control), 8.04 mM Gly, 9.74 mM PG, or 8.04 mM Gly + 9.74 mM PG without NNKOAc or with 279 μM NNKOAc for 1.5 h before being treated by PMOA. Esterase was added to catalyze the release of NNK-OH from NNKOAc. Each concentration level was performed in duplicate. Relative to controls, no significant differences in AP sites were observed in liver incubated with Gly, PG, or Gly plus PG with or without NNKOAc (p > 0.05). AP sites in liver exposed to NNKOAc were significantly higher than those not exposed to NNKOAc (p < 0.05), similar to our previous study.11
No previous literature has reported AP site levels in human oral samples but tobacco related DNA adducts in oral cells have been measured in multiple studies. As shown in Figure 4 and Table S3, AP site levels in buccal cells of this study were higher than εdAdo and γ-OH-Acr-dGuo in both buccal cells and oral rinses,21 3-ethyladenine (3-EtAde), 7-ethylguanine (7-EtGua), and ethylthymidine (ethyl-dT) in saliva,22 similar to γ-OH-Acr-dGuo (also known as 1, N2-propano-dGuo) in gingival tissue and N2-ethylidene-dGuo in oral rinses,23,24 but lower than 4-hydroxy-1-(3-pyridyl)-1-butanone (HPB)-releasing DNA adducts in buccal cells and oral rinses.8 AP site levels in oral cells were also higher than AP sites in other tissues. AP sites in buccal cells of this study were 2 to 3 times higher than those in human lung (2.88 ± 1.39 and 2.65 ± 1.29 AP sites/107 nts for smokers and nonsmokers) and leukocytes (2.07 ± 0.60 and 2.10 ± 0.59 AP sites/107 nts for smokers and nonsmokers), as shown in Table S4.11
Figure 4.
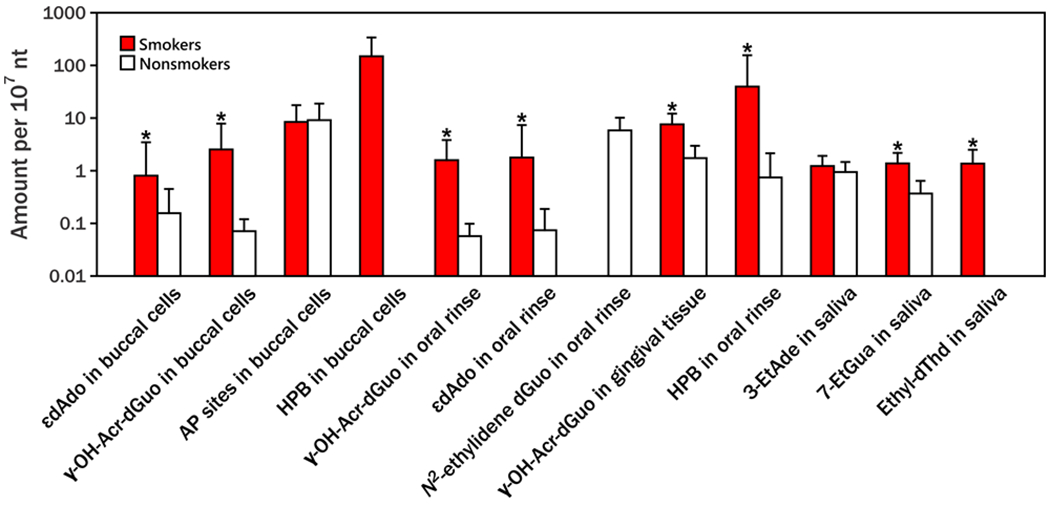
Comparison of average DNA adduct levels and AP site levels in different oral DNA samples from smokers and non-smokers. The DNA adduct and AP site data are arranged from high to low in each sample type. * indicates that smokers had significantly higher amounts than non-smokers for that specific type of DNA adduct. Abbreviation and references: 1,N6-etheno-dAdo (εdAdo) and ɣ-OH-Acr-dGuo in buccal cells and oral rinse were from Paiano et al. (2020);21 AP sites in buccal cells were from this study; 4-hydroxy-1-(3-pyridyl)-1-butanone (HPB)-releasing DNA adducts in buccal cells and oral rinses were from Stepanov et al. (2013);8 N2-ethylidene-dGuo in oral rinse was from Balbo et al. (2012);24 ɣ-OH-Acr-dGuo (also known as 1, N2-propano-dGuo) in gingival tissues was from Nath et al. (1998);23 3-ethyladenine (3-EtAde) and 7-ethylguanine (7-EtGua) in saliva were from Chen et al. (2014);22 ethylthymidine (Ethyl-dThd) adducts in saliva were from Chen et al. (2014).22 Detailed sources and levels are presented in SI Table S3.
DISCUSSION
This is the first study to quantify AP sites in human oral tissues. A sensitive and efficient method has been developed. Due to the low DNA yield (<1 μg) from oral buccal cells, PMOA-dR quantification became challenging. Artefacts are easily introduced during the experimental procedures.15 In this study, since the DNA amount was much lower and the protein interference was much less in the oral buccal cells, we derivatized the DNA at the same time as lysing the cells and digesting the proteins to minimize artefact formation. To maximize the DNA yield, QIAamp silica-gel membranes (Qiagen), previously used to extract DNA from oral cells for the analysis of HPB-releasing DNA adducts in our laboratory,8,19 were applied. We also tested DNA yields and artefact formation in two different types of cell lysis systems, and selected SDS solution, which produces lower artefacts, for the final analysis. In terms of instrumentation, we measured PMOA-dR (AP sites) in oral cells using LC-NSI-HRMS/MS and adopted HCD fragmentation, which has been verified to have high sensitivity and specificity in our published studies.11,19
We analyzed AP sites in oral cells because multiple types of DNA damage in oral cells or saliva have been associated with tobacco use. Elevated levels of mutagenic and tumorigenic malondialdehyde-DNA adducts have been found in oral cells of smokers compared to age-, sex-, and race-matched nonsmokers.25 As shown in Table S3 and Figure 4, levels of several ethylated DNA adducts were significantly higher in smokers’ than in nonsmokers’ saliva.22,26 Salivary 7-ethylGua levels were significantly correlated with the number of cigarettes smoked per day as well as with the smoking index.26 Acrolein DNA adducts in oral rinse and buccal cells were also significantly higher in smokers than in nonsmokers.21 DNA adducts of heterocyclic aromatic amines and related compounds were more frequently detected in saliva of smokers than nonsmokers.27 Tobacco nitrosamine specific HPB-releasing DNA adducts were significantly higher in mouthwash of smokers than in nonsmokers.8 Tobacco-associated genetic mutations and non-genetic changes have been reported in oral cells in multiple studies.28 Therefore, we expected to observe higher levels of AP sites in buccal cell DNA from smokers than nonsmokers. However, our results showed that AP sites in cigarette smokers were not significantly different from those in nonsmokers in all age groups investigated, and AP sites in e-cigarette users were significantly lower than those in nonsmokers and cigarette smokers, especially at ages 31 to 50.
Looking more closely at the data, we find that AP sites were less frequently detected in non-smokers than in smokers and e-cigarette users. There were 9 subjects out of 35 among nonsmokers in which AP sites were not detected but only 2 out of 30 e-cigarette users and 3 out of 30 smokers. The variation of the AP site levels in each group was quite large.29 In the detected samples, AP sites varied from 2.46 to 43.1 per 107 nts in nonsmokers, 1.17 to 32.3 per 107 nts in e-cigarette users, and 1.92 to 46.6 per 107 nts in smokers. The AP site ranges in lung and leukocyte DNA were much less, <5 AP sites per 107 nts.11 The greater range of values in samples from the oral cavity may be due to differences in oral health status, bacterial interactions, oral hygiene and dental health, and other individual characteristics.8 DNA also tends to be detected at relatively higher levels in smokers, followed by e-cigarette users and nonsmokers if not excluding samples with dGuo <10 pmol (Table S1a–c), which may be due to cell proliferation relating to smoking induced inflammation and oxidation.29 Further studies measuring biomarkers of oxidative stress and inflammation along with AP sites in oral cells are required to confirm this hypothesis. The lower DNA levels in nonsmokers may inflate the AP site levels a little bit and weaken the AP site difference between nonsmokers and smokers. Aging is also an important confounder for AP site interpretation.30 In our previous study,11 age was significantly correlated with AP sites in leukocyte DNA of nonsmokers. In this study, we attempted to match age among the subjects but due to limitations in sample collection, the average age of the smokers was significantly higher than the nonsmokers and e-cigarette users. Larger sample sizes are required to evaluate these other risk factors.
Another factor to be considered is bacterial interaction. Unlike lung and leukocyte samples, oral samples may contain more bacterial DNA which could complicate interpretation of the AP site data. The oral cavity has the second largest and diverse microbiota after the gut in human body.31 The mouth houses over 700 species of bacteria that colonize the hard surfaces of teeth and the soft tissues of the oral mucosa.32 Based on our measurement, human buccal cell DNA contains <1% bacterial DNA, much higher than the bacterial DNA in rat liver (<0.001%). Given that the concentration of AP sites in E.coli DNA is similar to or slightly higher than that in human DNA, bacteria in human buccal cells don’t interfere with our quantification of AP sites and do not need to be removed. This is unlike N6-methyl-2’-dAdo , which has relatively high levels in bacteria and would definitely be a concern for the quantification of this adduct in oral cells.33
Although bacterial DNA did not affect our reported AP site results because of its low levels, bacteria in the human oral cavity can provoke chronic inflammation by producing reactive oxygen species, reactive nitrogen intermediates and cytokines, which may damage proteins, lipids, DNA, and RNA, and promote carcinogenesis.34 For example, Helicobacter pylori (H. pylori) is the most well-known human pathogen which mediates inflammation resulting in gastric cancer; another example is Fusobacterium nucleatum (F. nucleatum), which can prolong inflammation and potentially downregulate various DNA repair pathways, and eventually induce gene mutations in the colon.35 Both H. pylori and F. nucleatum are Gram-negative microbes abundant in the oral cavity.36,37 H. pylori, F. nucleatum, along with other similar bacteria, may play certain roles in the elevation of AP sites in the oral cavity of nonsmokers, which may not be the case in lung and leukocytes; this may explain why we detected higher AP site levels in buccal cells than in lung and leukocytes (Table S4).11 Our previous study also detected higher AP site levels in the oral mucosa than six other tissues in both control and NNN exposed rats (Table S5).11
If bacteria indeed play a major role in AP site induction in the oral cavity, we might expect to see similar levels of AP sites among e-cigarette users, smokers and nonsmokers. However, AP site levels in e-cigarette users were significantly lower than those in nonsmokers in our study. While the e-cigarette constituents propylene glycol and glycerin alone or together did not have an effect on AP site formation in our in vitro experiment (Figure 3), propylene glycol is nevertheless a potent germicide. Propylene glycol vapor dispersed into the air of an enclosed space produced a marked and rapid bactericidal effect on microorganisms such as pneumococci, streptococci, staphylococci, H. influemae, influenza virus as well as other microbes at 0.5 ppm.38,39 Propylene glycol was also effective on S. mutans, E. faecalis and E. coli with bactericidal activity at 50%, 25% and 50% concentrations, respectively.40 Glycerin has much less antimicrobial activity.40 Propylene glycol in e-cigarettes might inhibit bacteria which are contributing to AP site formation, but further studies are required.
Our results do not suggest in any way that e-cigarettes are safe alternatives to cigarette smoking. e-Cigarette vapor reduces DNA-repair activity and repair proteins XPC and OGG1/2 in mouse lung tissue.41 e-Cigarette vapor can also damage DNA of mouse heart and bladder and human lung and bladder cells.41 Reactive aldehydes and carbonyls of e-cigarette vapor may damage DNA and have other deleterious effects. Furthermore, e-cigarette use can lead to nicotine addiction and eventual use of tobacco products.4
There were some limitations to this study, so the data should be interpreted with caution. First, the buffer background of PMOA-dR was fairly high and was subtracted from the sample levels of PMOA-dR, Secondly, the DNA levels of some samples were quite low and we had to exclude samples with dGuo < 10 pmol; dGuo levels in nonsmokers are significantly lower than those in smokers and e-cigarette users. Another limitation is that the sample size of each group is relatively small so we were not able to control for some potential confounders such as age. These limitations may bias the quantification and mask actual differences among the groups with different smoking status.
CONCLUSIONS
We optimized a method to measure AP sites in oral buccal cells. DNA was enriched in silica membranes, artefacts from buffers were minimized, and fragmentation parameters in LC-NSI-HRMS/MS were optimized to achieve the highest sensitivity. Based on the analysis of 35 nonsmokers, 30 smokers, and 30 e-cigarette users, AP site levels in buccal cells of smokers were not significantly different from nonsmokers. However, AP sites in e-cigarette users were significantly lower than those in nonsmokers and smokers. Propylene glycol in e-cigarette vapor may inhibit inflammation induced by bacteria in the oral cavity. Further studies are required to investigate the possible role of oral cell microbes in the generation of AP sites.
Supplementary Material
ACKNOWLEDGEMENTS
This study was supported by grant number CA-203851 from the U.S. National Cancer Institute (NIH) and the Food and Drug Administration Center for Tobacco Products. The content is solely the responsibility of the authors and does not necessarily represent the views of the NIH or the Food and Drug Administration. Mass spectrometry was carried out in the Analytical Biochemistry Shared Resource of the Masonic Cancer Center, University of Minnesota, supported in part by Cancer Center Support Grant CA-077598. We thank Steven Carmella for help with coordination of the samples, Menglan Chen and Joyce Zhao for the measurements of urinary CEMA, Nicole Thomson from the Sharon E. Murphy laboratory in the Masonic Cancer Center for measurements of urinary cotinine and NNAL, Qiyuan Han from the Natalia Tretyakova laboratory in the Masonic Cancer Center for the determination of bacterial content in the oral cells, Yingchun Zhao for the help with mass spectrometric method development, and Bob Carlson for editorial support.
Footnotes
SUPPORTING INFORMATION
The Supporting Information is available free of charge at https://pubs.acs.org. Levels of AP sites and other biomarkers in buccal cells of nonsmokers, smokers and e-cigarette users; comparison of dGuo response in different solutions; comparison of DNA adducts and AP sites in oral samples of cigarette smokers and nonsmokers; comparison of AP sites in different types of human samples; AP sites in different tissues of rats treated with 14 ppm (S)-NNN in their drinking water.
REFERENCES
- 1.American Cancer Society. (2021) Health Risks of Smoking Tobacco, https://www.cancer.org/healthy/stay-away-from-tobacco/health-risks-of-tobacco/health-risks-of-smoking-tobacco.html (accessed 08/10/2021).
- 2.Centers for Disease Control and Prevention. (2020) Current Cigarette Smoking Among Adults in the United States, https://www.cdc.gov/tobacco/data_statistics/fact_sheets/adult_data/cig_smoking/index.htm (accessed 02/18/2021).
- 3.Centers for Disease Control and Prevention. (2020) About Electronic Cigarettes (E-Cigarettes), https://www.cdc.gov/tobacco/basic_information/e-cigarettes/about-e-cigarettes.html (accessed 2/13/2021).
- 4.Ebersole J, Samburova V, Son Y, Cappelli D, Demopoulos C, Capurro A, Pinto A, Chrzan B, Kingsley K, et al. (2020) Harmful chemicals emitted from electronic cigarettes and potential deleterious effects in the oral cavity. Tobacco Induced Diseases 18, 41–41. [DOI] [PMC free article] [PubMed] [Google Scholar]
- 5.American Lung Association. (2020) The Impact of E-Cigarettes on the Lung, https://www.lung.org/quit-smoking/e-cigarettes-vaping/impact-of-e-cigarettes-on-lung (accessed 02/15/2021).
- 6.Hecht SS (2017) Oral cell DNA adducts as potential biomarkers for lung cancer susceptibility in cigarette smokers. Chem. Res. Toxicol 30, 367–375. [DOI] [PMC free article] [PubMed] [Google Scholar]
- 7.Borthakur G, Butryee C, Stacewicz-Sapuntzakis M, and Bowen PE (2008) Exfoliated buccal mucosa cells as a source of DNA to study oxidative stress. Cancer Epidemiol. Biomarkers Prev 17, 212–219. [DOI] [PubMed] [Google Scholar]
- 8.Stepanov I, Muzic J, Le CT, Sebero E, Villalta P, Ma B, Jensen J, Hatsukami D, and Hecht SS (2013) Analysis of 4-hydroxy-1-(3-pyridyl)-1-butanone (HPB)-releasing DNA adducts in human exfoliated oral mucosa cells by liquid chromatography–electrospray ionization–tandem mass spectrometry. Chem. Res. Toxicol 26, 37–45. [DOI] [PMC free article] [PubMed] [Google Scholar]
- 9.Boysen G, Pachkowski BF, Nakamura J, and Swenberg JA (2009) The formation and biological significance of N7-guanine adducts. Mutat. Res 678, 76–94. [DOI] [PMC free article] [PubMed] [Google Scholar]
- 10.Nakamura J, and Swenberg JA (1999) Endogenous apurinic/apyrimidinic sites in genomic DNA of mammalian tissues. Cancer Res. 59, 2522–2526. [PubMed] [Google Scholar]
- 11.Guo J, Chen H, Upadhyaya P, Zhao Y, Turesky RJ, and Hecht SS (2020) Mass spectrometric quantitation of apurinic/apyrimidinic sites in tissue DNA of rats exposed to tobacco-specific nitrosamines and in lung and leukocyte DNA of cigarette smokers and nonsmokers. Chem. Res. Toxicol 33, 2475–2486. [DOI] [PMC free article] [PubMed] [Google Scholar]
- 12.Kidane D, Murphy DL, and Sweasy JB (2014) Accumulation of abasic sites induces genomic instability in normal human gastric epithelial cells during Helicobacter pylori infection. Oncogenesis 3, e128–e128. [DOI] [PMC free article] [PubMed] [Google Scholar]
- 13.Talpaert-Borlè M (1987) Formation, detection and repair of AP sites. Mutat. Res 181, 45–56. [DOI] [PubMed] [Google Scholar]
- 14.Boturyn D, Constant J-F, Defrancq E, Lhomme J, Barbin A, and Wild CP (1999) A simple and sensitive method for in vitro quantitation of abasic sites in DNA. Chem. Res. Toxicol 12, 476–482. [DOI] [PubMed] [Google Scholar]
- 15.Chen H, Yao L, Brown C, Rizzo CJ, and Turesky RJ (2019) Quantitation of apurinic/apyrimidinic sites in isolated DNA and in mammalian tissue with a reduced level of artifacts. Anal. Chem 91, 7403–7410. [DOI] [PMC free article] [PubMed] [Google Scholar]
- 16.Hecht SS, Carmella SG, Chen M, Koch JFD, Miller AT, Murphy SE, Jensen JA, Zimmerman CL, and Hatsukami DK (1999) Quantitation of urinary metabolites of a tobacco-specific lung carcinogen after smoking cessation. Cancer Res. 59, 590–596. [PubMed] [Google Scholar]
- 17.Hecht SS, Carmella SG, Kotandeniya D, Pillsbury ME, Chen M, Ransom BW, Vogel RI, Thompson E, Murphy SE, et al. (2015) Evaluation of toxicant and carcinogen metabolites in the urine of e-cigarette users versus cigarette smokers. Nicotine Tob Res 17, 704–709. [DOI] [PMC free article] [PubMed] [Google Scholar]
- 18.Chen M, Carmella SG, Sipe C, Jensen J, Luo X, Le CT, Murphy SE, Benowitz NL, McClernon FJ, et al. (2019) Longitudinal stability in cigarette smokers of urinary biomarkers of exposure to the toxicants acrylonitrile and acrolein. PLOS ONE 14, e0210104. [DOI] [PMC free article] [PubMed] [Google Scholar]
- 19.Ma B, Ruszczak C, Jain V, Khariwala SS, Lindgren B, Hatsukami DK, and Stepanov I (2016) Optimized liquid chromatography nanoelectrospray–high-resolution tandem mass spectrometry method for the analysis of 4-hydroxy-1-(3-pyridyl)-1-butanone-releasing DNA adducts in human oral cells. Chem. Res. Toxicol 29, 1849–1856. [DOI] [PMC free article] [PubMed] [Google Scholar]
- 20.Nakamura J, Walker VE, Upton PB, Chiang S-Y, Kow YW, and Swenberg JA (1998) Highly sensitive apurinic/apyrimidinic site assay can detect spontaneous and chemically induced depurination under physiological conditions. Cancer Res. 58, 222–225. [PubMed] [Google Scholar]
- 21.Paiano V, Maertens L, Guidolin V, Yang J, Balbo S, and Hecht SS (2020) Quantitative liquid chromatography-nanoelectrospray ionization-high-resolution tandem mass spectrometry analysis of acrolein-DNA adducts and etheno-DNA adducts in oral cells from cigarette smokers and nonsmokers. Chem. Res. Toxicol 33, 2197–2207. [DOI] [PMC free article] [PubMed] [Google Scholar]
- 22.Chen H-JC, and Lee C-R (2014) Detection and simultaneous quantification of three smoking-related ethylthymidine adducts in human salivary DNA by liquid chromatography tandem mass spectrometry. Toxicology Lett. 224, 101–107. [DOI] [PubMed] [Google Scholar]
- 23.Nath RG, Ocando JE, Guttenplan JB, and Chung FL (1998) 1,N2-propanodeoxyguanosine adducts: potential new biomarkers of smoking-induced DNA damage in human oral tissue. Cancer Res. 58, 581–584. [PubMed] [Google Scholar]
- 24.Balbo S, Meng L, Bliss RL, Jensen JA, Hatsukami DK, and Hecht SS (2012) Kinetics of DNA adduct formation in the oral cavity after drinking alcohol. Cancer Epidemiol. Biomarkers Prev 21, 601–608. [DOI] [PMC free article] [PubMed] [Google Scholar]
- 25.Zhang Y, Chen S-Y, Hsu T, and Santella RM (2002) Immunohistochemical detection of malondialdehyde–DNA adducts in human oral mucosa cells. Carcinogenesis 23, 207–211. [DOI] [PubMed] [Google Scholar]
- 26.Chen H-JC, and Lin C-R (2014) Noninvasive measurement of smoking-associated N3-ethyladenine and N7-ethylguanine in human salivary DNA by stable isotope dilution nanoflow liquid chromatography–nanospray ionization tandem mass spectrometry. Toxicology Lett. 225, 27–33. [DOI] [PubMed] [Google Scholar]
- 27.Bessette EE, Spivack SD, Goodenough AK, Wang T, Pinto S, Kadlubar FF, and Turesky RJ (2010) Identification of carcinogen DNA adducts in human saliva by linear quadrupole ion trap/multistage tandem mass spectrometry. Chem. Res. Toxicol 23, 1234–1244. [DOI] [PMC free article] [PubMed] [Google Scholar]
- 28.Proia NK, Paszkiewicz GM, Sullivan Nasca MA, Franke GE, and Pauly JL (2006) Smoking and smokeless tobacco-associated human buccal cell mutations and their association with oral cancer—a review. Cancer Epidemiol. Biomarkers Prev 15, 1061–1077. [DOI] [PubMed] [Google Scholar]
- 29.Pezzuto A, Citarella F, Croghan I, and Tonini G (2019) The effects of cigarette smoking extracts on cell cycle and tumor spread: novel evidence. Future Sci OA 5, FSO394. [DOI] [PMC free article] [PubMed] [Google Scholar]
- 30.Atamna H, Cheung I, and Ames BN (2000) A method for detecting abasic sites in living cells: age-dependent changes in base excision repair. Proc. Natl. Acad. Sci. USA 97, 686–691. [DOI] [PMC free article] [PubMed] [Google Scholar]
- 31.Deo PN, and Deshmukh R (2019) Oral microbiome: Unveiling the fundamentals. Journal of oral and maxillofacial pathology : JOMFP 23, 122–128. [DOI] [PMC free article] [PubMed] [Google Scholar]
- 32.Kilian M, Chapple ILC, Hannig M, Marsh PD, Meuric V, Pedersen AML, Tonetti MS, Wade WG, and Zaura E (2016) The oral microbiome – an update for oral healthcare professionals. British Dental Journal 221, 657–666. [DOI] [PubMed] [Google Scholar]
- 33.Huang W, Xiong J, Yang Y, Liu S-M, Yuan B-F, and Feng Y-Q (2015) Determination of DNA adenine methylation in genomes of mammals and plants by liquid chromatography/mass spectrometry. RSC Advances 5, 64046–64054. [Google Scholar]
- 34.Žgur-Bertok D (2013) DNA damage repair and bacterial pathogens. PLoS pathogens 9, e1003711–e1003711. [DOI] [PMC free article] [PubMed] [Google Scholar]
- 35.Sahan AZ, Hazra TK, and Das S (2018) The pivotal role of DNA repair in infection mediated-inflammation and cancer. Front Microbiol 9, 663. [DOI] [PMC free article] [PubMed] [Google Scholar]
- 36.Kusters JG, van Vliet AH, and Kuipers EJ (2006) Pathogenesis of Helicobacter pylori infection. Clinical microbiology reviews 19, 449–490. [DOI] [PMC free article] [PubMed] [Google Scholar]
- 37.McCoy AN, Araújo-Pérez F, Azcárate-Peril A, Yeh JJ, Sandler RS, and Keku TO (2013) Fusobacterium is associated with colorectal adenomas. PLoS One 8, e53653. [DOI] [PMC free article] [PubMed] [Google Scholar]
- 38.Puck TT, Robertson OH, and Lemon HM (1943) The bactericidal action of propylene glycol vapor on microorganisms suspended in air : II. The influence of various factors on the activity of the vapor. J. Exp. Med 78, 387–406. [DOI] [PMC free article] [PubMed] [Google Scholar]
- 39.Robertson OH, Bigg E, Puck TT, Miller BF, and Technical Assistance of Elizabeth, A. A. (1942) The bactericidal action of propylene glycol vapor on microorganisms suspended in air. I. J. Exp. Med 75, 593–610. [DOI] [PMC free article] [PubMed] [Google Scholar]
- 40.Nalawade TM, Bhat K, and Sogi SHP (2015) Bactericidal activity of propylene glycol, glycerine, polyethylene glycol 400, and polyethylene glycol 1000 against selected microorganisms. J. Int. Soc. Prev. Community Dent 5, 114–119. [DOI] [PMC free article] [PubMed] [Google Scholar]
- 41.Lee H-W, Park S-H, Weng M. w., Wang H-T, Huang WC, Lepor H, Wu X-R, Chen L-C, and Tang M. s. (2018) E-cigarette smoke damages DNA and reduces repair activity in mouse lung, heart, and bladder as well as in human lung and bladder cells. Proc. Natl. Acad. Sci. USA 115, E1560–E1569. [DOI] [PMC free article] [PubMed] [Google Scholar]
Associated Data
This section collects any data citations, data availability statements, or supplementary materials included in this article.