

ABSTRACT
Background
Visualizations of the emerging obesity epidemic, such as with serial US color prevalence maps, provide graphic images that extend informative public health messages beyond those in written communications. Advances in low-cost 3D optical technology now allow for development of large image databases that include participants varying in race/ethnicity, body mass, height, age, and circumferences. When combined with contemporary statistical methods, these data sets can be used to create humanoid avatar images with prespecified anthropometric features.
Objectives
The current study aimed to develop a humanoid avatar series with characteristics of representative US adults extending over the past 6 decades.
Methods
3D optical scans were conducted on a demographically diverse sample of 570 healthy adults. Image data were converted to principal components and manifold regression equations were then developed with body mass, height, age, and waist circumference as covariates. Humanoid avatars were generated for representative adults with these 4 characteristics as reported in CDC surveys beginning in 1960–1962 up to 2015–2018.
Results
There was a curvilinear increase in adult US population body mass, waist circumference, and BMI in males and females across the 9 surveys spanning 6 decades. A small increase in average adult population age was present between 1960 and 2018; height changes were inconsistent. A series of 4 avatars developed at ∼20-y intervals for representative males and females reveal the changes in body size and shape consistent with the emergence of the obesity epidemic. An additional series of developed avatars portray the shapes and sizes of males and females at key BMI cutoffs.
Conclusions
New mathematical approaches and accessible 3D optical technology combined with increasingly available large and diverse data sets across the life span now make unique visualization of body size and shape possible on a previously unattainable scale. This study is registered at https://clinicaltrials.gov/ct2/show/NCT03637855 as NCT03637855.
Keywords: adiposity, manifold regression, body mass index, waist circumference, three-dimensional
Introduction
The global obesity epidemic began several decades ago (1) and continues unabated today (2). One of the most striking visual presentations of the rise in obesity prevalence are the color-coded US maps published by the CDC (3). Extending back several decades, the maps sequentially show the remarkable rise in obesity prevalence across the full United States by state and territory. These graphic images of obesity sweeping across the United States over several decades extend informative public health messages beyond those in written communications. Ivan S Turgenev summed up the power of these kinds of images in his novel Fathers and Sons, 1862 (4): “The drawing shows me at one glance what might be spread over ten pages in a book.”
Recent developments in three-dimensional (3D) optical imaging technologies provide yet another opportunity to visually convey the obesity epidemic's impact on people living in the United States (5, 6). The possibility exists to generate 3D avatars of representative adult US males and females as they would appear from 1960 up to 2018. Specifically, manifold regression equations can be developed that can generate a person's 3D image from their sex, body mass, height, age, body circumferences, and other anthropometric and body-composition characteristics (7–9). The aim of the current study was to use manifold regression models developed by our group to create a visual serial presentation of average adult US males and females as their body size and shape changed over the past 6 decades. These impactful human avatar images convey a sense of urgency in bringing the epidemic of excess adiposity under control that complements the alarm raised by the serial CDC obesity prevalence maps.
Methods
Study design
A demographically diverse sample was recruited as part of the Shape Up! Adults study (NIH R01 DK109008, ClinicalTrials.gov ID NCT03637855). The sample was designed to have the same approximate sex, age, body mass, height, and BMI distribution of US adults described in the most recent NHANES (2). The sample thus included adults varying in multiple characteristics from which we could generate robust manifold regression models. Some race/ethnic groups in our sample are overrepresented due to the population characteristics of our respective laboratory locations. Race and ethnicity were self-reported by the participants.
Demographic and health information was collected on participants by trained clinical staff. Each participant then had body mass and height measured in the body-composition laboratories at Pennington Biomedical Research Center in Baton Rouge and at the Cancer Center, University of Hawaii, in Honolulu. Participants completed a 3D optical scan that generated multiple anthropometric body dimensions (8, 10). These surface dimensions, when linked with a person's sex, body mass, height, age, and waist circumference, can be used to develop manifold regression equations that predict their corresponding 3D avatar (11). Data from national surveys beginning in 1960 up to 2018 were then used to acquire the average population body mass, height, age, and waist circumference of adult US males and females (12). The developed manifold regression equations were next used to generate 3D avatars of the average male and female as reported by each of the national surveys. The Shape Up! Adults study was approved by the centers’ institutional review boards and all participants signed the informed consents prior to evaluation. The study is registered at https://clinicaltrials.gov/ct2/show/NCT03637855.
Participants
The Shape Up! Adults study participants were stratified by age group (≥18–40, 40–60, and >60 y), race/ethnicity (non-Hispanic White, non-Hispanic Black, Hispanic, Asian, and Native Hawaiian or other Pacific Islander), sex, and BMI (in kg/m2; <18.5, 18.5–24.9, 25–29.9, ≥30). Participants self-reported their race and ethnicity. Participants were excluded if they could not stand without aid for 2 min, lie flat for 10 min without movement, had metal objects implanted in their body, had a body-altering procedure (e.g., breast augmentation), or their height was >1.96 m. Female participants were also excluded if they were pregnant or breastfeeding. The sample selection criteria, race/ethnic distribution, and age/body size/body shape characteristics are presented in Supplemental Figures 1 and 2 and Supplemental Table 1.
Measurements
Body mass and height were measured with a digital scale and stadiometer, respectively, as previously reported (7–9). Automated 3D anthropometric data was collected using a Fit3D Proscanner version 4.x (Fit3D) as reported by Ng et al. (7, 10). The procedure required participants to stand erect in the A-pose on the scanner's platform. When activated, the platform rotates 1 revolution as a tower-mounted camera, placed about 2 feet from the platform, collects image data from 3 infrared depth sensors. The Proscanner's camera projects a structured infrared light pattern onto the participant during the platform's 40-s revolution. Distortions in the pattern are captured by the cameras and used to calculate depth. The final output was a 3D mesh that represents the person's body shape.
Model development
After 3D optical data acquisition, each scan was standardized with a 60,000-vertex template using the methods of Allen et al. (11). This standardization allows direct anatomical body shape comparisons across the sample. First, 75 fiducial points from the Civilian American and European Surface Anthropometry Resource Project (CAESAR) (13) were manually placed on the meshes by trained and validated personnel using Meshlab 1.3.2 (Consiglio Nazionale delle Ricerche, Rome, Italy). Using software developed by Allen et al. (11), the template's markers were transformed to each target mesh's markers. The vertices of the template warps to fit the shape of each individual's mesh (6). Next, principal component (PC) analysis was performed to build sex-specific shape models. This allowed 99% of the variance to be described by approximately 15 PCs (7).
Manifold regression analysis was performed following creation of the shape models. The manifold equation is M = P × F+, where M is the manifold, P is the matrix of all PCs for all participants, F is the matrix of all feature parameters (e.g., age, body mass, height, waist circumference, and a constant) for all participants, and “+” symbolizes the pseudoinverse. Once M is solved, another matrix was created, W, which contained the target features from a person's feature parameters (e.g., body mass, 70 kg; height, 170 cm; age, 40 y; waist circumference, 90 cm; constant 1). A new PC matrix was created once W was multiplied to M. The new PC matrix was transformed back into Cartesian space from PC space to generate the manifold images.
Avatar generation
The manifold regression equations were used to predict the 3D avatars of representative adult US males and females whose mean body mass, height, age, and waist circumference were the mean population values for a specified time period as reported by the CDC (2, 12, 14–16). The NHANES program of the CDC published multiple cross-sectional surveys beginning in 1960 that included a nationally representative sample of the US civilian noninstitutionalized population (2, 12, 14–16). Weighted population sex-specific mean values were used in the current report from the following 9 representative surveys spaced over 6 decades: 1960–1962 (NHANES I), 1971–1974 (NHANES I), 1976–1980 (NHANES II), 1988–1994 (NHANES III), 1999–2002 (NHANES), 2003–2006 (NHANES), 2007–2010 (NHANES), 2011–2014 (NHANES), and 2015–2018 (NHANES). The 5 surveys up to 2002 included data on adults aged ≥20–74 y, whereas the 4 surveys that followed reported on adults aged ≥20 y. Two of the surveys up to 1980 did not report waist circumference measurements, whereas the other 7 surveys reported waist circumference values for adult males and females. We regressed waist circumference data from these 7 surveys against body mass and found they described highly significant linear correlations in both the males (R2, 0.96; P < 0.001) and females (R2, 0.93; P < 0.001). Waist-circumference prediction models with body mass as a covariate were used, accordingly, to estimate values for the 2 unavailable time points. Using the aforementioned methods, manifold images were generated for each of the available data sets. The manifold regression analysis was performed in R version 4.0.2 (https://stat.ethz.ch/pipermail/r-announce/2020/000658.html; R Core Team, 2020). An additional series of images was generated at key BMI cutoffs—18.5, 25, 30, and 40—for representative males and females in the most recent NHANES, 2015–2018 (2). Adult population age and height were used to generate these images along with body mass, which was derived at each of the respective BMI levels.
Results
From 1960 up to the present represents almost a 60-y time span for which anthropometric data on US population samples are available. Data from the past several years are incomplete due largely to the coronavirus disease 2019 (COVID-19) pandemic, during which collection efforts have been curtailed. The pattern of changes in body size and shape measures such as body mass, waist circumference, and BMI was similar over the 6 decades, with a steady curvilinear increase as shown in Figure 1. Corresponding changes in height were minimal or inconsistent. Mean population age increased by approximately 4 y over the 6 decades.
FIGURE 1.
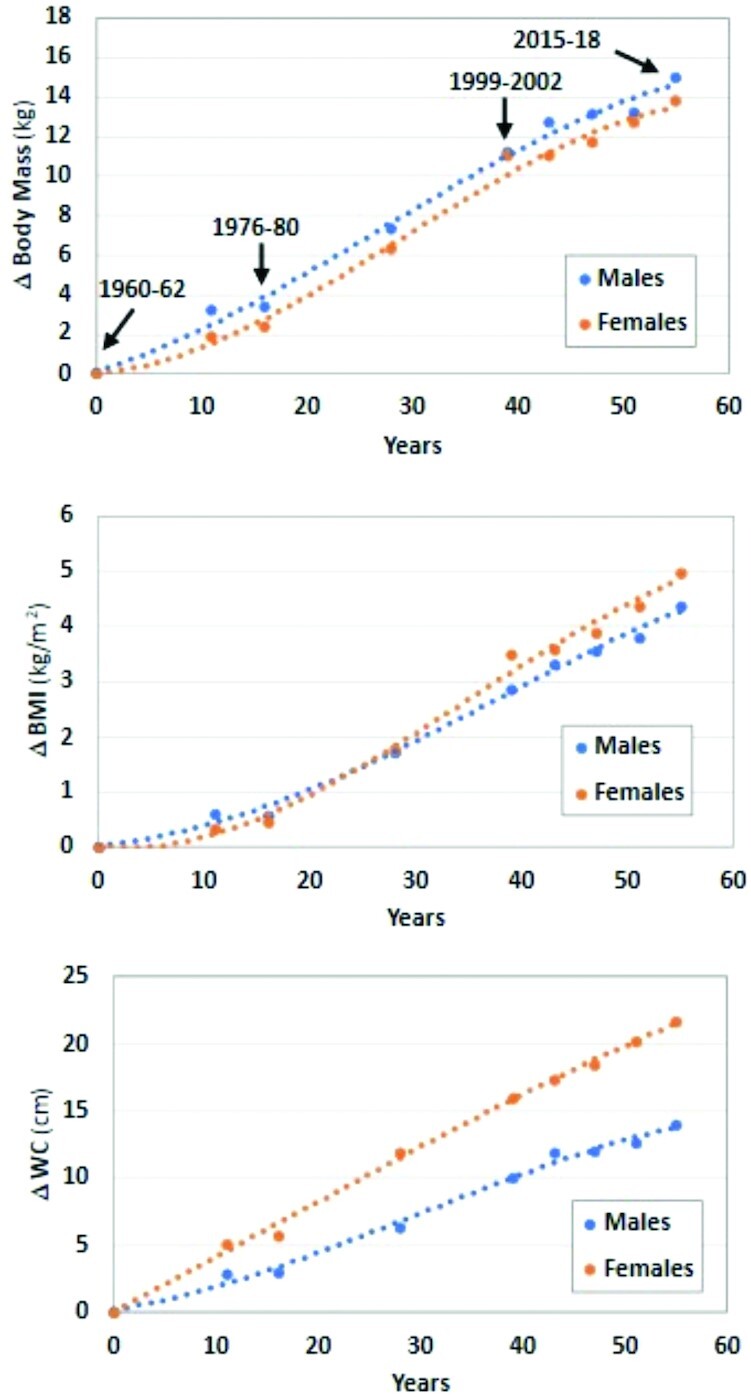
Body mass, BMI, and WC reported in the 9 CDC population surveys beginning in 1960–1962. The zero time was set at 1960–1962, and values thereafter represent the respective differences (Δ) from time zero. Data are fit with polynomial regression lines. The arrows and associated dates correspond to the image dates presented in Figures 3and 4. WC, waist circumference.
To capture these secular trends in key variables, we present the corresponding avatar images of males and females at 4 representative time points, approximately zero (1960–1962), 20 (1976–1980), 40 (1999–2002), and 60 (2015–2018) y (Figures 2 and 3). The full set of 9 avatar images for available time points are presented in Supplemental Figures 3 and 4 for males and females, respectively. The images and corresponding anthropometric measurements reveal the marked changes in body size and shape over the 60-y time span, with a notable acceleration in the past 40 y. Plots of representative males and females from the 2015–2018 NHANES at each of the 4 key BMI cutoffs for underweight (<18.5), normal weight (18.5–24.9), overweight (25.0–29.9), and obesity (≥30) and severe obesity range (≥40) are shown in Figures 4 and 5. These images provide a visual guide for estimating a person's approximate position on the charts when classified as being overweight or obese according to BMI.
FIGURE 2.

Representative humanoid avatars of the average US man at 4 time points between 1960–1962 and 2015–2018 as defined by mean adult population body mass, height, age, and WC. Respective average population BMIs (in kg/m2) are as follows: 25.1, 25.7, 28.0, and 29.5. WC, waist circumference.
FIGURE 3.

Representative humanoid avatars of the average US woman at 4 time points between 1960–1962 and 2015–2018 as defined by mean adult population body mass, height, age, and WC. Respective average population BMIs (in kg/m2) are as follows: 24.8, 25.2, 28.3, and 29.8. WC, waist circumference.
FIGURE 4.

Humanoid avatars for males ranging in BMI (in kg/m2) from 18.5 to 40. Height and age were set at the 2015–2018 CDC population averages for adult males; BMIs were then varied to derive the body mass values used to generate the 4 avatars shown in the figure.
FIGURE 5.

Humanoid avatars for females ranging in BMI (in kg/m2) from 18.5 to 40. Height and age were set at the 2015–2018 CDC population averages for adult females; BMIs were then varied to derive the body mass values used to generate the 4 avatars shown in the figure.
Discussion
More than two-thirds of US adults had overweight or obesity in the 2015–2018 NHANES, with the mean population BMI approaching the obesity threshold of 30 (2, 12). Excess adiposity has thus almost become the norm; many Americans may fail to appreciate the size and shape appearance of representative adult males and females prior to the obesity epidemic 6 decades ago (1). The striking secular changes in body size and shape can get lost when viewing serial obesity maps or numerical descriptors such as BMI. The rapid development of 3D optical technology and associated mathematical approaches led us to supplement these other descriptors of the obesity epidemic with humanoid avatars presented as 4 illustrations, 2 in males and 2 in females. These visual portrayals are intended to be proof-of-concept and to show how this emerging technology can supplement our other means of communicating concerns related to excess adiposity.
The capability of displaying 3D humanoid avatars has been around for more than 2 decades (17), but the major advance is the rapid introduction of accurate, relatively low-cost whole-body scanners that can acquire image data on large and diverse samples (18). More accurate renditions of body size and shape, along with accurate anthropometric measurements, are increasingly possible as more data are collected on persons who vary in age, activity level, race/ethnic classification, and health status. Moreover, our time-consuming approach using hand-placed fiducial points on scans is giving way to automated artificial intelligence and machine-learning methods for quantifying between-individual differences in size, shape, and body composition (9). Our generated avatars reflect the shape characteristics of our studies in multiethnic populations. Age, activity level, race, and ethnicity can all be added as model covariates in future studies aimed at exploring more distinct phenotypes than examined in the current study.
Our manifold regression models were developed on a contemporary multiethnic sample of US adults ranging widely in age and physical characteristics. By necessity, we assumed our models also accurately portray the physical appearance of people 6 decades ago. Any deviations from this assumption are likely to be small and could arise from secular changes in activity levels and the race/ethnic distribution of the US population.
In sum, the current study aimed to develop a series of humanoid avatars portraying aspects of the obesity epidemic using manifold regression equations developed from a relatively large sample of healthy adults. These images provide proof-of-concept that secular changes in body size and shape can visually be characterized when combined with the anthropometric dimensions of representative Americans reported by the CDC. The possibility exists to improve image-generating models as larger and more diverse samples become available.
Supplementary Material
Acknowledgments
The authors extend their thanks to Avi Das for his help in preparing the avatar figures.
The authors’ responsibilities were as follows—MCW, CM, NF, and SBH: designed the research; MCW, CM, SY, JS, and SBH: conducted the research; JS and SBH: provided essential materials; MCW, CM, NF, SY, JS, and SBH: analyzed data, wrote the manuscript, and had primary responsibility for final content; and all authors: read and approved the final manuscript. SBH is on the Medical Advisory Board of Tanita Corporation. The other authors report no conflicts of interest.
Notes
This work was partially supported by NIH National Obesity Research Center (NORC) grants P30DK072476 (Pennington/Louisiana), P30DK040561 (Harvard), and R01DK109008 (Shape Up! Adults).
Supplemental Figures 1–4 and Supplemental Table 1 are available from the “Supplementary data” link in the online posting of the article and from the same link in the online table of contents at https://academic.oup.com/ajcn/.
Contributor Information
Michael C Wong, University of Hawaii Cancer Center, Honolulu, HI, USA; Graduate Program in Nutritional Sciences, University of Hawaii at Manoa, Honolulu, HI, USA.
Cassidy McCarthy, Pennington Biomedical Research Center, Louisiana State University System, Baton Rouge, LA, USA.
Nicole Fearnbach, Pennington Biomedical Research Center, Louisiana State University System, Baton Rouge, LA, USA.
Shengping Yang, Pennington Biomedical Research Center, Louisiana State University System, Baton Rouge, LA, USA.
John Shepherd, University of Hawaii Cancer Center, Honolulu, HI, USA.
Steven B Heymsfield, Pennington Biomedical Research Center, Louisiana State University System, Baton Rouge, LA, USA.
Data Availability
Data described in the manuscript, code book, and analytic code will be made available upon request pending application and approval by the investigators.
References
- 1. Heymsfield SB, Wadden TA. Mechanisms, pathophysiology, and management of obesity. N Engl J Med. 2017;376(3):254–66. [DOI] [PubMed] [Google Scholar]
- 2. Fryar CD, Carroll MD, Gu Q, Afful J, Ogden CL. Anthropometric reference data for children and adults: United States, 2015-2018. Vital Health Stat. 2021;3(36):1–44. [PubMed] [Google Scholar]
- 3. Centers for Disease Control and Prevention , National Center for Chronic Disease Prevention and Health Promotion. [Internet]. December 4, 2018. Available from: https://www.cdc.gov/obesity/data/databases.html (accessed 12 October 2021). [Google Scholar]
- 4. Bouchard C, Blair SN, Katzmarzyk PT. Less sitting, more physical activity, or higher fitness?. Mayo Clin Proc. 2015;90(11):1533–40. [DOI] [PubMed] [Google Scholar]
- 5. Allen B, Curless B, Popovic Z. Exploring the space of human body shapes: data driven synthesis under anthropometric control. Proceedings of the SAE Digital Human Modeling for Design and Engineering Conference. Rochester (MI): SAE International; 2004. p. 245–8. [Google Scholar]
- 6. Tian IY, Ng BK, Wong MC, Kennedy S, Hwaung P, Kelly N, Liu E, Garber AK, Curless B, Heymsfield SBet al. Predicting 3D body shape and body composition from conventional 2D photography. Med Phys. 2020;47(12):6232–45. [DOI] [PMC free article] [PubMed] [Google Scholar]
- 7. Ng BK, Sommer MJ, Wong MC, Pagano I, Nie Y, Fan B, Kennedy S, Bourgeois B, Kelly N, Liu YEet al. Detailed 3-dimensional body shape features predict body composition, blood metabolites, and functional strength: the Shape Up! studies. Am J Clin Nutr. 2019;110(6):1316–26. [DOI] [PMC free article] [PubMed] [Google Scholar]
- 8. Wong MC, Ng BK, Kennedy SF, Hwaung P, Liu EY, Kelly NN, Pagano IS, Garber AK, Chow DC, Heymsfield SBet al. Children and adolescents' anthropometrics body composition from 3-D optical surface scans. Obesity. 2019;27(11):1738–49. [DOI] [PMC free article] [PubMed] [Google Scholar]
- 9. Wong MC, Ng BK, Tian I, Sobhiyeh S, Pagano I, Dechenaud M, Kennedy SF, Liu YE, Kelly NN, Chow Det al. A pose-independent method for accurate and precise body composition from 3D optical scans. Obesity. 2021;29(11):1835–47. [DOI] [PMC free article] [PubMed] [Google Scholar]
- 10. Ng BK, Hinton BJ, Fan B, Kanaya AM, Shepherd JA. Clinical anthropometrics and body composition from 3D whole-body surface scans. Eur J Clin Nutr. 2016;70(11):1265–70. [DOI] [PMC free article] [PubMed] [Google Scholar]
- 11. Allen B, Curless B, Popovic Z. The space of human body shapes: reconstruction and parameterization from range scans. ACM Transact Graphics. 2003;22(3):587–94. [Google Scholar]
- 12. Fryar CD, Carroll MD, Afful J. Prevalence of overweight, obesity, and severe obesity among adults aged 20 and over: United States, 1960–1962 through 2017–2018. NCHS Health E-Stats [Internet]. 2020. Available from: https://www.cdc.gov/nchs/data/hestat/obesity-adult-17-18/overweight-obesity-adults-H.pdf(accessed 10 November 2021). [Google Scholar]
- 13. Robinette KM, Blackwell S, Daanen H, Boehmer M, Fleming S. Civilian American and European Surface Anthropometry Resource (CAESAR) Final Report, Volume 1: Summary [Internet]. 2002. Available from: https://www.humanics-es.com/CAESARvol1.pdf (accessed 12 October 2021). [Google Scholar]
- 14. McDowell MA, Fryar CD, Hirsch R, Ogden CL. Anthropometric reference data for children and adults: U.S. population, 1999–2002. Advance Data from Vital and Health Stat, no. 361 [Internet]. 2005. Available from: https://www.cdc.gov/nchs/data/ad/ad361.pdf (accessed 12 October 2021). [PubMed] [Google Scholar]
- 15. Ogden CL, Fryar CD, Carroll MD, Flegal KM. Mean body weight, height, and body mass index, United States 1960–-2002. Advance Data from Vital and Health Statistics, no. 347 [Internet]. 2004. Available from: https://www.cdc.gov/nchs/data/ad/ad347.pdf (accessed 12 October 2021). [PubMed] [Google Scholar]
- 16. Stoudt HW. Skinfolds, body girths, biacromial diameter, and selected anthropometric indices of adults. United States, 1960-1962. Vital Health Stat. 1970;11(35):1–63. [PubMed] [Google Scholar]
- 17. Istook CL, Hwang S. 3D body scanning systems with application to the apparel industry. J Fashion Market Manage. 2001;5(2):120–32. [Google Scholar]
- 18. Kennedy S, Hwaung P, Kelly N, Liu YE, Sobhiyeh S, Heo M, Shepherd JA, Heymsfield SB. Optical imaging technology for body size and shape analysis: evaluation of a system designed for personal use. Eur J Clin Nutr. 2020;74(6):920–9. [DOI] [PMC free article] [PubMed] [Google Scholar]
Associated Data
This section collects any data citations, data availability statements, or supplementary materials included in this article.
Supplementary Materials
Data Availability Statement
Data described in the manuscript, code book, and analytic code will be made available upon request pending application and approval by the investigators.