

Abstract
Objective:
To describe the adaptive measurement of change (AMC) as a means to identify psychometrically significant change in reported function of hospitalized patients and to reduce respondent burden on follow-up assessments.
Design:
The AMC method uses multivariate computerized adaptive testing (CAT) and psychometric hypothesis tests based in item response theory to more efficiently measure intra-individual change using the responses of a single patient over two or more testing occasions. Illustrations of the utility of AMC in clinical care and estimates of AMC-based item reduction are provided using the FAMCAT, a newly developed functional multidimensional CAT-based (MCAT) measurement of basic mobility, daily activities, and applied cognition.
Setting:
Two quaternary hospitals in the Upper Midwest.
Participants:
495 hospitalized patients who completed the FAMCAT on two to four occasions during their hospital stay.
Intervention:
N/A.
Results:
Of the 495 patients who completed more than one FAMCAT, 72% completed two, 13% three, and 15% four sessions, with 22.1%, 23.4%, and 23.0%, respectively, exhibiting significant multivariate change. Use of the AMC in conjunction with the FAMCAT reduced respondent burden from that of the FAMCAT alone for follow-up assessments. On average, when used without the AMC, 22.7 items (range 20.4 to 24.4) were administered during FAMCAT sessions. Post-hoc analyses determined that when the AMC was used with the FAMCAT a mean (SD) reduction in FAMCAT number of items of 13.6(11.1), 13.1(9.8), and 18.1(10.8) would occur during the second, third, and fourth sessions, respectively, which corresponded to a reduction in test duration of 3.0(2.4), 3.0(2.8), and 4.7(2.6) minutes. Analysis showed that the AMC requires no assumptions about the nature of change and provides data that are potentially actionable for patient care. Various patterns of significant univariate and multivariate change are illustrated.
Conclusions:
The AMC method is an effective and parsimonious approach to identifying significant change in patients’ measured CAT scores. The AMC approach reduced FAMCAT sessions by an average of 12.6 items (55%) and 2.9 (53%) minutes among patients with psychometrically significant score changes.
Keywords: item response theory, respondent burden, FAMCAT, patient-reported outcomes, measurement of individual change, multidimensional computerized adaptive testing
Introduction
Patient-reported outcome measures (PROMs) have been identified as a means to better align clinical care with patients’ needs and preferences, and to improve their outcomes. 1–3 However, PROM assessments depend on patients’ willingness to complete these questionnaires.4 Ambivalence towards PROMs’ often heavy response burden has been robustly documented, and closely associated with low completion rates.5,6 Intolerance of high response burden is a uniquely problematic barrier for longitudinal PROM-based screening initiatives, as well as monitoring of distal treatment effects—the latter being considered essential to patient-centered valuation of care.7,8
A longstanding desire to minimize burden without sacrificing PROM precision became more feasible with the availability of electronic PROMs (ePROMs). Electronic assessments permit cascading logic for legacy PROM administration and computerized adaptive testing (CAT) for item response theory (IRT)-modeled PROMs. Both are means of individualizing assessments with the potential to enhance efficiency. However, when multiple PROM domains are simultaneously assessed, even these methods may not reduce respondent burden to an acceptable level.
Longitudinal IRT-modeled CAT assessments have taken limited advantage of the fact that following an initial assessment, a patient’s previous scores and their error estimates can be available. A CAT algorithm with access to these data may further individualize, and streamline, testing beyond the capability of CAT alone. Moreover, a CAT algorithm may be parameterized to answer one of clinical medicine’s most fundamental and durable questions: has a patient worsened or improved?
Identifying change among PROM domains in a manner that provides clinicians with actionable information presents several challenges, as change can occur in many ways. When multiple PROMs are administered, some patients might improve on a single variable while others might deteriorate or stay the same. Alternatively, some patients may change on a single variable, while others change on several. When assessments take place at multiple time points, as occurs with longitudinal monitoring, the patterns of change become more and more variable.
A further complication in the measurement of patient-reported outcomes is that all observed change is not necessarily meaningful. Past efforts to address this issue have concentrated on estimating the minimally clinically important difference, and related constructs, using anchor- and distribution-based methods.9,10 However, estimates are derived using group-level data and may not transfer across populations. Moreover, the same amount of change in two different patients might be meaningful for one and not the other.11 Minimally clinically important difference estimates may vary across a trait range, and for negative versus positive change.12,13 Consequently, methods for identifying significant change – change that occurs outside the range of solely random factors – that does not vary based on contextual factors is critical in providing clinicians with actionable information.
The complexities of measuring change on an individual level have focused on statistical approaches that consider groups as a whole.14–16 These approaches have an inadequate ability to measure individual change.15–17 In contrast, IRT makes strong, but testable, assumptions that can be at the level of the individual. Consequently, it provides the groundwork for the implementation of novel means to measure individual change.
This paper describes one method, the adaptive measure of change (AMC), which was designed to enhance the efficiency of subsequent CAT sessions by leveraging information available from a preceding session. Gains in measurement efficiency and associated reductions in response burden achievable with the AMC approach were estimated using data collected from a novel ePROM developed to measure function among hospitalized patients: the Functional Assessment in Acute Care Multidimensional Computerized Adaptive Test (FAMCAT). These results are presented to challenge a longstanding absence of means to reduce ePROM response burden while maintaining, or even enhancing, measurement precision.
Methods
Participants
FAMCAT session data from 495 adults who were hospitalized on medical services or readmitted to surgical services, and who completed the FAMCAT on two or more occasions, were included in the analyses. This patient subgroup is part of the larger cohort of 2154 patients who contributed data to the FAMCAT validation study. Participants provided oral informed consent and signed a HIPAA form. The study was approved by the Institutional Review Board at Mayo Clinic, Rochester, Minnesota. Potential participants were identified using an electronic health record search algorithm. Participants were required to be at least 18 years of age and have at least one chronic condition (such as heart disease, cancer, and diabetes; additional information is available elsewhere) 18. Candidate participants’ charts were manually reviewed for eligibility. If their nurses confirmed that they had not received sedating medications or distressing news, or experienced intense symptoms, patients were invited to participate and enrolled, if receptive.
Instrument
The FAMCAT is a PROM that simultaneously estimates the Basic Mobility, Daily Activity, and Applied Cognition functional domains. Its development has been detailed elsewhere.18 The FAMCAT was derived from the Activity Measure for Post-Acute Care (AM-PAC) for use in acute care settings by enhancing item relevance for hospitalized patients, recalibrating the item banks based on responses of hospitalized patients, and parameterizing a CAT multidimensional assessment.18,19 The multidimensional computerized adaptive test (MCAT) algorithm selects for each patient, in real time, the optimal set of items for measuring that patient. Item banks for each of the three scales had over 100 items from which to select. Patients respond to each item on a 4-point Likert-type rating scale. Most items began with “How much DIFFICULTY do you currently have…”, followed by the description of a functional task, and are presented response options “unable”, “a lot”, “a little”, and “none”; a small percentage of items began with “How much HELP from another person do you currently need...” and used response options “total”, “ a lot”, “a little”, and “none”. Details of the development of the FAMCAT are presented elsewhere.19
Data collection
Patients completed the FAMCAT via either of two administration modes: (1) by an interviewer who read each question to the patients and recorded their answers on a tablet computer, or (2) by self-entering their responses on a tablet computer. Of the 495 participants, the first 217 patients completed their first FAMCAT by interview. The remaining 278 patients were enrolled in the parent project’s study of mode of administration20 and were randomly assigned in equal numbers to interview or tablet mode for their first FAMCAT. On successive FAMCAT administrations, all but five patients continued to respond by the same mode of administration. The FAMCAT lacks mode effects,20 and scores are comparable when data are entered via interviewer or tablet.
Identifying Significant Individual Change
In contrast to earlier efforts to measure individual change based on summed scores with arbitrary response weights, IRT incorporates specialized procedures for estimating a person’s score, taking into account the characteristics of each test question they answered and the response they selected. Because the resulting value is an estimate, it is only an imprecise representation of a person’s “true” score on the variable being measured. Thus, the estimation process also provides an error index associated with each person’s score. This index is referred to as the standard error of measurement (SEM) and can be used to place a psychometric confidence interval around each person’s score. The procedures investigated and developed in the present research use both the person’s score and the SEM associated with that score.
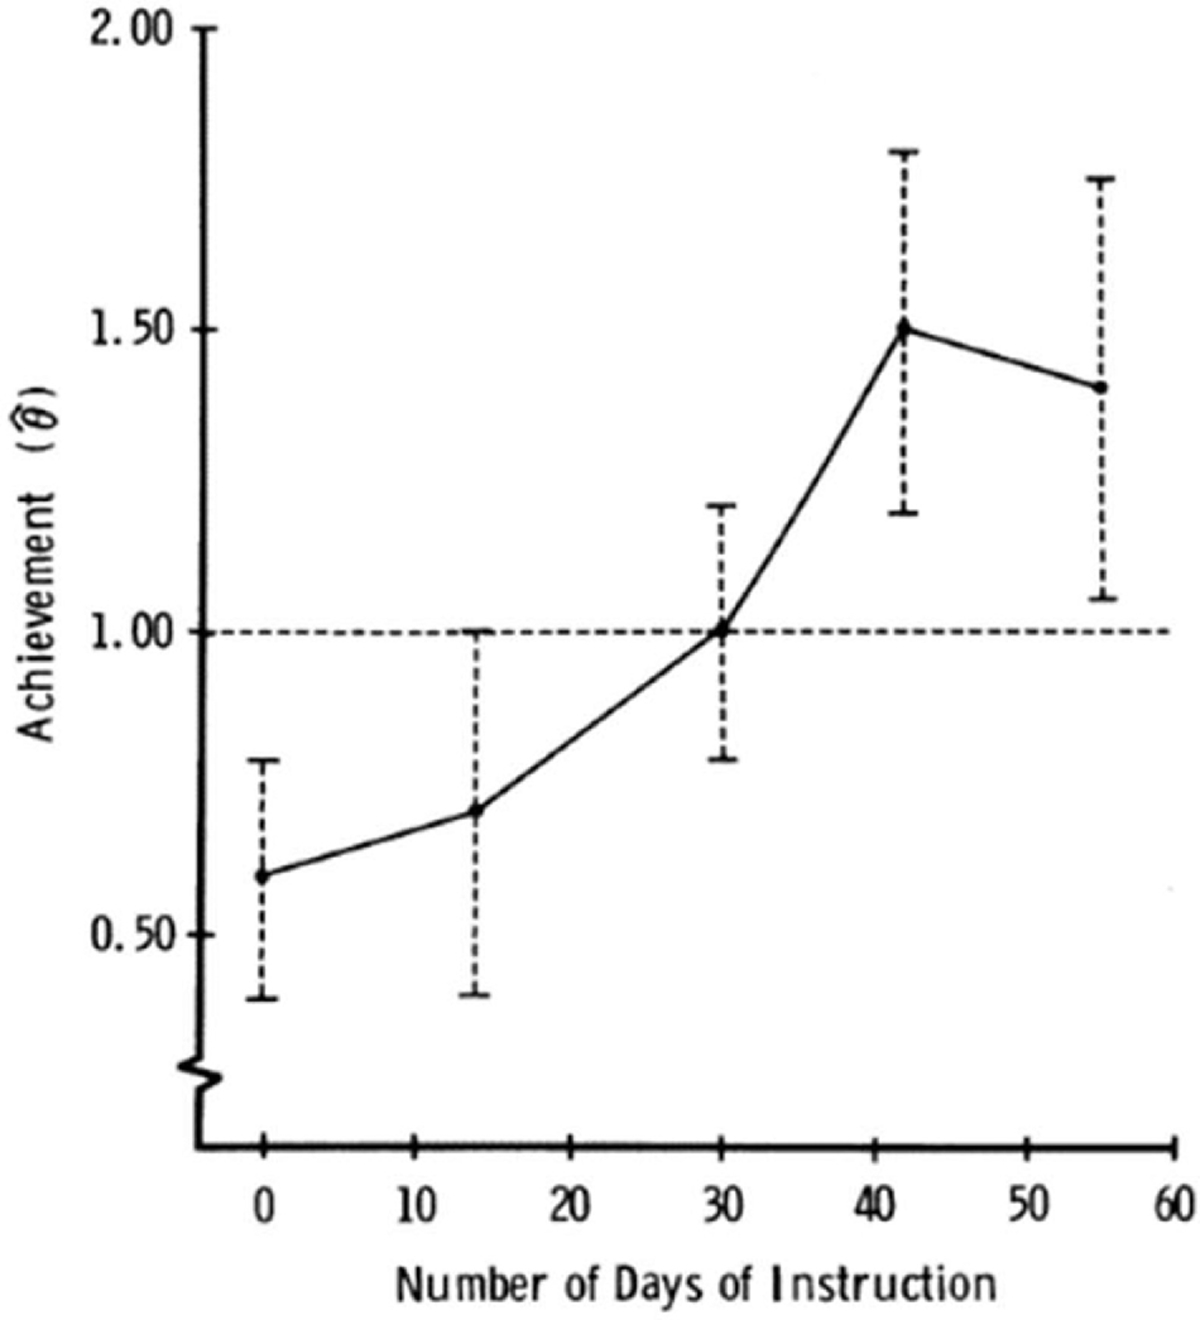
An initial approach to measuring individual change and determining its psychometric significance in an educational setting was proposed by Weiss and Kingsbury in 1984.21 Figure 1 shows the IRT estimated scores (designated as ) for a single student measured with a CAT on five occasions during the course of an academic quarter. According to those authors, psychometrically significant change was said to exist if the error bands (± 2 SEMs) around two s did not overlap. Applying this rule to the results in Figure 1 shows that there was no significant change between occasion 1 (0 days) and occasion 2 (15 days), while occasion 3 (30 days) was significantly different from occasion 1 (but not occasion 2), and occasions 4 (45 days) and 5 (60 days) differed significantly from occasions 1 and 2. Thus, the student had “learned” the material by day 30 and maintained that improvement through the end of the course.
Figure 1. s and 2 SEM Confidence Intervals for a Single Student Measured on Five Occasions.
Other approaches were found to provide superior identification of “true change” across two measurement occasions.22 These approaches, including a likelihood ratio-based method, a t-test ratio, and a score ratio method were compared, and it was concluded that the likelihood ratio test was the best at identifying true change. Further research confirmed this finding and extended the newer methodologies to multiple occasions.23,24 Most recently, Wang, Weiss, and colleagues25,26 generalized the methods to measuring and identifying psychometrically significant change for a single individual across multiple variables and multiple measurement occasions.
The AMC Process
The AMC procedure is designed to be both efficient and effective. The objective of testing at the first occasion is to obtain a baseline measurement of the patient’s status. This is accomplished by administering a CAT designed to terminate when a predetermined small value of the SEM associated with a is reached. At the second and successive testing occasions, the from the previous testing occasion is used as the starting value for a new CAT, on the assumption that this will be informative of the general range for the succeeding These CATs, after the first testing session, can then be terminated when one of the following conditions occurs: (1) significant change has been identified, when the index used to detect significant change is computed and tested for significance after each item is administered, (2) a predetermined small SEM has been reached in the absence of significant change, or (3) a maximum number of items has been administered.
In the present evaluation of the FAMCAT with hospitalized patients, CATs were terminated by conditions 2 or 3; then after the data were collected, the data were retrospectively analyzed to see if condition 1 was met. A likelihood ratio index was used to test for psychometric significance (see Wang et al.26, for computational details). The use of CAT with variable termination rules results in potentially different minimal test lengths for each patient, shorter testing times, and effective measurement with small and controlled SEMs. Note that “significance” in AMC is “psychometric” significance and is based on the intra-individual SEMs from psychometric theory as operationalized by IRT estimation methods. The mean reductions in FAMCAT session number of items and test duration that would be achieved by terminating per condition 1, rather than the actual conditions 2 or 3, were calculated among patients for whom significant change was detected. All data analysis was implemented using R routines written by one of the authors.
Results
Table 1 provides information on the demographic and clinical characteristics of the group of patients who completed the FAMCAT on one or more occasions. The group was 56.8% male and 43,2% female. Mean age for the total group was 61.2 (SD = 16) and median 53.2. Admitting diagnoses were well distributed across all admission diagnoses. Table 2 shows the number of patients who provided two or more completed FAMCATs, indicating whether the multivariate AMC test showed a significant change between sessions, the average number of required FAMCAT items, the average time needed for administration, and the average number of days between repeated tests. Among the total FAMCAT validation cohort of 2,050 patients who provided an initial assessment, 495 were able to take part in multiple assessments. Most of this group (N = 357) completed two sessions; 22.1% of these were determined to exhibit significant multivariate change. For the 64 patients who completed three sessions, 23.4% displayed a significant change, and for the 74 patients tested four times, 23.0% had significant change.
Table 1.
Demographic and clinical characteristics of patients who completed two or more FAMCATs
| Variable | Sample (N = 482) | |
|---|---|---|
|
| ||
| Age | ||
| Mean (SD) | 61.2 (16) | |
| Median (IQR) | 63 (53.2, 71) | |
| Gender | ||
| Female | 208 (43.2) | |
| Male | 274 (56.8) | |
| Charlson Comorbidity Index | ||
| Charison | ||
| Mean (SD) | 1.4 (1.4) | |
| Median (IQR) | 1 (0, 2) | |
| Charlson Severity | ||
| Mean (SD) | 2.4 (2.5) | |
| Median (IQR) | 2 (0, 3) | |
| Charlson Severity and Age | ||
| Mean (SD) | 4.2 (3.1) | |
| Median (IQR) | 4 (2, 6) | |
| Hospital Length of Stay (days) | ||
| Mean (SD) | 11.5 (11.6) | |
| Median (IQR) | 8 (5, 13) | |
| Discharge Location | N (%) | |
| Home with/without Home Care | 398 (82.6) | |
| Intensive Impatient Rehabilitation or Skilled Nursing Facility | 82 (17) | |
| Missing | 2 (0.4) | |
| Physical Therapy Consultation | N (%) | |
| 106 (22) | ||
| Occupational Therapy Consultation | N (%) | |
| 86 (17.8) | ||
| 30-Day Hospital Readmission | N (%) | |
| 32 (6.6) | ||
| Missing | 4(0.8) | |
| Admission Diagnosis – CCS (Chronic Condition Software) Category | N (%) | |
| Diseases of the Blood & Blood-Forming Organs & Immune System Disorders | 9 (1.9) | |
| Diseases of the Circulatory System | 44 (9.1) | |
| Diseases of the Digestive System | 75 (15.6) | |
| Endocrine, Nutritional & Metabolic Disease | 16 (3.3) | |
| Diseases of the Genitourinary System | 31 (6.4) | |
| Infectious and Parasitic Diseases | 52 (10.8) | |
| Injury, Poisoning, & Certain Other Consequences of External Causes | 39 (8.1) | |
| Mental, Behavioral & Neurodevelopment Disorders | 3 (0.6) | |
| Diseases of the Musculoskeletal System and Connective Tissue | 13 (2.7) | |
| Neoplasms | 134 (27.8) | |
| Diseases of the Nervous System | 9 (1.9) | |
| Diseases of the Respiratory System | 34 (7.1) | |
| Symptoms, Signs & Abnormal Clinical/Lab Findings | 8 (1.7) | |
| Other | 11 (2.3) | |
| Missing | 4(0.8) | |
Note. There were 13 participants for whom demographic data were missing. The full sample used in later analyses consisted of 495 participants.
Table 2.
Mean Number of Items Administered, Testing Time in Minutes, and Days Between Sequential Surveys for Patients Completing Multiple FAMCATs, By Multivariate Change Decision
| Number of. FAMCATs Completed | Change Decision | No. of Patients | No. of Items |
Administration. Time in minutes |
Days_Between FAMCATs |
|||
|---|---|---|---|---|---|---|---|---|
| Mean | SD | Mean | SD | Mean | SD | |||
|
| ||||||||
| 2 | Not signif. | 278 | 22.46 | 10.06 | 5.30 | 2.31 | 3.11 | 2.38 |
| Significant | 79 | 23.76 | 9.45 | 5.98 | 2.35 | 3.56 | 2.11 | |
| 3 | Not signif. | 49 | 20.86 | 6.94 | 5.24 | 2.46 | 3.38 | 1.59 |
| Significant | 15 | 24.04 | 8.07 | 5.64 | 1.97 | 4.60 | 2.11 | |
| 4 | Not signif. | 57 | 24.36 | 13.02 | 5.52 | 2.44 | 3.37 | 1.04 |
| Significant | 17 | 20.41 | 4.35 | 5.53 | 1.86 | 4.06 | 1.47 | |
| Total | -- | 495 | 22.71 | 9.91 | 5.44 | 2.33 | 3.32 | 2.13 |
Also as shown in Table 2, the average number of items administered across the multiple testing groups varied from 20.41 to 24.36, with an overall average of 22.71, or about an average of seven items for each of the three FAMCAT scales; there was no obvious tendency for significant testing sequences to be either shorter or longer than non-significant sequences. Average testing time ranged from 5.24 to 5.98 minutes, with an overall average of 5.44. The average number of days between testing (within a single hospitalization) varied from 3.11 to 4.60 days, with an overall average of 3.32.
Univariate change.
The AMC procedure allows for the detection of significant univariate change as well as multivariate change. The data in Table 3 shows the percent of patients for whom univariate change on each of the three FAMCAT scales was psychometrically significant. For patients who completed two FAMCATs, the percentage with significant change patterns varied from 7.3% for Applied Cognition to 15.1% for Daily Activity, and 20.7% for Mobility. This trend for increasing identification of significant change across the three scales was in evidence for patients tested at both three and four occasions. Overall, Applied Cognition had the fewest significant change patterns and Basic Mobility had the most.
Table 3.
Number of Patients with Multiple FAMCATs and Number and Percent Significant for Each Scale
| Number of |
Number Significant |
Percent Significant |
|||||
|---|---|---|---|---|---|---|---|
| Testing Occasions | Patients | Applied Cognition | Daily Activity | Mobility | Applied Cognition | Daily Activity | Mobility |
|
| |||||||
| 2 | 357 | 26 | 54 | 74 | 7.3 | 15.1 | 20.7 |
| 3 | 64 | 8 | 11 | 16 | 12.5 | 17.2 | 25.0 |
| 4 | 74 | 9 | 11 | 15 | 12.2 | 14.9 | 20.3 |
When there are only two scores for a given patient, there are obviously only three possible outcomes: significant positive change, significant negative change, and no significant change. Figure 2 shows results for five patients with significant change (Figure 2a) and five patients with non-significant change (Figure 2b). As figure 2a shows, four of the 5 patients reported significant decreases in their cognitive functioning during their hospitalization; the exception was patient 1139 who reported a significant increase. Figure 2b shows apparent increases in cognitive functioning for three of the five patients, with apparent decreases for the other two, but in all cases the differences in the θ estimates, taking into account their SEM bands, were insufficient to reach psychometric significance.
Figure 2. θ Estimates and 2 SEM Error Bands from the Applied Cognition Scale for Patients Over Two Measurement Sessions.

Figure 3 shows θ estimates and their 2SEM error bands from the Mobility scale, which was the scale that showed the highest rates of significant change. Similar to the results for Applied Cognition, three of the five patients reported significant negative change in reported mobility during their hospitalization, reflecting greater impairment, while the other two patients (1105 and 3222) reported significant positive change. Figure 3b shows change patterns that did not qualify for psychometric significance. Thus, as for Applied Cognition, the apparent differences between the two θ estimates for each patient could not be distinguished from random error, as reflected in the overlap of the SEM bands within patients. Notable is the θ difference of almost two standard deviations for patient 1132 which, if the SEM bands were not taken into account, would appear to be significant. But because both the occasion 1 and occasion 2 θ estimates were poorly measured, the difference was consistent with variation that might be expected from random error. Although the magnitudes of change in Figures 2 and 3 are similar, it is notable that the SEM bands in Figure 3 for measuring Mobility are considerably smaller than those in Figure 2 from Applied Cognition. It is this more precise measurement that accounts for the larger number of significant change patterns for Mobility (20.7%) versus Applied Cognition (7.3%).
Figure 3. θ Estimates and 2 SEM Error Bands from the Mobility Scale for Patients Over Two Measurement Sessions.

Multivariate change.
Because the FAMCAT uses a multivariate algorithm to estimate PROM scores, the results can also be examined as a multivariate set of data. In this case, the set of three θ estimates obtained from a patient at a given testing occasion can be considered as a “profile” of scores, and these profiles can be analyzed for significant (and non-significant) sets of repeated measurements. Figure 4 shows multivariate score profiles for patients who completed FAMCATs on three occasions. Figure 4a displays results for 10 patients whose score profiles were psychometrically most significantly different using the multivariate likelihood ratio index, while Figure 4b shows the results for 10 with the most non-significant profiles. In these figures, the three scales (Applied Cognition, Daily Activity, and Basic Mobility) are on the horizontal axis and the values on the vertical axis represent the θ estimates at each of the three measurement occasions; the figures are plotted without error bands for clarity.
Figure 4. Multivariate Score Profiles for Patients Who Completed FAMCATS on Three Occasions.

As Figure 4a shows, there were considerable differences across individuals in their profiles of multivariate change. Patient 1247 reported general improvement in all three scales from occasion 1, whereas patient 2824 reported increases in scale scores from occasion 1 to occasion 3 for scales 2 and 3, On the other hand, patient 3019 reported generally less impairment on at least two of the three scales, and patient 2409 reported decreases in Mobility (scale 3) from occasion 1 to occasions 2 and 3. In contrast, Figure 4b shows the results for the ten least significant sets of profiles. As the figure shows, for these patients their scores for all three occasions across all three FAMCATs were essentially identical.
Number of items and test time reduction with AMC approach
On average, when used without the AMC, 22.7 items (range 20.4 to 24.4), were administered during FAMCAT sessions. Table 4 lists the reduction in FAMCAT session number of items and test time, for each testing session, with the AMC approach among the 175 patients who were found to have significant multidimensional change. When the AMC was used with the FAMCAT a mean (SD) reduction in MCAT number of items of 13.6(11.1), 13.1(9.8), and 18.1(10.8) would occur during the second, third, and fourth FAMCAT sessions, respectively, which corresponded to a reduction in test duration of 3.0(2.4), 3.0(2.8), and 4.7(2.6) minutes. Thus, the AMC approach reduced FAMCAT sessions by an average of 12.6 items (55%) and 2.9 minutes (53%) among patients with psychometrically significant score changes.
Table 4.
Mean (SD) reduction in the number of items and time used (in minutes) per FAMCAT session among patients who were found to have significant multidimensional change.
| Group | N | Occasion 2 | Occasion 3 | Occasion 4 | Total |
|---|---|---|---|---|---|
| Number of items | |||||
| 2 MCATs | 79 | 15.6 (11.8) | - | - | 15.6 (11.8) |
| 3 MCATs | 14 | 14.1 (10.3) | 20.8 (11.0) | - | 34.9 (19.7) |
| 4 MCATs | 17 | 3.9 (8.4) | 6.7 (8.8) | 18.1 (10.8) | 28.6 (19.9) |
| Time used | |||||
| 2 MCATs | 79 | 3.37 (2.29) | - | - | 3.37 (2.29) |
| 3 MCATs | 14 | 3.42 (2.90) | 4.43 (2.33) | - | 7.85 (4.54) |
| 4 MCATs | 17 | 1.04 (2.77) | 1.91 (3.21 | 4.73 (2.63) | 7.67 (5.04) |
Discussion
In this paper we report the first clinical application of the AMC approach, and its associated gains in measurement efficiency and reductions in response burden. The examples of intra-individual change presented Figures 2–4 suggest that the AMC procedure can provide useful data on patient-reported change in a hospital environment. The FAMCAT in an AMC context was shown to be effective and efficient. The effectiveness of the method was demonstrated by its ability to identify significant patterns of change for single patients. Those determinations of significant change were made separately for each patient, independent of the data from any other patient. The AMC approach permitted a mean 55% reduction in the number of items administered in follow up FAMCAT sessions among patients for whom psychometrically significant change was detected.
The first question answered by the AMC procedure is whether the observed change in a patient’s reported outcomes is significant or not. If the AMC reports non-significant change, observed change in a patient’s scores can be considered to be due to random psychometric error and likely will also not be clinically significant If, on the other hand, a change—either on a single scale or the entire profile of scores –is identified as psychometrically significant, the magnitudes and patterns of change should then be examined to evaluate whether the observed change in measurements are clinically significant.
The significance of change is roughly reflected by the overlap of the SEM bands that reflect the precision of measurement for each IRT scale score. However, the actual significance tests used in AMC have been identified as performing better than the confidence interval overlap method.16 Nevertheless, SEM interval overlap is helpful in identifying where, in a sequence of measurement occasions, significant change has occurred. The SEM intervals, however, are a function of the quality of the item banks from which the CATs are drawn. As the results demonstrated, SEM bands for Applied Cognition were substantially larger than those for Mobility, resulting in a higher level of identification of significant change for Mobility and identification of significant change for smaller difference in IRT θ estimates. The differences in the performance for each of the scales is primarily a reflection of the quality of their item banks—the Mobility bank had the most discriminating items whereas Applied Cognition had the lowest average information.26
These differences in SEMs can result from a combination of two factors: (1) the amount of psychometric information available within a scale across the θ continuum, and (2) how well the patient’s responses are consistent with the underlying IRT model used to score patients. The former source of variation in SEMs reflects the magnitude of scale information at a given θ level, which varies for each scale. The latter can reflect patient motivation to respond meaningfully to the items, cognitive issues in understanding the items, misperceptions of their symptoms, impaired memory, and other individual differences that contribute to lack of model fit for a patient.
AMC provides a rich means of studying the correlates of functional change, in both hospital environments and at post-hospital follow-up. Using AMC, group change can be viewed as the aggregation of individual change, whereas using statistical approaches, individuals are embedded in a group that typically mixes significant and non-significant change. Thus, after identifying those whose change is not significant using AMC, questions can be framed as to the correlates, antecedents, and consequents of lack of change, and within the change group similar questions can be investigated. The change group can, of course, be contrasted with the no-change group and appropriate external variables can be related to change classification. Patients with positive change can be separated from those with negative change on one (or more) of the measured variables or the full set of variables. Other creative ways of using individual change data will also likely emerge.
Among patients whose FAMCAT scores changed significantly, use of the AMC approach offers the opportunity to reduce mean testing time and number of items by more than half. AMC therefore represents an important and unique opportunity to reduce respondent burden associated with longitudinal assessments without compromising measurement precision. In order to actualize this benefit, it will be critical to refine methods that apply to patients whose scores do and do not demonstrate significant change on subsequent testing. To improve the efficiency of AMC for patients who do not change, it will be important to develop CAT stopping rules that terminate the AMC testing process when it can be determined early in a CAT that there is essentially no possibility of finding that a significant change has occurred. Research focusing on these limitations of the AMC procedure is currently under way.
Limitations
Although the AMC method has been successfully applied in this PROM research and provides important and actionable information for both patient care and research, further development of the method is required. First, as currently implemented, the hypothesis tests are omnibus tests, which examine the hypothesis that there is a significant difference among the θ estimates across the measurement occasions. However, when there are more than two measurement occasions, it would be useful to know between which occasions the measurements were significantly different. Consequently, it is important to develop hypothesis tests for contrasts among pairs of θ estimates for a given patient. Second, all research to date on the technical aspects of AMC has been done using true IRT parameters in the simulations. With real patients, however, IRT parameter estimates will always be estimates and will, therefore, incorporate some error. Therefore, it is important to evaluate the effect of item parameter estimation error on the performance of AMC. Third, despite of the above-mentioned limitations of the group-based change statistics, it would still be interesting to evaluate the extent to which the classification of individuals to significant and non-significant groups may differ from intra-individual versus group-based approaches. The technical details about how the group-based longitudinal models could be used to make individual level inference are presented in the literature.21 Validation of AMC-based determination of significant change, relative to patients’ and clinicians’ perceptions of presence and degree of change, are needed.
Conclusions
Applying the AMC approach to FAMCAT assessment demonstrated that psychometric significance is a viable procedure for measuring individual change. The AMC approach allowed for a greater than 50% reduction in number of items and test duration for repeat assessments among patients with significant change, thereby providing an important candidate method for reducing PROM response burden while maintaining measurement precision.
Acknowledgment of financial support:
This research was supported by the Eunice Kennedy Shriver National Institutes of Child Health and Human Development of the National Institutes of Health under Award Number R01HD079439 to the Mayo Clinic in Rochester Minnesota through subcontracts to the University of Minnesota and the University of Washington. The content is solely the responsibility of the authors and does not necessarily represent the official views of the National Institutes of Health.
Abbreviations:
- AMC
adaptive measurement of change
- AM-PAC
Activity Measure for Post-Acute Care
- CAT
computerized adaptive testing
- ePROMs
electronic PROMs
- EHR
electronic health record
- FAMCAT
Functional Assessment in Acute Care Multidimensional Computerized Adaptive Test
- IRT
item response theory
- MCAT
multidimensional computerized adaptive testing
- PROM
patient-reported outcome measure
- SEM
standard error of measurement
Footnotes
Conflicts of interest: None.
Publisher's Disclaimer: This is a PDF file of an unedited manuscript that has been accepted for publication. As a service to our customers we are providing this early version of the manuscript. The manuscript will undergo copyediting, typesetting, and review of the resulting proof before it is published in its final form. Please note that during the production process errors may be discovered which could affect the content, and all legal disclaimers that apply to the journal pertain.
Contributor Information
David J. Weiss, University of Minnesota
Chun Wang, University of Washington.
Andrea L. Cheville, Mayo Clinic
Jeffrey R. Basford, Mayo Clinic
Joseph DeWeese, University of Minnesota
References
- 1.Basch E, Deal AM, Kris MG, et al. Symptom Monitoring With Patient-Reported Outcomes During Routine Cancer Treatment: A Randomized Controlled Trial. J Clin Oncol 2016;34:557–65. [DOI] [PMC free article] [PubMed] [Google Scholar]
- 2.Chen J, Ou L, Hollis SJ. A systematic review of the impact of routine collection of patient reported outcome measures on patients, providers and health organisations in an oncologic setting. BMC Health Serv Res 2013;13:211. [DOI] [PMC free article] [PubMed] [Google Scholar]
- 3.Black N. Patient reported outcome measures could help transform healthcare. Bmj 2013;346:f167. [DOI] [PubMed] [Google Scholar]
- 4.Turner RR, Quittner AL, Parasuraman BM, Kallich JD, Cleeland CS, Mayo FDAP-ROCMG. Patient-reported outcomes: instrument development and selection issues. Value Health 2007;10 Suppl 2:S86–93. [DOI] [PubMed] [Google Scholar]
- 5.Rolstad S, Adler J, Ryden A. Response burden and questionnaire length: is shorter better? A review and meta-analysis. Value Health 2011;14:1101–8. [DOI] [PubMed] [Google Scholar]
- 6.Nakash RA, Hutton JL, Jorstad-Stein EC, Gates S, Lamb SE. Maximising response to postal questionnaires--a systematic review of randomised trials in health research. BMC Med Res Methodol 2006;6:5. [DOI] [PMC free article] [PubMed] [Google Scholar]
- 7.Bodart S, Byrom B, Crescioni M, Eremenco S, Flood E. Perceived Burden of Completion of Patient-Reported Outcome Measures in Clinical Trials:: Results of a Preliminary Study. Ther Innov Regul Sci 2019;53:318–23. [DOI] [PubMed] [Google Scholar]
- 8.Edwards P, Roberts I, Sandercock P, Frost C. Follow-up by mail in clinical trials: does questionnaire length matter? Control Clin Trials 2004;25:31–52. [DOI] [PubMed] [Google Scholar]
- 9.Revicki D, Hays RD, Cella D, Sloan J. Recommended methods for determining responsiveness and minimally important differences for patient-reported outcomes. J Clin Epidemiol 2008;61:102–9. [DOI] [PubMed] [Google Scholar]
- 10.Husted JA, Cook RJ, Farewell VT, Gladman DD. Methods for assessing responsiveness: a critical review and recommendations. J Clin Epidemiol 2000;53:459–68. [DOI] [PubMed] [Google Scholar]
- 11.Olsen MF, Bjerre E, Hansen MD, Tendal B, Hilden J, Hrobjartsson A. Minimum clinically important differences in chronic pain vary considerably by baseline pain and methodological factors: systematic review of empirical studies. J Clin Epidemiol 2018;101:87–106 e2. [DOI] [PubMed] [Google Scholar]
- 12.Akambase JA, Miller NE, Garrison GM, Stadem P, Talley H, Angstman KB. Depression Outcomes in Smokers and Nonsmokers: Comparison of Collaborative Care Management Versus Usual Care. J Prim Care Community Health 2019;10:2150132719861265. [DOI] [PMC free article] [PubMed] [Google Scholar]
- 13.Cheville AL, Yost KJ, Larson DR, et al. Performance of an item response theory-based computer adaptive test in identifying functional decline. Arch Phys Med Rehabil 2012;93:1153–60. [DOI] [PMC free article] [PubMed] [Google Scholar]
- 14.Grimm KJ, Ram N, Estabrook R. Growth Modeling: Structural Equation and Multilevel Modeling Approaches. Guilford Publications; 2016. [Google Scholar]
- 15.Meredith W, Tisak J. Latent curve analysis. Psychometrika 1990;55:107–22. [Google Scholar]
- 16.Willett JB, Sayer AG. Using covariance structure analysis to detect correlates and predictors of individual change over time. Psychological Bulletin 1994;116:363–81. [Google Scholar]
- 17.Bryk AS, Raudenbush SW. Application of hierarchical linear models to assessing change. Psychological Bulletin 1987;101:147–58. [Google Scholar]
- 18.Cheville AL, Wang C, Yost KJ, Teresi JT, Ramirez M, Ocepek-Welikson K, Ni P, Marfeo E, Keeney T, Basford JR, Weiss DJ, Improving the Delivery of Function-Directed Care During Acute Hospitalizations: Methods to Develop and Validate the Functional Assessment in Acute Care Multidimensional Computerized Adaptive Test (FAMCAT). Archives of Rehabilitation Research and Clinical Translation. 10.1016/j.arrct.2021.100112. [DOI] [PMC free article] [PubMed] [Google Scholar]
- 19.Wang C, Weiss D, Cheville A. Multidimensional Computerized Adaptive Testing for Efficient and Precise Assessment of Applied Cognition, Daily Activity, and Mobility for Hospitalized Patients. Archives of Physical Medicine and Rehabilitation. In Press. [DOI] [PMC free article] [PubMed] [Google Scholar]
- 20.Weiss DJ, Wang C, DeWeese J, Basford J, Cheville A. Can Proxy Ratings Supplement Patient Report to Assess Functional Domains Among Hospitalized Patients? Archives of Physical Medicine and Rehabilitation In Review. [DOI] [PMC free article] [PubMed] [Google Scholar]
- 21.Weiss DJ, Kingsbury GG. Application of computerized adaptive testing to educational problems. Journal of Educational Measurement 1984;21:361–75. [Google Scholar]
- 22.Finkelman MD, Weiss DJ, & Kim-Kang G ()… Item selection and hypothesis testing for the adaptive measurement of change. Applied Psychological Measurement 2010;34:238–54. [Google Scholar]
- 23.Lee JE. Hypothesis testing for adaptive measurement of individual change (doctoral dissertation). University of Minnesota, Minneapolis, Minnesota; 2015. [Google Scholar]
- 24.Phadke C. Measuring Intra-Individual Change at Two or More Occasions With Hypothesis Testing Methods (doctoral dissertation). University of Minnesota, Minneapolis, Minnesota; 2017. [Google Scholar]
- 25.Wang C, Weiss DJ. Multivariate Hypothesis Testing Methods for Evaluating Significant Individual Change. Appl Psychol Meas 2018;42:221–39. [DOI] [PMC free article] [PubMed] [Google Scholar]
- 26.Wang C, Weiss DJ, Suen KY. Hypothesis Testing Methods for Multivariate Multi-Occasion Intra-Individual Change. Multivariate Behav Res 2020:1–17. [DOI] [PubMed] [Google Scholar]