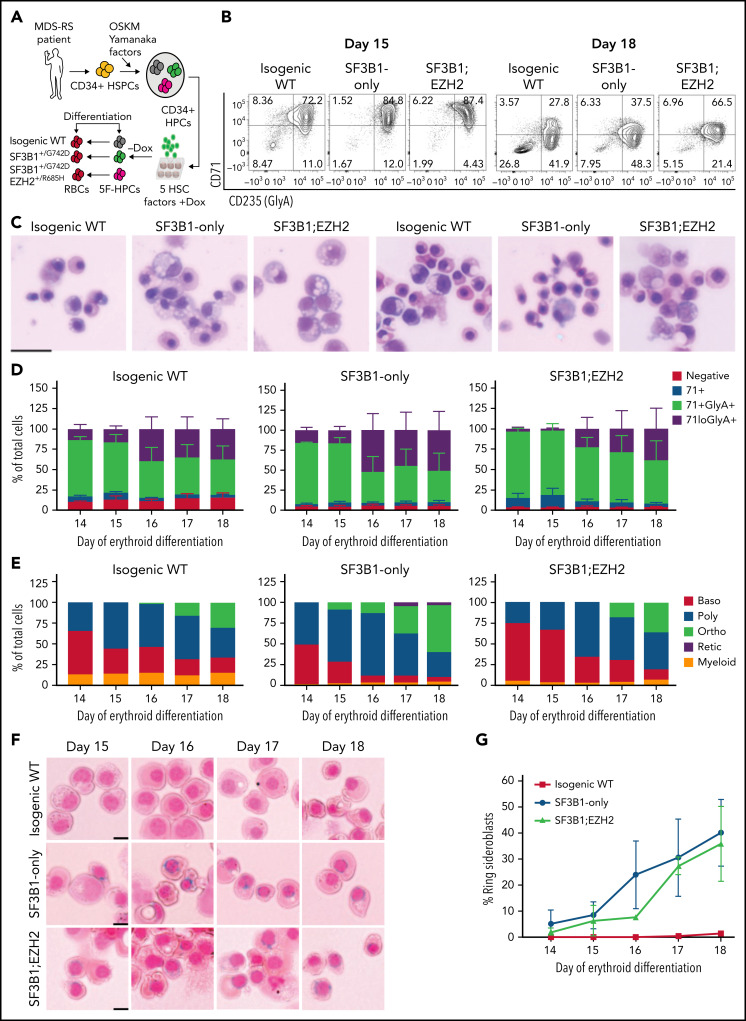
Figure 1.
iPSC model of SF3B1-mutant MDS with RS. (A) Schematic of iPSC reprogramming to generate an SF3B1-mutant MDS-RS model. MDS-RS patient CD34+ cells were reprogrammed with episomal factors and 3 iPSC lines were selected: normal isogenic WT, SF3B1G742D/+, and SF3B1G742D/+;EZH2/R685H/+. iPSCs were differentiated into CD34+ HPCs and transduced with 5 transcription factors (ERG, HOXA9, RORA, SOX4, MYB) to establish doxycycline-expandable 5F-HPCs, which serve as progenitor lines for erythroid differentiation studies. (B) Representative flow plots of CD71 and CD235 (Glycophorin A) expression in isogenic WT, SF3B1G742D/+, and SF3B1G742D/+;EZH2R685H/+ cells on days 15 and 18 of erythroid differentiation. (C) Representative May-Grunwald Giemsa staining of erythroid cell morphology on days 15 (left 3 images) and 18 (right 3 images) of differentiation. Scale bar, 25 μm. (D) Erythroid differentiation staging using CD71 and GlyA levels measured by flow cytometry using the gating strategy shown in 1B from days 14 to 18 of erythroid differentiation; mean ± standard error of the mean of n = 3. (E) Quantification of erythroid cell morphology using May-Grunwald Giemsa staining from days 14 to 18. A representative experiment was counted; >30 cells counted for each day of differentiation. (F) Representative images of RS iron staining in SF3B1-WT and SF3B1-mutant cells. Erythroid cells were collected on days 15 through 18 of erythroid differentiation and stained with Perls Prussian blue. Scale bar, 10 μm. (G) Quantification of RS counts in the isogenic WT and SF3B1G742D/+ erythroid cells; >200 cells counted; mean ± standard deviation (SD) of n = 3 independent experiments and SF3B1G742D/+;EZH2/R685H/+ cells; mean ± SD of n = 2; >150 cells counted. Baso, basophilic erythroblast; poly, polychromatic erythroblast; ortho, orthochromatic erythroblast; retic, reticulocyte.

