

Abstract
In this paper, a series of fracture conductivity experiments were designed and conducted by an American Petroleum Institute (API) standard fracture conductivity evaluation system. The mixing proportion of quartz sand and ceramic was optimized. By the evaluation of the proppant breakage rate and sphericity analysis of mixed proppant with different sand volume proportions (PS), the proppant mixture conductivity evolution behavior was analyzed. Results of this study showed that the conductivity of mixed proppant was between that of pure ceramic proppant and pure quartz sand proppant under the same conditions. For 20/40 mesh mixed proppant, a small amount of ceramic (25%) in mixed proppant could obtain 1.27–3 times higher conductivity than pure sand, while 40/70 mesh mixed proppant required the addition of 50% or more ceramic. The crushing resistance of mixed proppant determined the decrease of conductivity with the increase of effective closure stresses. A logarithmic empirical model was further derived from the results, which could be used to forecast the performance of fracture conductivity at different effective closure stresses and sand volume proportions.
Introduction
For tight oil and gas reservoirs, the porosity and permeability are ultralow compared to conventional reservoirs; thus, large-scale hydraulic fracturing is usually conducted to enhance hydrocarbon production.1,2 Due to the poor petrophysical properties of tight reservoirs, the flow of oil and gas from matrix to fracture is very slow,3−5 which results in excessive high fracture conductivity having a little contribution to improving the productivity of oil or gas wells.6,7 It is necessary to build a just-good-enough fracture conductivity in tight reservoirs rather than to construct super high fracture conductivity.8,9 Quartz sand and ceramic are widely used proppant during hydraulic fracturing. Because of superior crush and chemical resistance,10 ceramic has superior conductivity to quartz sand at the same stress and proppant pack thickness conditions. However, its price is much higher than that of quartz sand. Specifically, the price of ceramic is 3–5 times higher than that of quartz sand proppant.11 To obtain an economic production of the tight reservoirs, only the pursuit of high fracture conductivity is not the best option. It is necessary to figure out a reasonable fracture prop method. By adopting the proposed method, the economic production rate and low conductivity construction investment can be achieved at the same time.
Many scholars have suggested replacing the traditional single proppant design with the combined proppants, which may be segregated by tail-in, evenly blended, or blended with dominant concentrations of one particular size.12−15 In the study of segmental by tail-in, the conductivity variation characteristics of different proppant types, sizes, and mass ratios have been investigated.12,16 And a relevant empirical model based on the experimental results has also been proposed.17 In the study of the mixed proppant, some research on the conductivity of a mixed proppant pack with different sizes and types has produced some interesting findings. It has been proved that small proppants introduced into proppant packs can severely hinder conductivity.18 The adverse effect induced by proppant size difference has been revealed that, as illustrated in Figure 1, when some different size proppants are mixed, small proppants will fill into the pores formed by large proppants, thus reducing the fracture conductivity, which is very similar to the mechanism of the decrease of conductivity caused by the crushing of proppant particles. At the same time, it is also found that in the actual production, the particle size difference in the mixed proppant is too large, which is easier to aggravate the pore plugging effect caused by the migration of small particles.7,19,20 The research on mixing ceramic and sand shows that even a 1:1 mixture is dominated by the lower conductivity of sand and small amounts of 100 mesh (5%) by weight would result in above 25% reductions in permeability.21 Furthermore, by testing the fracture conductivity at various ratios of the mixed proppant with different sizes, the potential effect of the mixed proppant sizes relative to fracture conductivity has been understood in hybrid completion designs.16 Rui et al. have proposed a coupled flow-stress-damage (FSD) model of hydraulic fracture propagation with gravels based on the characteristics of the glutenite reservoirs.2 In addition, there are some numerical simulation researchers on the mixed proppant.22−24 Guo et al.25,26 have conducted a physical simulation of hydraulic fracturing of large-sized tight sandstone outcrops and have evaluated the unconventional performance and the applicability of the coated proppant. It is not difficult to find that predecessors have done a lot of work on the mixed conductivity of proppants with different particle sizes. However, there are relatively few studies on the conductivity behavior of the mixed proppant in the case of equal particle size proppant mixtures. Meanwhile, there is also a lack of relevant models that can be used to predict the conductivity in the case of equal particle size mixing.
Figure 1.

Proppant pack with the same particle size series (a) and different particle size series (b). Gray represents proppant series with large particle size, and blue represents proppant series with small particle size.
In this paper, a series of experiments have been carried out using ceramic and quartz sand proppant obtained from Changqing oilfield, China. The fracture conductivity behaviors at different proppant mixing proportions are evaluated experimentally. A propped fracture conductivity prediction model of proppant mixtures is established, which can provide a guide for proppant schemes during hydraulic fracturing operations.
Experimental Design and Procedures
The fracture conductivity test of the mixed proppant pack is conducted by a conductivity measurement device designed by the laboratory. The main body of this apparatus includes a displacement system, a pressure-loading system, and a data acquisition and recording system. The schematic diagram of the conductivity measurement device is shown in Figure 2.
Figure 2.

Schematic diagram of fracture conductivity evaluation system device (single conductivity cell).
Proppants Materials
Four proppants widely used in the ChangQing oilfield have been obtained (Figure 3), including 20/40 mesh quartz sand, 20/40 mesh ceramic, 40/70 mesh quartz sand, and 40/70 mesh ceramic. The volume density and sphericity of the proppants are summarized in Table 1. The particle diameters of 20/40 mesh ceramic and 20/40 mesh quartz sand are 357 and 372 μm, respectively, while the average particle size of 40/70 mesh ceramic and 40/70 mesh quartz sand are 200 and 211 μm, respectively.
Figure 3.

Enlarged proppant sample in the experiment: (a) 20/40 mesh ceramic, (b) 40/70 mesh ceramic, (c) 20/40 mesh quartz sand, and (d) 40/70 mesh quartz sand.
Table 1. Statistical Table of Key Physical Properties of Proppants.
| ceramic proppant | sand proppant | |||
|---|---|---|---|---|
| mesh range (mesh) | 20/40 | 40/70 | 20/40 | 40/70 |
| bulk density (g/cm3) | 1.46 | 1.43 | 1.53 | 1.47 |
| average diameter (μm) | 357 | 200 | 372 | 211 |
| roundness (dimensionless) | 0.89 | 0.9 | 0.64 | 0.5 |
| sphericity (dimensionless) | 0.9 | 0.9 | 0.69 | 0.61 |
Determination of Closure Stress Range
The closure stress can be determined by analyzing the petrophysical and geological information of the Changqing oilfield. Table 2 provides vertical depth, stress gradients, pressure gradient, and abandonment pressure of Ordos Basin. The initial effective closure stress can be calculated by eq 1, and the exhaustion effective closure stress can be calculated by eq 2. The range of the initial effective closure stress is 11.4–24.4 MPa, and the range of the depletion effective closure stress is 31.9–57.2 MPa. In our experiments, a total of seven closure stress measurement points are selected for the test, and they are 10, 20, 30, 40, 50, 60, and 70 MPa, respectively.
| 1 |
| 2 |
where σeint is the initial effective closing stress, MPa; Gσh is the horizontal minimum principal stress gradient, MPa/100 m; H is the vertical depth of the reservoir, m; Gpor is the pore pressure gradient, MPa/100 m; σedep is the effective closure stress when the reservoir pressure reaches the abandonment pressure, MPa; and Ppor is the abandonment pressure, MPa.
Table 2. Statistical Table of Stratigraphic Parameters in Ordos Basin.
| formation parameters | upper boundary | lower boundary | average |
|---|---|---|---|
| vertical depth (m) | 3000 | 4200 | 3600 |
| horizontal minimum principal stress gradient (MPa/100 m) | 1.23 | 1.48 | 1.38 |
| horizontal maximum principal stress gradient (MPa/100 m) | 2.21 | 2.14 | 2.13 |
| vertical principal stress gradient (MPa/100 m) | 1.9 | 2.33 | 2.11 |
| pore pressure gradient (MPa/100 m) | 0.85 | 0.9 | 0.88 |
| abandonment pressure (MPa) | 4 | 6 | 5 |
Proppant Mass Calculation
Since the conductivity of the proppant pack is a function of particle size distribution and arrangement,27 the proppant mixture and volume have an influence on fracture conductivity to some extent. For a single proppant pack, the proppant mass is usually calculated by proppant concentration (kg/m2 or lb/ft2).28−30 However, due to the density difference of ceramic and quartz sand, the volume of the proppant pack at the same proppant mass is different. It is unreasonable to use proppant concentration to calculate the proppant mixture mass when two different densities of proppant are mixed. Therefore, to avoid the influence caused by different pack volumes, all experiments in this paper have used initial proppant pack thickness (volume) to quantitatively calculate the total proppant mass required by the experiment. The specific calculation formula is illustrated in eq 3.
| 3 |
where m is the total proppant mass to be weighed in the experiment, g; A is the proppant pack area, cm2 (for a standard API cell, A = 64.52 cm2); Wf is the designed proppant pack thickness, cm; ρc is the ceramic volume density, g/cm3; ρs is the ceramic volume density, g/cm3; Ic is the ceramic proportion, dimensionless; Is is the quartz proportion, dimensionless; and Ic + Is = 1.
Pure Ceramic or Sand Conductivity Test
The conductivity of the proppant is defined as the product of the width of the proppant pack and its permeability. The calculation formula at Darcy flow conditions is shown by eq 4.
| 4 |
For a standard API cell, L = 12.7 cm and w = 3.81 cm are substituted into eq 4, and the simplified calculation formula is eq 5.17,20
| 5 |
where kWf is the conductivity of the proppant pack, μm2·cm; Q is the flow rate, mL/min; and Δp is the pressure difference between upstream and downstream, kPa.
To obtain baseline conductivity, a pure (single) proppant conductivity experiment scheme has been designed. The effective closure pressure is 10, 20, 30, 40, 50, 60, and 70 MPa. The loading time under each closure pressure point is 25 min, and the flow rate is set at 5 mL/min. The designed proppant thickness is 5 mm. Table 3 provides proppant type, proppant size, bulk density, pack thickness, proppant concentration, and proppant mass information on each pure ceramic or sand conductivity test.
Table 3. Experimental Scheme of Single Proppant Conductivity.
| experiment no. | proppant type | proppant size (mesh) | bulk density (g/cm3) | pack thickness (mm) | proppant concentration (kg/m2) | proppant mass (g) |
|---|---|---|---|---|---|---|
| 1 | ceramic | 20/40 | 1.46 | 5 | 7.3 | 47.09 |
| 2 | 40/70 | 1.43 | 5 | 7.2 | 46.12 | |
| 3 | sand | 20/40 | 1.53 | 5 | 7.7 | 49.34 |
| 4 | 40/70 | 1.47 | 5 | 7.4 | 47.14 |
As shown in Figure 4, the conductivity measurement procedure mainly includes the following steps:
Figure 4.

Workflow of proppant pack conductivity test.
Step1: We weigh a certain mass of proppant according to the designed proppant pack thickness.
Step2: We install a lower piston, lay proppant in the conductivity cell, and install an upper piston.
Step3: We connect the lines and vacuum the lines.
Step4: We set the differential pressure gauge to zero.
Step5: We saturate the experimental liquid holder.
Step6: We load the effective closing pressure to 10 MPa and open the ISCO pump to drive until the flow is stable.
Step7: We record the differential pressure, flow rate, pore pressure, and other parameters.
Step8: After the test of the effective closing pressure point (10 MPa) is completed, we increase the effective closing pressure to 20 MPa and repeat step1 to step7 until the end of the experiment (effective closing pressure 70 MPa).
Proppant Mixture Conductivity Test
A mixed proppant scheme means adding a certain amount of ceramic and sand according to proportion, then mixing the proppants completely and evenly. The proppant mixture conductivity calculation formula is shown in eq 5. The proppants are mixed with the same particle size to investigate the fracture conductivity behaviors of proppant mixtures. The proppants are composed of the mixtures of 20/40 mesh quartz sand and 20/40 mesh ceramic or by the mixtures of 40/70 mesh quartz sand and 40/70 mesh ceramic at various proportions.
As shown in eq 6, we define the quartz sand volume proportion PS as the quartz sand volume to the total volume of the proppant mixture. For example, when the 20/40 mesh sand and ceramic are mixed in a ratio of 1:3, then PS is equal to 0.25; when the 20/40 mesh proppant is composed of pure ceramic, then PS is equal to 0; and when the 20/40 mesh proppant is composed by pure quartz sand, then PS is equal to 1. The PS value of other quartz sand proportions can be calculated by following this rule.
| 6 |
The proppants are mixed with quartz sand and ceramic of the same size (Figure 5) before proppant loading. The tests of effective closure pressure, pressure loading sequence, loading time, flow rate, and other experimental conditions are kept the same as the pure proppant conductivity test. Table 4 provides proppant size, pack thickness, mixture volume ratio, bulk density, and proppant mass information on each proppant mixture’s conductivity test.
Figure 5.

Different proppant forms before testing of the mixed proppant (an inlet of the cell on the left, the outlet of the cell on the right, 40/70 mesh sand: ceramic = 1:2).
Table 4. Experimental Scheme of Proppant Mixtures Conductivity.
| bulk density (g/cm3) |
proppant mass (g) |
||||||
|---|---|---|---|---|---|---|---|
| experiment no. | proppant size (mesh) | pack thickness (mm) | mixture volume ratio | sand | ceramic | sand | ceramic |
| 1 | 20/40 | 5 | 1:3 | 1.53 | 1.46 | 12.34 | 35.32 |
| 2 | 5 | 1:2 | 1.53 | 1.46 | 16.45 | 31.39 | |
| 3 | 5 | 1:1 | 1.53 | 1.46 | 24.67 | 23.55 | |
| 4 | 5 | 2:1 | 1.53 | 1.46 | 32.89 | 15.70 | |
| 5 | 5 | 3:1 | 1.53 | 1.46 | 37.01 | 11.77 | |
| 6 | 40/70 | 5 | 1:3 | 1.47 | 1.43 | 11.85 | 34.59 |
| 7 | 5 | 1:2 | 1.47 | 1.43 | 15.80 | 30.75 | |
| 8 | 5 | 1:1 | 1.47 | 1.43 | 23.71 | 23.06 | |
| 9 | 5 | 2:1 | 1.47 | 1.43 | 31.61 | 15.37 | |
| 10 | 5 | 3:1 | 1.47 | 1.43 | 35.56 | 11.53 | |
Proppant Breakage Rate Test
In order to investigate the proppant crushing situation, proppants are collected, dried, and screened, and then the proppant breakage rate is measured after the conductivity tests. The calculation method of breakage rate Br is shown in eq 7.
| 7 |
Experimental Results and Discussion
Pure Proppant Conductivity
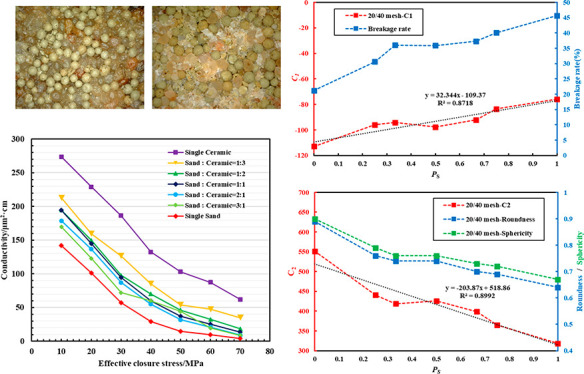
As is shown in Figure 6, baseline conductivity testing of the various ceramic and sand proppants reveals the performance at various loadings. The results show that the larger the proppant particle size is, the higher the conductivity becomes. The conductivity of ceramic is greater than that of quartz sand at the same size. The ceramic proppant pack still maintains a higher conductivity at high closure pressure. For example, the conductivity of 20/40 mesh ceramic is 62 μm2·cm at 70 MPa, while that of quartz sand is 3 μm2·cm. It indicates that pure quartz sand propped fracture cannot provide effective conductivity when the reservoir pressure is about to collapse. The pure ceramic proppant not only can provide the required conductivity but also can increase the investment.
Figure 6.

Comparison of conductivity between ceramic and sand with different sizes under 5 mm proppant pack thickness.
Proppant Mixture Conductivity
Results show that the conductivity of the proppant mixture falls between the conductivity of pure ceramic and pure quartz sand at the same closure pressure, and the conductivity decreases with the increase of sand proportion at the same particle size (Figure 7 and Figure 8). The conductivity of the proppant mixture varies with the sand volume proportion and shows a cask effect; that is, the mixed proppant conductivity is mainly dominated by the sand conductivity proportion. On the one hand, the pure sand propped fracture conductivity can be promoted to a higher level by adding a proportion of ceramic and then hydrocarbon productivity will be enhanced. On the other hand, the pure ceramic investment can be saved by adding a proportion of sand while providing a comparable fracture conductivity.
Figure 7.

Conductivity curves of proppant mixtures in different mixing ratios (size, 20/40 mesh; proppant pack thickness, 5 mm).
Figure 8.

Conductivity curves of proppant mixtures in different mixing ratios (size, 40/70 mesh; proppant pack thickness, 5 mm).
In addition, it has been found that there is a nonlinear relationship between sand volume proportion and mixed proppant conductivity. As is shown in Figure 7 and Figure 8, if the conductivity of the mixed proppant is half of the total conductivity of pure sand and pure ceramic, the proportions of the ceramic should be close to 75% (sand:ceramic = 1:3). For a 20/40 mesh mixed proppant, the conductivity curves differ little when sand: ceramic = 1:2, 1:1, and 2:1. When the sand volume proportion is 75% (sand:tortuosity ceramic = 3:1), its conductivity is 1.27–3 times that of pure sand. It shows that when the particle size of the mixed proppant is large (such as 20/40 mesh), the addition of a small amount of ceramic can greatly improve the conductivity of the proppant pack. In this case, in order to obtain cost-effective fracture conductivity, the maximum proportion of sand allowed in the mixed proppant can reach 75%. However, for the 40/70 mesh mixed proppant, compared with the case where the proportion of sand is less than 50%, when the volume proportion of quartz sand in the mixed proppant exceeds 50%, the fracture conductivity will be greatly reduced (Figure 8). It can be found that the curves of sand:ceramic = 2:1 and 3:1 almost coincide with the conductivity curve of pure sand. Therefore, in hybrid completion design, it is necessary for economic and effective production to increase the volume proportions of ceramic in the 40/70 mesh mixed proppant to 50% or more.
Proppant Breakage Rate Test
Figure 9 shows that most of the ceramic proppants remain in their original conditions after the experiment. However, most of the quartz sand particles are raptured and crushed. The quartz sands particles are broken into smaller particles and fill into the pores of the proppant mixture.
Figure 9.

Breakage of mixed proppant particles after the experiment (20/40 mesh quartz sand:ceramic = 1:1; (a) shoot before drying; (b) shooting after drying; magnification, 94 times).
The breakage rate of the proppant mixture is summarized in Figure 10. The breakage rates of both 20/40 mesh and 40/70 mesh proppant mixtures increase with the increase of quartz sand proportions. The breakage rate of the 40/70 mesh proppant mixture ranges from 12.3 to 30.39%, while that of the 20/40 mesh proppant mixture ranges from 21.22 to 45.68%, indicating that the particle size or diameter is positively proportional to the proppant breakage rate. It shows a positive relationship between breakage rate and conductivity of proppant mixtures. The specific mechanism could be explained that, by the increase of closure pressure, the proppant mixtures are crushed and fill the fine pores of the proppant pack, resulting in the additional reduction of fracture conductivity.
Figure 10.

Statistics of the crushing rate of the mixed proppant.
For PS = 0.67, 0.5, and 0.33, the breakage rates of the 20/40 mesh proppant mixture are in a relatively constant range (Figure 10), and the conductivity of these proppant mixtures is almost equal at the same closure stress (Figure 7). Since the strength of quartz sand is lower than that of ceramic, the broken sand (fine particles) blocks the pores of the propped fracture, and further increases in the proportion of ceramic a small effect on the enhancement of the fracture conductivity.
The breakage rates of the 40/70 mesh proppant mixture are in a relatively constant range when PS = 0.67 and 0.5 (Figure 8). The average conductivity of the PS = 0.5 is 25.76 μm2·cm, while that of PS = 0.67 is 16.54 μm2·cm. Even the breakage rate difference between PS = 0.67 and 0.5 is only 2.14%, but the conductivity of PS = 0.5 is 1.56 times the conductivity of PS = 0.67 (Figure 8).
Conductivity Prediction Model of Proppant Mixture
The exponential decline model and logarithmic model have been proposed by researchers to describe the relationship between the proppant conductivity and effective closure pressure,31 and the typical forms are shown in eq 8 and eq 9. To evaluate the previous models’ adaptability, both the exponential model and logarithmic model have been tested and fitted by the proppant mixture conductivity data considering different sand ratios. Table 5 summarizes the R2 values of quartz sand to the ceramic ratio (PS). The average fitting performance of the 20/40 mesh and 40/70 mesh mixtures under the two form models is plotted in Figure 11.
| 8 |
| 9 |
where KWf is the conductivity of the proppant pack, μm2·cm; (KWf)0 is the initial conductivity of the proppant pack, μm2·cm; λ is the exponential fitting correlation coefficient; σ is the effective closing stress, MPa; and a and b are constants related to the proportion of sand mixing in logarithmic form-fitting.
Table 5. R2 Values of Exponential Formula and Logarithmic Formula.
| size | forms | S = 0 | S = 0.25 | S = 0.33 | S = 0.5 | S = 0.67 | S = 0.75 | S = 1 | average |
|---|---|---|---|---|---|---|---|---|---|
| 20/40 | logarithmic | 0.9711 | 0.9860 | 0.9904 | 0.9906 | 0.9869 | 0.9895 | 0.9806 | 0.9850 |
| exponential | 0.9573 | 0.9457 | 0.9786 | 0.9771 | 0.9781 | 0.9902 | 0.9676 | 0.9707 | |
| 40/70 | logarithmic | 0.9664 | 0.9906 | 0.9869 | 0.9838 | 0.9827 | 0.9862 | 0.9789 | 0.9822 |
| exponential | 0.9976 | 0.9808 | 0.9802 | 0.9666 | 0.9691 | 0.9752 | 0.9893 | 0.9798 |
Figure 11.

Comparison of average R2 values between logarithmic fitting and exponential fitting.
The R2 values of the exponential decline model and logarithmic model are all above 0.97. However, the average R2 value of the logarithmic form is greater than that of the exponential model for both the 20/40 mesh proppant mixture and the 40/70 mesh proppant mixture. Therefore, the logarithmic form regression model is recommended for the prediction of the proppant mixture conductivities. The conductivities of 20/40 mesh and 40/70 mesh proppant mixtures at different PS values are fitted by a logarithmic model, and the results are plotted by Figure 12 and Figure 13, respectively.
Figure 12.

20/40 mesh proppant mixture with different mixing ratios in logarithmic form fitting conductivity curve.
Figure 13.

40/70 mesh proppant mixture with different mixing ratios in logarithmic form fitting conductivity curve.
Due to the difference in geometric and mechanical parameters between sand and ceramic (Table 1), the average sphericity and the strength of the proppant mixture would be changed as the sand volume proportion PS changed. Take the 20/40 mesh mixed proppant as an example. Figure 14 shows the relationship of C1 and Br with the change of PS. It is observed that C1 and Br show a consistent change trend with the increase of PS, in some way, which also means that C1 is the reflection of the crushing resistance (Br) of the mixed proppant. The higher the quartz sand volume proportion is, the worse the crushing resistance of the mixed proppant is, and so the faster the decline of fracture conductivity with the increase of closure pressure became. Figure 15 shows the distribution of C2, sphericity, and roundness of the mixed proppant at different PS values. For the initially mixed proppant pack, without high effective closure stress loading and particle crushing, propped fracture conductivity is a function of proppant particles filling state. Therefore, under the condition of similar particle size of the proppant, the initial conductivity of the mixed proppant pack is mainly controlled by the sphericity of the mixed proppant. It also explains why C2, sphericity, and roundness show a consistent change trend with the increase of PS.
Figure 14.

Relation curve of logarithmic term coefficient C1 and PS of the 20/40 mesh mixed proppant fitting curve.
Figure 15.

Relation curve of constant terms C2 and PS of the 20/40 mesh mixed proppant fitting curve. The R2 value of C2–PS is 0.89, indicating that there is a linear relationship between C2 and PS.
Both C1 and C2 show a linear relationship with PS, indicating that the constant terms C1 and C2 can be replaced by linear relationships of PS. The constant term C1 can be replaced by eq 10, and the constant term C2 can be expressed by eq 11.
| 10 |
| 11 |
Substituting eq 9 and eq 10 into eq 8, the conductivity prediction empirical formula of proppant mixture was established, as shown in eq 12, which can be used to forecast the performance of fracture conductivity at different effective closure stresses and sand volume proportions.
| 12 |
Similarly, for the 40/70 mesh proppant mixture, the relationship of C1 and PS is plotted in Figure 16. The relationship of C2 and PS is plotted in Figure 17. Both C1 and C2 also show a linear relationship with PS, and the constant term C1 and C2 can be replaced by linear expressions of PS. Similarly, the prediction empirical formula of 40/70 mesh quartz sand and ceramic proppant mixtures is also developed as shown in eq 13.
| 13 |
Figure 16.

Relation curve of logarithmic term coefficient C1 and PS of the 40/70 mesh mixed proppant fitting curve. The R2 value of C2–PS is 0.91, indicating that there is a linear relationship between C2 and PS.
Figure 17.

Relation curve of constant terms C2 and PS of the 40/70 mesh mixed proppant fitting curve.
Conclusions
To balance the fracture conductivity requirement and proppant capital investment to confirm the efficient and economic hydrocarbon production, a series of proppant mixture conductivity tests have been designed and conducted by an API standard fracture conductivity evaluation system, the following results have been obtained:
-
1.
The proppant mixtures conductivity tests show that there is a nonlinear relationship between sand volume proportion and mixed proppant pack conductivity. If the conductivity of the mixed proppant is half of the total conductivity of pure sand and pure ceramic, the volume proportion of ceramic should be close to 75%.
-
2.
For the 20/40 mesh mixed proppant, a small amount of ceramic (25%) in the mixed proppant can obtain 1.27–3 times higher conductivity than pure sand, while the 40/70 mesh mixed proppant requires the addition of 50% or more ceramic to acquire cost-effective fracture conductivity.
-
3.
Breakage rate tests indicate that the breakage rate of the proppant mixture is dominated by the crushing of sand, and the proper design of sand volume proportions can effectively reduce the breakage rate and improve the conductivity.
-
4.
Two empirical formulas with logarithmic form have been developed on the basis of 20/40 and 40/70 mesh mixed proppants. C1 and C2 have certain physical significance, in which C1 and C2 can be regarded as the reflection of the crushing resistance and initial conductivity of the mixed proppant, respectively, and both of them have a good linear correlation with the sand volume proportions. And they can be used to predict the conductivity of proppant mixtures at different sand volume proportions and closure stresses.
-
5.
Even though we set the proppant mix ratios of ceramic proppant and quartz sand, the true mix ratios should not be the same as ours. This is because the proppant transport behavior is controlled by many other factures such as proppant density, fluid viscosity, fracture surface roughness, and tortuousity. Further proppant transport behavior experiments are suggested to figure out the true proppant mix ratios in the fractures.
Acknowledgments
This research was supported by the National Natural Science Foundation of China (No. 52004308), by the National Engineering Laboratory for Exploration and Development of Low-Permeability Oil and Gas Fields Foundation of China (No. cqzt-cqjx-2019-zcj-041), and by the National Engineering Laboratory for Drilling Technics of Oil and Gas Foundation of China (No. F2020188).
Glossary
Nomenclature
- a
proportion of sand mixing in logarithmic form-fitting
- A
proppant pack area, cm2 (for a standard API cell, A = 64.52 cm2)
- b
proportion of sand mixing in logarithmic form-fitting
- Br
crushing ratio, %
- Gpor
Pore pressure gradient, MPa/100 m
- Gσh
horizontal minimum principal stress gradient, MPa/100 m
- H
vertical depth of the reservoir, m
- Ic
ceramic proportion, dimensionless
- Is
quartz proportion, dimensionless; Ic + Is = 1
- k
permeability of proppant pack, μm2
- kWf
conductivity of proppant pack, μm2·cm
- (KWf)0
initial conductivity of the proppant pack, μm2·cm
- L
flow length, cm; w is the width of the cell, cm
- m
total proppant mass to be weighed in the experiment, g
- m1
initial mass of the proppant
- m2
mass of the broken proppant, g
- Ppor
abandonment pressure, MPa
- Q
flow rate, cm3/s
- Wf
width of the proppant pack, cm
- Δp
pressure difference between upstream and downstream, atm
- λ
exponential fitting correlation coefficient
- μ
viscosity of the fluid at experimental temperature, mPa·s
- σ
effective closing stress, MPa
- σeint
initial effective closing stress, MPa
- σedep
effective closure stress when the reservoir pressure reaches the abandonment pressure, MPa
- ρc
ceramic volume density, g/cm3
- ρs
ceramic volume density, g/cm3
The authors declare no competing financial interest.
References
- Zhang F.; Zhu H.; Zhou H.; Guo J.; Huang B. Discrete-Element-Method/Computational-Fluid-Dynamics Coupling Simulation of Proppant Embedment and Fracture Conductivity After Hydraulic Fracturing. SPE J. 2017, 22 (02), 632–644. 10.2118/185172-PA. [DOI] [Google Scholar]
- Rui Z.; Guo T.; Feng Q.; Qu Z.; Qi N.; Gong F. Influence of Gravel on the Propagation Pattern of Hydraulic Fracture in the Glutenite Reservoir. J. Pet. Sci. Eng. 2018, 165, 627–639. 10.1016/j.petrol.2018.02.067. [DOI] [Google Scholar]
- Gu M.; Fan M.; Chen C.. Proppant Optimization for Foam Fracturing in Shale and Tight Reservoirs; SPE Unconventional Resources Conference; SPE, 2017; paper SPE-185071-MS; 10.2118/185071-MS. [DOI]
- Gu M.; Kulkarni P.; Rafiee M.; Ivarrud E.; Mohanty K. Optimum Fracture Conductivity for Naturally Fractured Shale and Tight Reservoirs. SPE Prod. Oper. 2016, 31 (04), 289–299. 10.2118/171648-PA. [DOI] [Google Scholar]
- Su H.; Zhou F.; Wang Q.; Yu F.; Dong R.; Xiong C.; Li J.; Liang T. Flow Physics of Polymer Nanospheres and Diluted Microemulsion in Fractured Carbonate Reservoirs: An Investigation into Enhanced Oil Recovery Mechanisms. SPE J. 2021, 26 (04), 2231–2244. 10.2118/205381-PA. [DOI] [Google Scholar]
- Feng Y.; Gray K. E.. Effects of Porous Properties of Rock on Near-Wellbore Hydraulic Fracture Complexity; SPE/AAPG/SEG Unconventional Resources Technology Conference; SPE, 2018; paper URTEC-2883153-MS; 10.15530/URTEC-2018-2883153. [DOI]
- Zhou F.; Su H.; Liang X.; Meng L.; Yuan L.; Li X.; Liang T. Integrated Hydraulic Fracturing Techniques to Enhance Oil Recovery from Tight Rocks. Pet. Explor. Dev. 2019, 46 (5), 1065–1072. 10.1016/S1876-3804(19)60263-6. [DOI] [Google Scholar]
- Palisch T.; Duenckel R.; Wilson B. New Technology Yields Ultrahigh-Strength Proppant. SPE Prod. Oper. 2015, 30 (01), 76–81. 10.2118/168631-PA. [DOI] [Google Scholar]
- Melcher H.; Mayerhofer M.; Agarwal K.; Lolon E.; Oduba O.; Murphy J.; Ellis R.; Fiscus K.; Shelley R.; Weijers L. Shale-Oil-Fracturing Designs Move to Just-Good-Enough Proppant Economics with Regional Sand. SPE Drill. Complet. 2020, 35 (04), 628–643. 10.2118/199751-PA. [DOI] [Google Scholar]
- Katende A.; O’Connell L.; Rich A.; Rutqvist J.; Radonjic M. A Comprehensive Review of Proppant Embedment in Shale Reservoirs: Experimentation, Modeling and Future Prospects. J. Nat. Gas Sci. Eng. 2021, 95, 104143. 10.1016/j.jngse.2021.104143. [DOI] [Google Scholar]
- Maity D.; Ciezobka J. An Interpretation of Proppant Transport Within the Stimulated Rock Volume at the Hydraulic-Fracturing Test Site in the Permian Basin. SPE Reserv. Eval. Eng. 2019, 22 (02), 477–491. 10.2118/194496-PA. [DOI] [Google Scholar]
- Wen Q.; Zhang S.; Wang L.; Liu Y.; Li X. The Effect of Proppant Embedment upon the Long-Term Conductivity of Fractures. J. Pet. Sci. Eng. - J. PET SCI Eng. 2007, 55, 221–227. 10.1016/j.petrol.2006.08.010. [DOI] [Google Scholar]
- Barasia A.; Pankaj P.. Tail-In Proppant and Its Importance in Channel Fracturing Technique; SPE Bergen One Day Seminar; SPE, 2014; paper SPE-169227-MS, 10.2118/169227-MS. [DOI]
- Greff K.; Greenbauer S.; Huebinger K.; Goldfaden B.. The Long-Term Economic Value of Curable Resin-Coated Proppant Tail-in to Prevent Flowback and Reduce Workover Cost; URTEC Conference; URTEC, 2014; paper URTEC-1922860-MS, 10.15530/URTEC-2014-1922860. [DOI] [Google Scholar]
- Bandara K. M. A. S.; Ranjith P. G.; Rathnaweera T. D. Laboratory-Scale Study on Proppant Behaviour in Unconventional Oil and Gas Reservoir Formations. J. Nat. Gas Sci. Eng. 2020, 78, 103329. 10.1016/j.jngse.2020.103329. [DOI] [Google Scholar]
- Schmidt D.; Rankin P. E. R.; Williams B.; Palisch T.; Kullman J.. Performance of Mixed Proppant Sizes; SPE Hydraulic Fracturing Technology Conference; SPE, 2014; paper SPE-168629-MS, 10.2118/168629-MS. [DOI] [Google Scholar]
- Liang X.; Zhou F.; Liang T.; Huang Y.; Wei D.; Ma S. The Effect of Combined Proppants upon the Fracture Conductivity in Tight Gas Reservoirs. Energy Rep. 2020, 6, 879–884. 10.1016/j.egyr.2020.04.007. [DOI] [Google Scholar]
- Coulter G. R.; Wells R. D. The Advantages of High Proppant Concentration in Fracture Stimulation. J. Pet. Technol. 1972, 24 (06), 643–650. 10.2118/3298-PA. [DOI] [Google Scholar]
- Feng Y.; Jones J. F.; Gray K. E. A Review on Fracture-Initiation and -Propagation Pressures for Lost Circulation and Wellbore Strengthening. SPE Drill. Complet. 2016, 31 (02), 134–144. 10.2118/181747-PA. [DOI] [Google Scholar]
- Wang J.; Huang Y.; Zhou F.; Liang X. The Influence of Proppant Breakage, Embedding, and Particle Migration on Fracture Conductivity. J. Pet. Sci. Eng. 2020, 193, 107385. 10.1016/j.petrol.2020.107385. [DOI] [Google Scholar]
- McDaniel R. R.; Willingham J. R.. The Effect Of Various Proppants And Proppant Mixtures On Fracture Permeability; SPE Annual Fall Technical Conference and Exhibition; SPE, 1978; paper SPE-7573-MS, 10.2118/7573-MS. [DOI]
- Feng Y.; Li X.; Gray K. E. Development of a 3D Numerical Model for Quantifying Fluid-Driven Interface Debonding of an Injector Well. Int. J. Greenh. Gas Control 2017, 62, 76–90. 10.1016/j.ijggc.2017.04.008. [DOI] [Google Scholar]
- Fan M.; Han Y.; Gu M.; McClure J.; Ripepi N.; Westman E.; Chen C.. Combining Discrete Element Method with Lattice Boltzmann Modeling to Advance the Understanding of the Performance of Proppant Mixtures; 53rd U.S. Rock Mechanics/Geomechanics Symposium; ARMA, 2019; paper ARMA-2019-1668.
- Fan M.; Han Y.; Gu M.; McClure J.; Ripepi N.; Westman E.; Chen C. Investigation of the Conductivity of a Proppant Mixture Using an Experiment/Simulation-Integrated Approach. J. Nat. Gas Sci. Eng. 2020, 78, 103234. 10.1016/j.jngse.2020.103234. [DOI] [Google Scholar]
- Guo T.; Wang Y.; Du Z.; Chen M.; Liu D.; Liu X.; Rui Z. Evaluation of Coated Proppant Unconventional Performance. Energy Fuels 2021, 35 (11), 9268–9277. 10.1021/acs.energyfuels.1c00187. [DOI] [Google Scholar]
- Guo T.; Tang S.; Liu S.; Liu X.; Xu J.; Qi N.; Rui Z. Physical Simulation of Hydraulic Fracturing of Large-Sized Tight Sandstone Outcrops. SPE J. 2021, 26 (01), 372–393. 10.2118/204210-PA. [DOI] [Google Scholar]
- Duenckel R. J.; Barree R. D.; Drylie S.; O’Connell L. G.; Abney K. L.; Conway M. W.; Moore N.; Chen F.. Proppants- What 30 Years of Study Has Taught Us; SPE Annual Technical Conference and Exhibition; SPE, 2017; paper D021S016R001, 10.2118/187451-MS. [DOI]
- Cleary M. P.; Johnson D. E.; Kogsbøll H.-H.; Owens K. A.; Perry K. F.; de Pater C. J.; Stachel A.; Schmidt H.; Mauro T.. Field Implementation of Proppant Slugs To Avoid Premature Screen-Out of Hydraulic Fractures With Adequate Proppant Concentration; Low Permeability Reservoirs Symposium; SPE, 1993; paper SPE-25892-MS, 10.2118/25892-MS. [DOI]
- Rivers M.; Zhu D.; Hill A. D. D.. Proppant Fracture Conductivity With High Proppant Loading and High Closure Stress; SPE Hydraulic Fracturing Technology Conference; SPE, 2012; paper SPE-151972-MS, 10.2118/151972-MS. [DOI]
- Tang Y.; Ranjith P. G.; Perera M. S.; Rathnaweera T. D. Influences of Proppant Concentration and Fracturing Fluids on Proppant-Embedment Behavior for Inhomogeneous Rock Medium: An Experimental and Numerical Study. SPE Prod. Oper. 2018, 33 (04), 666–678. 10.2118/189984-PA. [DOI] [Google Scholar]
- Jansen T.; Zhu D.; Hill A. D.. The Effect of Rock Mechanical Properties on Fracture Conductivity for Shale Formations; SPE Hydraulic Fracturing Technology ConferenceSPE, 2015; paper D021S005R001, 10.2118/SPE-173347-MS. [DOI]