

Abstract

Hybrid composite materials are a class of materials where more than one type of reinforcement is integrated into a matrix to achieve superior properties. This typically involves nanoparticle fillers employed within traditional advanced composites with fiber reinforcements such as carbon or glass. The current study builds on previous investigations of boron nitride nanotube (BNNT) hybrid composites, specifically glass fiber (GF)–epoxy/BNNT composite laminates. GF is an effective and affordable primary reinforcement fiber in many applications, and boron nitride nanotubes (BNNTs) exhibit impressive mechanical properties comparable to carbon nanotubes (CNTs) with distinct functional properties, such as electrical insulation, which is desirable in manufacturing insulating composites when combined with GF. GF–epoxy/BNNT composite laminates, incorporating BNNT materials with different loadings (1 and 2 wt %) and purity, were manufactured using a hand layup technique and prepared for three-point bending, modified Charpy, dynamic mechanical analysis (DMA), and fracture toughness (mode I and mode II) measurements. A comprehensive microscopy study was also performed using scanning electron microscopy (SEM) showing prominent failure mechanism, nanotube dispersion, and their mode of reinforcement in different loading scenarios. Enhanced properties, including a 43% increase in mode II fracture toughness, were observed in hybrid composites with 1 wt % BNNT compared to the GF composites with neat epoxy, and the reinforcement mechanisms were discussed.
1. Introduction
Traditional composite materials, containing a matrix and some form of reinforcement, are now considered a fully established option for many applications. Fiber-reinforced polymer (FRP) composites with long and continuous reinforcements belong to the category of advanced composite materials and include glass-fiber-reinforced polymers (GFRPs), which have demonstrated their potential for a wide variety of applications from structures (aerospace, automotive, and wind turbines) to electronics (circuit board substrates) and armor (impact-resistant materials).1−3 The type of glass fiber (GF) can be selected based on the application; for example, S-glass is suited for applications requiring high tensile strength, and C-glass is targeted where chemical durability is desired.4 However, FRPs are prone to interlaminar and matrix-dominated damages, which calls for a careful consideration when high resistance to delamination and impact damage is needed. A comprehensive understanding of the laminated composite material’s resistance to interlaminar fracture is essential for product development and material selection. Previous studies on the fracture toughness of composite materials are well-documented in the literature.5−10
Modification of the matrix polymer with different nanomaterials in general,11,12 and nanotubes in particular,13,14 is considered a viable approach to improve matrix-dominated properties of FRPs. When considering tubular nanostructures, the literature primarily focuses on carbon nanotubes (CNTs) as reinforcements to create multiscale hybrid composites consisting of a primary reinforcement fiber (e.g., GF or carbon fiber) and a CNT-enhanced polymer matrix.13−16 CNTs also bring multifunctionality to traditional FRP composites, which include enhancement in electrical (e.g., electromagnetic shielding and electrostatic discharge),17,18 thermal (e.g., thermal conductivity and thermal stability),19 and mechanical properties (e.g., interlaminar properties),15,16 as well as sensing.20
Boron nitride nanotubes (BNNTs) offer mechanical properties as impressive as CNTs and have also been successfully employed to reinforce polymer matrices.21,22 Because of the similar geometric shapes of CNTs and BNNTs (both tubular structures), the physical interaction between these materials and the matrix (including mechanical interlocking, wrapping, and so forth) resembles each other. However, the difference in the molecular structure and polarity of CNTs and BNNTs leads to more favorable interaction of BNNTs with polymers23,24 and also results in different multifunctional properties including electrical insulation, lack of absorption in the visible spectrum, higher thermo-oxidative stability, and high neutron absorption. Such characteristics make BNNTs a promising candidate to use in the modification of FRP composites. Moreover, recent advances in larger-scale BNNT synthesis,25 along with the availability of high-quality commercial BNNTs at the g-to-kg scale,26,27 have opened new horizons for their use in composites. BNNTs have been applied to a variety of polymer matrices and demonstrated property enhancements.21,22 Despite several studies on fracture toughness of hybrid CNT composites, the current literature contains a very limited number of studies on the performance of a hybrid multiscale composite consisting of a BNNT-infused polymer, and the fracture toughness of these materials has not been comprehensively studied. The combination of glass fiber/BNNT hybrid composite maintains the electrical insulation property (unlike for CNT hybrid composites), while enhancing other properties of the composite. The incorporation of BNNTs at the plies interface in a GFRP composite through dipping of a prepreg into the solvent with dispersed BNNTs is reported.28 A through-thickness thermal conductivity increased as high as 1.2 W m–1 K–1, relative to 0.3 W m–1 K–1 for the GFRP without BNNTs, was achieved at a BNNT content of only ∼0.01 wt %.28 Our previous studies29−31 demonstrated the promising enhancements in the mechanical performance of BNNT-modified polymers and hybrid GFRP composites, including in the elastic modulus of the epoxy resin and the dynamic performance (e.g., impact energy absorption) of the modified resin and hybrid composite. The shear performance of hybrid GFRP composites was also enhanced by the incorporation of BNNTs into the epoxy matrix.31,32 Shi et al.,33 Han et al.,34 and Zhang et al.35 mainly focused on the thermal properties of GF hybrid composites at a significantly higher BNNT content. The literature on glass fiber/epoxy/BNNT, including the abovementioned studies, demonstrate impressive performance of these materials; however, a comprehensive study of fracture toughness enhancement by incorporating low-content BNNT in glass fiber/epoxy composites has not been previously reported.
Mode I fracture toughness studies on nanomodified polymers and hybrid composites primarily investigate the effect of CNTs within carbon fiber-reinforced polymers. A comprehensive review of the previous studies is provided by Chaudhry et al.,36 where GIc enhancements from −51 to +98% are reported for various types of nanotubes (single-walled CNTs (SWCNTs) and multiwalled CNTs (MWCNTs), with and without functionalization) and at different nanotube contents (ranging from 0.01 to 50 wt %). Williams et al.37 incorporated oxygen plasma-treated MWCNTs in unidirectional e-glass prepreg and achieved an up to 22% increase in mode I fracture toughness. Tugrul Seyhan et al.38 studied mode I fracture toughness of e-glass noncrimp fabric hybrid composites containing 0.1 wt % of amino-functionalized MWCNTs in the matrix and observed no significant improvement in mode I interlaminar fracture toughness values. Recently, Domun et al. reported improved fracture toughness39 for fiberglass laminates containing a combination of BNNTs or BN nanosheets with nanocarbon fillers. A survey of the open literature revealed that reports of mode II fracture toughness are far less frequent compared to their mode I counterparts. Similar to mode I results, mode II fracture toughness studies on nanocomposites of hybrid composites primarily employ CNTs as the nanoreinforcement, where enhancements of up to 75% for the MWCNT/UD-carbon/epoxy combination is reported.40 Mode II fracture toughness of e-glass noncrimp fabric hybrid composites containing 0.1 wt % of amino-functionalized MWCNTs was studied, and 8% improvement compared to the baseline composite was reported.38 Davis and Whelan41 used a spraying technique to deposit a content of 0.5 wt % functionalized CNTs on the mid-plane carbon fabric, and then tested the specimens under four-point bending loads. The results showed a 23% increase in the average initiation and 27% increase in the average propagation of mode II fracture toughness compared to the case with neat resin.
High fracture toughness is critical for performance in aerospace applications, where a longer service life of a potentially cracked structure guarantees the integrity of the structure until damage (i.e., crack) is captured in the next inspection and maintenance check. Furthermore, ballistic applications also profit from enhanced fracture toughness, when a damaged structure maintains its integrity and can perform for longer use before it is discarded. Following our previous study of the effect of BNNTs on the shear performance of hybrid GFRPs, in this work, the effect of adding BNNTs to the matrix of GFRP composites on the fracture toughness performance of the hybrid composites is investigated. In this work, a comprehensive study of fracture toughness of glass fiber–epoxy/BNNT hybrid composites is performed. Such advanced performance characterization is particularly relevant for composite applications that are subjected to delamination and crack propagation as it speaks directly to their major limitation in unstable crack growth and helps enhance the structure’s life cycle during inspection intervals. Although many studies address basic mechanical characterization of nanomodifed polymers, such as tensile strength, stiffness, and strength, there remain relatively few studies on this type of performance assessment, mostly for CNT-modified FRP, making this work both a specific advancement in the case of BNNTs and also relevant to the broader case of multiscale, hybrid composites. Glass fiber–epoxy/BNNT hybrid composites were fabricated using wet layup, and the structural properties of hybrid composites were investigated. Fracture toughness tests in mode I and mode II loading conditions were the main focus, while three-point bending, modified Charpy and dynamic mechanical analysis (DMA) tests were also carried out to investigate other mechanical properties of the BNNT hybrid GFRPs while trying to enhance the fracture toughness performance. The current study provides an insight into how the addition of BNNTs affects the performance of glass/epoxy composite structures under complex loading, proving that BNNTs offer effective reinforcement in combination with complimentary functional properties to CNT/nanocarbon-reinforced GFRP.
2. Materials and Methods
2.1. Raw Materials
The GF fabric was a plain weave S-glass fabric: S-2 fiberglass fabric style #4522 with the areal density of 125 g/m2, from ACP Composites (Livermore, CA). The polymer, a toughened epoxy resin (SC-15), was obtained from Kaneka Aerospace (Benicia, CA).
The BNNTs were produced in-house using the hydrogen-assisted BNNT synthesis (HABS) method,25 which uses an induction thermal plasma torch system to produce highly crystalline, small diameter (∼5 nm), few-walled BNNTs from an hBN feedstock, as reported in detail elsewhere.26 Raw BNNT material produced using this method is commercially available as “BNNT-R” from Tekna Advanced Materials (Sherbrooke, Canada) and is estimated to be ∼50% BNNTs by weight, with elemental boron and hBN-like impurities. All BNNTs used in the present work were purified to remove the elemental boron impurity and homogenized by shredding/grinding into a fluff-like form. The purification is a gas-phase process, reported in detail elsewhere,42 which involves the reaction of the boron impurity with a flow of chlorine and argon gases at high temperatures (ca. 750–1050 °C). Boron reacts with chlorine to form gaseous BCl3, which is removed in the flow and neutralized. Chlorine also etches defective BN structures. For the BNNTs in this study, this process was performed at 750 °C.
Following the removal of the boron impurity by gas-phase purification, the purified BNNT material becomes white in color and consists of a combination of BNNTs with hBN and hBN-like derivatives/impurities. This material was further purified using a solvent washing method consisting of dispersing 8 g of material in 4 L of solvent (hot water or acetone, as described below) with bath sonication, followed by gravity filtration through a 20-micron stainless steel mesh. The filtrate, which was initially a milky color and was discarded after each wash, became progressively clearer with an increasing number of solvent wash cycles. The filtrate was immediately redispersed, while it was still wet with the solvent, to minimize BNNT agglomeration. A total of 1 water wash (with 15 min sonication), followed by 6 acetone washes (30 min sonication), was employed. After the final filtration, the filtrand was put into water, frozen, and freeze-dried to collect a fluff-like BNNT purified using chlorine treatment and solvent washing denoted here as BNNT-washed (BNNT-W). Seven batches of solvent washing were homogenized, providing >9 g BNNT-W for the present panels and related work. The yield of BNNTs recovered following the 1 + 6 washing steps described above was typically 15–20%. The schematic of the BNNT preparation and purification steps is shown in Figure 1. Purification removes the boron impurity with a minimal effect on the BNNTs using the conditions employed here.42 It was shown that higher-temperature purification would have removed more defective BNNTs. Hence, it is reasonable to state that based on the scanning electron microscopy (SEM) analysis of the powder material and composites, considering the mild sonication (bath for short periods at a time), solvent washing removes additional impurities and is not expected to damage the crystalline quality of the BNNTs. The quality of the purified BNNT materials was also evaluated using a recently reported methodology, and it was demonstrated that the gas phase plus the solvent-washed process results in higher purity of BNNTs43 (for further details, please refer to the Supporting Information). However, drying the solvent-washed material (even using freeze-drying was done here) may lead to nanotube agglomerations. Two types of purified BNNTs in this work are shown in the Supporting Information.
Figure 1.

Schematic of the experimental procedure including BNNT purification (resulting in BN and BN2 batches in Table 1), solvent wash (producing BNW batch in Table 1), incorporation into SC-15 epoxy part A, mixing with the hardener resulting in nanomodified epoxy, laminate manufacturing, specimen preparation, and mechanical testing.
2.2. Nanocomposite Preparation
BNNTs were added to an epoxy resin (SC-15 epoxy, Part A) by solvent-free planetary mixing (Thinky ARV-310) using three rounds of 2 min mixing at 2000 rpm. The resin was allowed to cool between mixing intervals. In contrast to our earlier work,22,30,32,44 a vacuum mixer was employed. The change to vacuum mixing avoided mixing of air into the resin, which was evident in vacuum degassing steps in our earlier work. The effectiveness of this approach was verified qualitatively by performing additional degassing under vacuum, where no bubbling was observed for samples mixed under vacuum. The BNNT-modified SC-15 Part A component was then mixed with the hardener (SC-15 Part B) using the same mixing steps (1 × 2 min under vacuum). Nanocomposite epoxies were mixed such that 1 and 2 wt % BNNTs would be achieved, following subsequent mixing with SC-15 Part B at the mixing ratio of 30 parts hardener (Part B) to 100 parts resin (Part A). These steps are schematically shown in Figure 1.
2.3. Laminate Production
Flat composite panels with dimensions of 34.3 cm × 34.3 cm (13.5 in × 13.5 in) were manufactured from S-glass plain weave plies with neat and BNNT-modified SC-15 epoxy using a wet layup technique. Four different combinations of resin/nanoreinforcements were used to produce panels with four different BNNT contents according to Table 1.
Table 1. Specimen Identification and Definition.
| sample name | definition |
|---|---|
| BL-Xa | baseline, no BNNT content |
| BN-X | BNNT content: 1 wt % purified-1 (gas phase) |
| BNW-X | BNNT content: 1 wt % purified-2 (gas phase + solvent-washed) |
| BN2-X | BNNT content: 2 wt % purified-1 (gas phase) |
The “X” is a number that indicates the specimen number in a batch cut from each sample panel.
Each panel contained 30 plies of the woven glass fabric where liquid resin (neat or modified) was applied and spread between every two plies. The laminate production step is shown in Figure 1, and the details of the laminate production procedure are explained in the Supporting Information. A similar approach was followed for all four types of panels, and a slight color difference of clean white for neat resin panel and milky white for the panels with BNNTs (regardless of the content) was noticed.
2.4. Specimen Preparation
A series of experimental investigations was performed on the manufactured panels. These tests included three-point bending, modified Charpy, DMA, and mode I and mode II fracture toughness tests. American Society for Testing and Materials (ASTM) and International Organization for Standardization (ISO) testing procedures45−49 were followed in this work. The specimen preparation step (Figure 1) is described in detail in the Supporting Information.
2.5. Test Procedures and Coupon Preparation
2.5.1. General Mechanical Assessment
Three-point bending, modified Charpy (using a drop tower), and DMA were chosen as mechanical assessment tests because of a broader use of these methods in the literature including for comparison to our previous work. Tests were repeated using at least five specimens of the same material/manufacturing combination. Three-point bending tests were performed in accordance with the ASTM D790 standard,45 while for modified Charpy impact tests, a drop weight tower testing machine was used, and the ISO 179-146 and ISO 179-247 standards were followed. A series of DMA tests was performed using the cantilever module of a TA Instrument Q800. For further method information, please refer to the Supporting Information.
2.5.2. Mode I Fracture Toughness
Mode I fracture toughness measurements were performed in accordance with the ASTM D5528 standard.48 The objective in this test was to obtain the delamination resistance (normalized energy) as a function of the crack length. The preexisting crack in the DCB specimens was simulated by the 12.7 μm thick nonadhesive Teflon insert on the midplane that acted as the delamination initiator (Figure 2) (see the Supporting Information for more detail). Mode I opening forces were applied through the piano hinges bonded to the specimen. Figure 1a shows the specimen under loading, where the end of preexisting crack and the beginning of the crack propagation region are distinguishable in the specimen.
Figure 2.
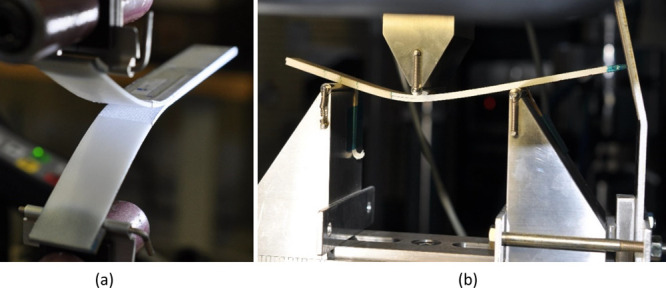
(a) A DCB specimen under mode I opening loads. The preexisting crack created by the nonadhesive Teflon film is distinguishable from the propagated crack because of different surface roughness and light reflection. (b) Mode II fracture toughness test setup.
2.5.3. Mode II Fracture Toughness
Mode II interlaminar fracture toughness, GIIc, was measured from end-notched flexure (ENF) based on the ASTM D7905 standard.49 At least five specimens were tested from each batch. Because, unlike mode I test, the delamination growth for the ENF test is not stable, the mode II standard proposes two fracture toughness values to be obtained: (1) when the crack growth starts from the artificial crack created by inserting the Teflon film (nonprecracked or NPC) and (2) when the crack growth starts from a natural preexisting crack (precracked or PC). The NPC fracture toughness value is determined by loading the pristine specimen in which the crack tip is where the Teflon film ends, whereas the PC fracture toughness test is performed after the NPC test and when the initial crack has already grown and stopped to create a natural crack tip. For further details of the procedure, please refer to the Supporting Information. For very tough composites, large deformations at the onset of delamination growth may affect the accuracy of the ENF test; however, the objective in this work is to compare similar types of specimens, and the comparison is still valid. Dean et al.50 showed that for typical unidirectional glass and carbon-reinforced unidirectional composites, the combined effects of friction and geometric nonlinearities influenced the accuracy of the recommended approach by approximately 3% or less for toughness of up to 2.10 kJ/m2. Figure 1b shows the mode II test setup (details in the Supporting Information).
2.6. Microscopy Studies
A field emission scanning electron microscope (Hitachi S4800) was used for microscopy. No coating was applied to the specimens. Fracture surfaces were exposed (for cases where the two halves of the specimen were still attached) by applying small tension to separate the halves.
3. Results and Discussion
The mechanical performance of composites is strongly influenced by the fiber volume fraction. In order to correctly associate any changes in the mechanical properties of the BNNT-modified specimens to the incorporation of BNNTs, it was first verified that all laminates have similar fiber volume fractions. Table 2 lists the fiber volume fraction for each batch of specimens. It is noted that the range of fiber volume fraction for these panels is within 5% of a laminate volume (between 38 and 43% for BN2 and BL specimens, respectively), with the baseline panel showing the highest value. Therefore, when any enhancement in the mechanical performance of BNNT-modified specimens is observed, it is clear that it cannot be due to different GF contents (specifically for fiber dominant properties) compared to the baseline specimens. The slightly lower GF content of the BN2 panel could be a factor in the performance of that panel.
Table 2. Summary of Preliminary Test Results.
| test | parameter | BL: baseline | BN: 1 wt % purified (gas phase) BNNTs | BNW: 1 wt % purified (gas phase + solvent-washed) BNNT | BN2: 2 wt % purified (gas phase) BNNT |
|---|---|---|---|---|---|
| fiber volume fraction (%) | 43 ± 1 | 40 ± 2 | 41 ± 1 | 38 ± 1 | |
| 3 point bending | elastic modulus (GPa) | 23.1 ± 0.6 | 24.3 ± 0.9 | 22.5 ± 0.8 | 21.2 ± 0.8 |
| max. stress (MPa) | 478 ± 15 | 602 ± 36 | 517 ± 27 | 520 ± 35 | |
| strain (%) | 2.7 ± 0.2 | 2.8 ± 0.1 | 3.0 ± 0.2 | 2.8 ± 0.2 | |
| DMA | glass transition temperature (°C) | 92 ± 0.1 | 94.1 ± 0.3 | 95.5 ± 0.6 | 97 ± 0.3 |
| modified Charpy | fracture energy per area (kJ/m2) | 112 ± 12 | 132 ± 18 | 122 ± 5 | 114 ± 11 |
| failure stress [max. stress in outside fibers due to bending], (MPa) | 657 ± 44 | 719 ± 79 | 678 ± 17 | 635 ± 34 | |
| max stress [max load/area], (MPa) | 23.3 ± 1.8 | 27.2 ± 2.5 | 24.9 ± 1.0 | 25.4 ± 1.0 |
3.1. General Mechanical Assessment
The main objective of the current work was to evaluate the effect of different purified BNNT materials and BNNT content on fracture toughness properties of the laminates. Therefore, as the first step, general mechanical performance of the manufactured composites was evaluated to ensure the results are comparable with our previous report,32 and no compromise is made to other mechanical properties.
3.1.1. Three-Point Bending
The three-point bending test provides the flexural modulus and strength of the material. The specimens, for all different batches of the material, were loaded to complete failure, and it was noticed that the failed specimens did not completely break into two separate pieces. Close observation showed a slight discoloration close to the failed region for specimens containing BNNTs. This phenomenon, perhaps due to plastic deformation of the resin at the failed region, is clearly seen across the thickness and the width of the failed region and indicates interactions between BNNTs and the epoxy matrix probably affecting the matrix microstructure during deformation. The summary of the elastic modulus results for all batches of materials is shown in Table 3. The specimens containing BNNTs showed a slight increase in modulus (5% improvement for BN specimens with a Student’s T-test confidence of greater than 98.5%) compared to the BL samples. The maximum stress and failure strain of the tested samples are also listed in the table. Clear enhancement for BN samples, containing 1 wt % of BNNTs purified by the gas-phase process only, is noticeable, where a 26% improvement in the maximum stress, compared to the BL, was achieved. For a detailed analysis of the data, please refer to the Supporting Information.
Table 3. Opening Mode I Fracture Toughness Summary Based on the Modified Beam Theory (MBT) Technique.
| BL: baseline | BN: 1 wt % purified (boron-removed) BNNTs | BNW: 1 wt % purified (boron-removed + solvent-washed) BNNT | BN2: 2 wt % purified (boron-removed) BNNT | |
|---|---|---|---|---|
| mode I fracture toughness (J/m2) | 1180 ± 130 | 1280 ± 70 | 1220 ± 90 | 1020 ± 170 |
| average improvement (%) | 9 | 4 | –13 | |
| standard deviation reduction (%) | 48 | 32 | –33 |
3.1.2. Modified Charpy
Modified Charpy determines the flexural strength and modulus of the material under dynamic loading. It also provides the amount of fracture energy absorption under flexural loads. Two indications of the panel strength are listed in Table 3: the maximum stress and failure stress. The maximum stress is the index of the average stress over the entire cross-section and is obtained by dividing the maximum force by the cross-sectional area. The failure stress is the highest flexural stress induced to the top and bottom faces of the specimen (compressive and tensile, respectively) due to the bending. These two strength indicators show a similar trend between the baseline and the BNNT-modified specimens. The strength of the baseline specimens is lower than that of all BNNT-modified specimens (except failure stress for BN2) and the strongest samples in both strength indicators are the BN specimens with 17 and 9% increase in maximum stress and failure stress compared to the baseline, respectively. The Student’s T-test put a confidence of 93% for failure stress enhancement. The energy absorption capability of the materials is evaluated by studying the fracture energy per area for the modified Charpy tests. The fracture energy is calculated based on the area under the force–displacement curve and then divided by the cross-sectional area of the specimen to demonstrate an average index of energy absorption for the specimen. A similar trend to that observed for the strength results was also noticed for the fracture energy per area, wherein the baseline has the lowest value and BN specimens show an 18% improvement compared to the baseline. A previous study by our team showed the same trend and similar improvements in modified Charpy test results.32 Similar results were reported previously, where the incorporation of CNTs led to enhanced energy absorption properties.51−53 Detailed analysis is shown in the Supporting Information.
3.1.3. Dynamic Mechanical Analysis
DMA tests were performed on two specimens from each batch to study the effect of BNNT incorporation on the glass transition temperature. As listed in Table 3, BNNT-modified specimens demonstrated a slightly higher glass transition temperature, and the enhancement increased with increasing the content of BNNTs in the specimen reaching a maximum of 5 °C for specimens with 2 wt % BNNTs in the matrix. Glass transition increase due to the incorporation of BNNTs had been observed in the literature before.31Table 3 summarizes the results of all general mechanical assessments.
Results from the general mechanical characterization indicate that improvements were observed when BNNTs purified using the gas-phase method are incorporated into the epoxy resin at 1 wt % (BN specimens) and that increasing the BNNT content to 2 wt % actually had a detrimental effect in some cases. Interestingly, BNW specimens containing BNNTs that were subjected to solvent wash steps after gas-phase purification, to improve the material purity, did not lead to further improvements. BNW specimens showed a higher content of nanotubes (refer to the SEM images of different BNNT types in the Supporting Information), as expected from the solvent wash purification step. However, after recovering the BNNT material from the solvent, even using freeze-drying, the material does not disperse as well by planetary mixing in comparison to the BNNTs purified only by the gas-phase process.
3.2. Fracture Toughness
3.2.1. Mode I
The mode I interlaminar fracture toughness, GIc, of the manufactured laminate was measured from the DCB specimens according to the ASTM D5528 standard.48 The standard defines three methods to calculate the mode I fracture toughness, GIc: the modified beam theory (MBT), the compliance calibration (CC), and the modified compliance calibration (MCC) method. There is no preference among these as it is stated that the difference between the outcomes is no more than 3.1%, but the MBT provided the most conservative results for more than 80% of the tested specimens.48 Large displacement effects are also corrected according to the procedure recommended in the standard.
The entire set of mode I fracture toughness results for all samples within the four batches of material is shown and discussed in the Supporting Information. For all material types tested here, the mode I fracture toughness remained relatively constant with changes in the crack length. Furthermore, as it can be seen in Table 3, BN specimens had less scattered data compared to baseline tests. Decreasing the scatter band and enhancing the repeatability of the tests are extremely important for applications where a lower margin of safety is desirable. Therefore, specimens containing BNNTs may have potential applications in aerospace industry where a smaller allowable deviation can lead to weight saving. Compared to the baseline, the BN samples show a 9% improvement in mode I fracture results. These results fall within the wide range of the previous literature on nanoreinforced GFRP.36 Moreover, the BN samples show a 48% smaller uncertainty band compared to the baseline specimens. The BN2 batch shows a reduction in the results; however, the higher uncertainty band (−33%) compared to the baseline is due to one single specimen, as shown in the Supporting Information. The repeatability and the band of uncertainty in the result can be due to inconsistencies in specimen manufacturing, such as deviation from target ply orientation in plies immediately adjacent to the crack.
3.2.2. Mode II
According to the standard, the mode II interlaminar fracture toughness, GIIc, is defined as the critical value of strain energy rate, G, for delamination growth because of an in-plane shear force (or displacement) oriented perpendicular to the delamination front. The nonadhesive insert placed in the midplane acts as a delamination initiator.
The results of mode II fracture toughness measurements are presented in Figure 3. The three sets of data indicate the NPC, PC, and the average of NPC and PC results for each batch of material. A quick overview of the results reveals the baseline specimens to have the lowest and the BN set to have the highest mode II fracture toughness values. The BN specimens show an improvement of up to 43% over the baseline. All other specimens with BNNTs present some level of property enhancement. However, unlike the mode I fracture toughness results, the mode II results show a higher variability (less repeatability and consistency) for the samples containing BNNTs when compared to the baseline. Mode II fracture toughness enhancement reports in the literature are limited in number and cover a range of various nanoreinforcements and matrices, as summarized in the Section 1. An achievement of 43% improvement in mode II fracture toughness compared to the case with neat resin surpasses the previous reports in the literature, where a range of up to 27% improvement (achieved with CNTs) was reported.41 This could, perhaps, be a case of BNNTs integrating more favorably with the matrix compared to CNT reinforcements. Differences in purities and functionalization methods to improve integration make a direct comparison difficult; however, the 43% improvement reported here has been among the highest mode II fracture toughness enhancements that are achieved by incorporating nanotubes into a polymer system.
Figure 3.

Mode II fracture toughness results summary.
In agreement with general mechanical characterization, the largest improvements are observed for specimens containing 1 wt % of BNNTs purified using the gas-phase method. Probably, this material purified and incorporated into the epoxy matrix using solvent-free methods lead to a better dispersion compared to a higher-purity material, at equivalent wt %, that was subjected to solvent washes to remove BN impurities. Solvent processing and subsequent drying of nanomaterials commonly lead to a material that is more difficult to redisperse/debundle, especially when no chemical functionalization is employed, and could lead to deteriorated dispersion when using the solvent-free planetary mixing method employed for the integration of BNNTs into the epoxy matrix. No further improvements were achieved by increasing the BNNT content of gas-phase-purified BNNTs, perhaps, due to a similarly unfavorable effect in BNNT dispersion above 1 wt % loading.
A comparison between the mode I and mode II fracture toughness improvements achieved in this study shows a more effective enhancement for mode II (43% improvement for mode II vs 9% for mode I). One possible explanation can be attributed to the panels’ manufacturing technique. During the hand layup fabrication, the impregnation and dispersion of resin between adjacent plies perhaps favors the in-plane alignment of nanotubes, which is more beneficial for mode II fracture toughness (as opposite to mode I, where out-of-plane alignment of nanotube is desirable). A similar trend was observed in previous studies on CNT-modified specimens in mode I and mode II fracture toughness.54 In our previous study,32 it was found that the characterization tests that involve a normal mode of crack opening (as opposed to the shear mode) often show a higher improvement, which possibly could be due to the bridging effect as the primary reinforcing mechanism of the nanotubes. Therefore, it was expected to have more effective reinforcement in mode I tests. In fact, at the microlevel, mode II tests result in crack opening modes that are mostly normal, and the bridging phenomenon is extremely effective in such cases. This phenomenon is demonstrated in the following Section 3.3.
3.3. Microscopy Studies
Extensive SEM analysis performed on the specimens and the morphology of the fracture surface, along with other crucial parameters such as BNNT dispersion, void content, and fiber alignment, were studied.
3.3.1. Three-Point Bending
Three-point bending specimens were tested under quasistatic flexural load, and the specimens mainly failed at the utmost distance from the neutral axis of the beam. The general morphology of the fracture surface is provided in the Supporting Information. Closer views of the fiber failure for a BL specimen are shown in Figure 4a. A similar fiber failure mode is observed for specimens with BNNTs. The bending nature of the failure results in tensile and compression failure modes at different sections of the specimen. The sections in Figure 4a show the features of a compression failure. The quasistatic compression in this case demonstrates microbuckling failure in the fibers where a two-phase damage region on each fiber is observed. Each fiber cross-section is divided into two sections by a line called the “chop-mark,”4 which indicates the neutral axis of the fiber under bending (fiber buckling). The tensile-failure section of each fiber exhibits riverlines originating from the farthest part of the fiber from the chop-mark (maximum tensile due to bending). The neutral axis of the adjacent fibers (i.e., the chop-marks) are usually aligned, which is indicative of the domino effect in a region where bundles of fibers collapse in the same direction, leading to successive rows of buckled fibers.55 As it is observed from the figure, no difference in fiber failure mode was observed between baseline and BNNT specimens. The dispersion of BNNTs throughout the epoxy matrix was also studied for different samples. Qualitative study of the BNNT dispersion in the matrix was performed by close to 500 SEM images taken from randomly chosen locations of fabricated samples. Fairly uniform contents of BNNTs were observed for BN and BN2 specimens, but it was noticed that the BNW specimens present more BNNT agglomerations. Figure 4b shows the BNNT dispersion on an example of BNW specimens. An agglomeration of BNNTs on the right side of the image is noticeable alongside individual BNNTs in the epoxy. The SEM analysis of different samples showed that the gas-phase purification results in a material that is more easily dispersed. The presence of agglomerations may be the cause for less-effective reinforcement observed for the BNW batch or perhaps due to the agglomerations formed during the drying stage of the solvent-washed material, even using freeze-drying as it was done here. The spherical objects (or their imprints) visible in this figure are the toughening agents included in the neat epoxy, which were added by the epoxy manufacturer to enhance the epoxy properties and, therefore, are present in all specimens.
Figure 4.

(a) Compressive fiber failure at the fracture surface of the baseline specimen. (b) BNNT dispersion at the fracture surface of a BNW specimen.
3.3.2. Modified Charpy
The modified Charpy specimens are loaded under flexural loading, similar to three-point bending, but the difference is in the dynamic nature of this test. The epoxy resin failure mechanism between axial direction fibers of a BN2 specimens is shown in Figure 5a. A typical morphology of epoxy failure with a 0°/90° interface (between adjacent plies) under flexural loading is observed for all specimens, regardless of the BNNT content. The rough fracture surface of the resin indicates the relatively high toughness of the epoxy.55 The fiber failure mode under modified Charpy loading is shown in Figure 5b. The image demonstrates an example of tensile failure (unlike Figure 4a), where similar flexural loading is applied (but dynamically in this case) to specimens but the tensile failure is shown. Tensile failure in fibers typically shows the “mirror, mist, and hackle” morphology, where the smooth mirror-like section indicates the initiation site and the gradually rougher surface away from the initiation site is characterized by the mist and hackled morphology.55 The BNNT dispersion within the modified Charpy specimens was also analyzed, and, similar to what was observed before, BNW specimens showed signs of agglomeration as well as dispersed individual nanotubes throughout the epoxy matrix.
Figure 5.

(a) Resin failure between longitudinal fibers for a BN2 specimen. (b) Tensile fiber failure at the fracture surface of a BNW sample.
3.3.3. Mode I Fracture Toughness
The failure surface of fracture toughness specimens, either mode I or mode II, is relatively large, and, in order to image the surface, a smaller section of the specimens (roughly 2.54 cm × 2.54 cm) was cut from the specimens. The in-plane nature of the fracture, as opposed to through-thickness fracture for three-point bending and modified Charpy, generally results in interply failure, where the fracture occurs between two adjacent layers of the GF reinforcements. The fracture morphology of the epoxy matrix between axial fibers (along the direction of the specimen) of the mode I for a BN fracture toughness specimen is shown in Figure 6a. It is noticed that the riverlines in the epoxy matrix originate from the fiber/matrix interface and continue at a slight angle from the perpendicular direction. These riverlines are perpendicular to the crack propagation direction and indicate the gradual nature of the crack growth. No difference between samples with and without BNNTs was observed in this regard. The epoxy fracture between transverse fibers (perpendicular to the axial direction of the specimen) for BL and BN2 specimens is illustrated in Figure 6b. Similar to the axial direction, there was no clear difference between samples with and without BNNTs for the transverse direction. In this image, scarps are clearly visible. Scarps are formed in the matrix where multiple fractures, initiated along the crack front, begin to propagate on slightly different planes and subsequently converge onto one plane, creating a sharp step parallel to the fiber direction (the left side of Figure 6b). The image captures dominant riverlines parallel to the fiber direction, which is perpendicular to the specimen direction. This again demonstrates the gradual crack propagation, which is a necessary criterion in the validity of mode I fracture toughness tests.
Figure 6.

(a) Resin fracture surface between fibers parallel to the specimen axis for a BN specimen. (b) Resin fracture surface between fibers perpendicular to the specimen axis for a BL specimen.
Further investigations on the fracture surface revealed regions with some anomalies (not everywhere) in a few neat and nanomodified samples (not all). These anomalies included local voids in some regions and an unusually high content of the toughening spheres (added by the manufacturer to enhance toughness) in some samples, specifically for BN2 samples. This perhaps negatively affected the performance of those samples in those regions and contributed to the increased fluctuation within the data (more details in the Supporting Information). However, even the BN samples, which exhibited the highest mode I fracture toughness among all sample types, displayed degrees of void content in some regions. Achieving the highest fracture toughness despite these local defects indicates the potential of BNNT specimens to reach even higher performance if these voids can be avoided during manufacturing.
3.3.4. Mode II Fracture Toughness
The fracture surface area of the mode II specimens is similar in size to that of the mode I specimens, with the difference that the failure has occurred in the form of in-plane shearing. The patterns of fibers/fiber imprints are also observed in these samples, and no significant difference between the fracture morphology of specimens with and without BNNTS is noticed.
The epoxy fracture surface between longitudinal fibers (i.e., along the axis of the specimen) for a BL specimen is shown in Figure 7a. The image highlights the shear failure pattern of the epoxy matrix, where a left-to-right shear was applied to the observed surface by the opposing (i.e., removed) surface. The signature indication of the shear fracture surface is the formation of cusps, which are clearly visible in this figure. The orientation of the cusps shows the direction of shear force. The size and formation of cusps are affected by the spacing between fibers and factors such as the moisture content and testing temperature. At higher temperatures (or for less brittle polymers), the resin behavior is dominated by plasticity, leading to thicker cusps with greater deformation. This increased size of the cusps indicates a smaller number of such features, which often happens because of higher plasticity of the material.55 This fracture morphology is only observed along the direction of shear specimens and clearly demonstrates the loading condition at the fracture surface. The fracture surface of a mode II baseline specimen between transverse fibers (i.e., perpendicular to the axis of the specimen) is shown in Figure 7b. The riverlines on the epoxy are mostly at a 45° angle because of shear loading. The formation of the riverlines shows the direction of crack growth, indicating the direction of load transfer between adjacent fibers and failure orientation.
Figure 7.

(a) Resin fracture surface between fibers parallel to the specimen axis for BL. (b) Resin fracture surface between fibers perpendicular to the specimen axis for BL.
The morphology of BNNTs on the fractured epoxy between longitudinal fibers is shown in Figure 8 (the transverse image is included in Supporting Information). Each micrograph is marked by a red rectangle that indicates the area of the next image in the series, at a higher magnification. The fractured epoxy between longitudinal fibers, Figure 8, shows a gradual peeling morphology, where the shear stress and the process of cusp formation and coalescence have led to a fracture surface with normal-to-the-surface components. In this case, the fracture also involves surfaces that are perpendicular to the actual fracture plane, and the nanotubes are pulled out of the epoxy in a parallel direction to the fracture plane; however, they are perpendicular to the surface from which they are pulled out. In this case, the BNNTs reinforce the epoxy in a bridging configuration (in a crack opening) and enhance the mode II fracture toughness. This configuration of reinforcement is believed to have the most influence in enhancing the mode II fracture toughness, as our previous studies32 have demonstrated that the nanotubes are more effective in normal loading, as opposed to pure shear conditions. The nanotube reinforcement in the epoxy between transverse fibers, included in Supporting Information, shows a different reinforcing mechanism wherein the fracture surface is more of a pure shear nature. In this case, the nanotubes are pulled out of the epoxy in a parallel direction to the fracture surface (as opposed to the normal direction shown in Figure 8), and the pulled-out nanotubes lay flat on the surface. The effectiveness of nanotubes in this direction is not as large as in the normal direction, but this section of the mode II specimen also contributes to the overall mode II fracture toughness enhancement for specimens with BNNTs.
Figure 8.

Micrographs of a BN2 specimen with BNNTs between fibers that are parallel to the axis of the specimen. From the top left to the bottom right, each picture is a subsection of the previous one, indicated by the red rectangle.
4. Conclusions
The current work primarily investigated the fracture toughness of boron nitride nanotube/epoxy as the matrix material to manufacture glass fiber-reinforced composites. A hand layup technique was employed to manufacture the panels, and general mechanical assessment tests of three-point bending and modified Charpy were carried out to compare the results with our previous BNNT hybrid GFRP panels.32 DMA also determined the glass transition temperature for the materials, indicating a mild increase in a few degrees when adding BNNTs. However, the main focus of this study was on mode I and mode II fracture toughness, where adding 1 wt % purified BNNTs, purified using a solvent-free, gas-phase process, resulted in 9% enhancement in mode I fracture toughness and reduced the standard deviation (improved test repeatability) by 48%, compared to the baseline samples with a neat epoxy matrix. The same batch of material also showed up to 43% improvement in mode II fracture toughness, when compared to the baseline. A possible justification of different success rates in mode I and mode II fracture toughness may be found in the nature of the layup fabrication manufacture. In this process, impregnation and dispersion of resin between adjacent plies result in a more favorable in-plane alignment of nanotubes, which is more beneficial for mode II fracture toughness. Specimens with a content of 1 wt % purified BNNTs provided superior reinforcement to cases with 2 wt % of the same BNNT filler or a 1 wt % content of higher-purity BNNTs obtained after a subsequent solvent washing step. Higher agglomeration was observed in imaging of samples containing solvent-washed material, which indicates that more effective dispersion of the initial purified material (obtained from a gas-phase process not involving liquid dispersion) is responsible for greater reinforcement. Hence, this approach offers a scalable and more environmentally friendly approach to produce BNNT-reinforced FRPs. Extensive microscopy analysis on all specimens also revealed the effectiveness of BNNTs in a peeling mode that happened because of the formation of cusps in mode II fracture toughness specimens, hence enhancing mode II properties significantly. These results are in agreement with the previous findings32 that demonstrated BNNTs are effective in mechanical performance enhancement under a peeling load, which happens due to the effective bridging reinforcement mechanism in cracks. The improved fracture toughness and mechanical performance across several other tests, which resulted from the incorporation of a modest content of BNNTs, show that BNNTs are an effective reinforcement for interlaminar properties in hybrid FRP composites. While such composites with BNNTs remain at an early stage of development compared to those with CNTs, the ease of integration of gas-phase-purified BNNTs into the hybrid GFRP, using only planetary mixing, coupled with the complimentary functional properties of BNNTs relative to nanocarbon fillers, offers strong motivation for further development and application of BNNT-enhanced GFRP.
Acknowledgments
The authors thank co-op students Ilhan Mandsaurwala and Hao Li for support during panel manufacturing and data analysis. Furthermore, the assistance of Olga Naboka in scanning electron microscopy and NRC’s Nanotube Production Facility (D. Ruth, M. Plunkett, S. Walker, K. S. Kim, and C.T. Kingston) for supplying the BNNT material is greatly appreciated. The financial support of the Security Material Technologies Program (SMT) is also acknowledged.
Supporting Information Available
The Supporting Information is available free of charge at https://pubs.acs.org/doi/10.1021/acsomega.2c00365.
Details on raw material, laminate production, and specimen preparation for different types of tests. Test procedures and ample discussion on raw data and analysis to generate the results presented in the main text. Extensive microscopy analysis, with several micrographs and evidence of the claims and explanations (PDF)
The authors declare no competing financial interest.
Supplementary Material
References
- Sathishkumar T. P.; Satheeshkumar S.; Naveen J. Glass fiber-reinforced polymer composites – a review. J. Reinf. Plast. Compos. 2014, 33, 1258–1275. 10.1177/0731684414530790. [DOI] [Google Scholar]
- Bai J., Advanced Fibre-Reinforced Polymer (FRP) Composites for Structural Applications; Woodhead Publishing Limited: Cambridge, UK, 2013. [Google Scholar]
- Nkurunziza G.; Debaiky A.; Cousin P.; Benmokrane B. Durability of GFRP bars: a critical review of the literature. Prog. Struct. Eng. Mater. 2005, 7, 194–209. 10.1002/pse.205. [DOI] [Google Scholar]
- Miracle D. B.; Donaldson S. L.; Henry S. D., ASM Handbook, Volume 21: Composites; ASM International: 2001. [Google Scholar]
- Soderholm K.-J. Review of the fracture toughness approach. Dent. Mater. 2010, 26, e63–e77. 10.1016/j.dental.2009.11.151. [DOI] [PubMed] [Google Scholar]
- Srivastava V. K.; Gries T.; Veit D.; Quadflieg T.; Mohr B.; Kolloch M. Effect of nanomaterial on mode I and mode II interlaminar fracture toughness of woven carbon fabric reinforced polymer composites. Eng. Fract. Mech. 2017, 180, 73–86. 10.1016/j.engfracmech.2017.05.030. [DOI] [Google Scholar]
- Tangthana-umrung K.; Mahmood H.; Zhang X.; Gresil M. Enhancing interlaminar fracture toughness of woven carbon fibre/epoxy composites with engineering thermoplastic and carbon-based nanomaterials. Compos. Struct. 2022, 282, 115073 10.1016/j.compstruct.2021.115073. [DOI] [Google Scholar]
- Nasuha N.; Azmi A. I.; Tan C. L. A review on mode-I interlaminar fracture toughness of fibre reinforced composites. J. Phys.: Conf. Ser. 2017, 908, 012024 10.1088/1742-6596/908/1/012024. [DOI] [Google Scholar]
- May M.; Channammagari H.; Hahn P. High-rate mode II fracture toughness testing of polymer matrix composites – A review. Compos. A: Appl. Sci. Manuf. 2020, 137, 106019 10.1016/j.compositesa.2020.106019. [DOI] [Google Scholar]
- Siddique A.; Abid S.; Shafiq F.; Nawab Y.; Wang H.; Shi B.; Saleemi S.; Sun B. Mode I fracture toughness of fiber-reinforced polymer composites: A review. J. Ind. Text. 2021, 50, 1165–1192. 10.1177/1528083719858767. [DOI] [Google Scholar]
- Domun N.; Hadavinia H.; Zhang T.; Sainsbury T.; Liaghat G. H.; Vahid S. Improving the fracture toughness and the strength of epoxy using nanomaterials-a review of the current status. Nanoscale 2015, 7, 10294–10329. 10.1039/C5NR01354B. [DOI] [PubMed] [Google Scholar]
- Tang Y.; Ye L.; Zhang Z.; Friedrich K. Interlaminar fracture toughness and CAI strength of fibre-reinforced composites with nanoparticles – A review. Compos. Sci. Technol. 2013, 86, 26–37. 10.1016/j.compscitech.2013.06.021. [DOI] [Google Scholar]
- Gibson R. F. A review of recent research on mechanics of multifunctional composite materials and structures. Compos. Struct. 2010, 92, 2793–2810. 10.1016/j.compstruct.2010.05.003. [DOI] [Google Scholar]
- Bekyarova E.; Thostenson E. T.; Yu A.; Kim H.; Gao J.; Tang J.; Hahn H. T.; Chou T. W.; Itkis M. E.; Haddon R. C. Multiscale Carbon Nanotube–Carbon Fiber Reinforcement for Advanced Epoxy Composites. Langmuir 2007, 23, 3970–3974. 10.1021/la062743p. [DOI] [PubMed] [Google Scholar]
- Fan Z.; Santare M. H.; Advani S. G. Interlaminar shear strength of glass fiber reinforced epoxy composites enhanced with multi-walled carbon nanotubes. Compos. A: Appl. Sci. Manuf. 2008, 39, 540–554. 10.1016/j.compositesa.2007.11.013. [DOI] [Google Scholar]
- Qian H.; Greenhalgh E. S.; Shaffer M. S. P.; Bismarck A. Carbon nanotube-based hierarchical composites: a review. J. Mater. Chem. 2010, 20, 4751–4762. 10.1039/c000041h. [DOI] [Google Scholar]
- Gojny F. H.; Wichmann M. H. G.; Fiedler B.; Bauhofer W.; Schulte K. Influence of nano-modification on the mechanical and electrical properties of conventional fibre-reinforced composites. Compos. A: Appl. Sci. Manuf. 2005, 36, 1525–1535. 10.1016/j.compositesa.2005.02.007. [DOI] [Google Scholar]
- Díez-Pascual A. M.; Ashrafi B.; Naffakh M.; González-Domínguez J. M.; Johnston A.; Simard B.; Martínez M. T.; Gómez-Fatou M. A. Influence of carbon nanotubes on the thermal, electrical and mechanical properties of poly(ether ketone)/glass fiber laminates. Carbon 2011, 49, 2817–2833. 10.1016/j.carbon.2011.03.011. [DOI] [Google Scholar]
- Ashrafi B.; Díez-Pascual A. M.; Johnson L.; Genest M.; Hind S.; Martinez-Rubi Y.; González-Domínguez J. M.; Teresa Martínez M.; Simard B.; Gómez-Fatou M. A.; Johnston A. Processing and properties of PEEK/glass fiber laminates: Effect of addition of single-walled carbon nanotubes. Compos. A: Appl. Sci. Manuf. 2012, 43, 1267–1279. 10.1016/j.compositesa.2012.02.022. [DOI] [Google Scholar]
- Zhang H.; Bilotti E.; Peijs T. The use of carbon nanotubes for damage sensing and structural health monitoring in laminated composites: a review. NANO 2015, 1, 167–184. 10.1080/20550324.2015.1113639. [DOI] [Google Scholar]
- Meng W.; Huang Y.; Fu Y.; Wang Z.; Zhi C. Polymer composites of boron nitride nanotubes and nanosheets. J. Mater. Chem. C 2014, 2, 10049–10061. 10.1039/C4TC01998A. [DOI] [Google Scholar]
- Jakubinek M. B.; Ashrafi B.; Martinez-Rubi Y.; Guan J.; Rahmat M.; Kim K. S.; Dénommée S.; Kingston C. T.; Simard B., Boron Nitride Nanotube Composites and Applications. In Nanotube Superfiber Materials (Second Edition), Schulz M. J.; Shanov V.; Yin Z.; Cahay M., Eds.; William Andrew Publishing: 2019; 91–111. [Google Scholar]
- Kim K. S.; Jakubinek M. B.; Martinez-Rubi Y.; Ashrafi B.; Guan J.; O’Neill K.; Plunkett M.; Hrdina A.; Lin S.; Dénommée S.; Kingston C.; Simard B. Polymer nanocomposites from free-standing, macroscopic boron nitride nanotube assemblies. RSC Adv. 2015, 5, 41186–41192. 10.1039/C5RA02988K. [DOI] [Google Scholar]
- Chen X.; Zhang L.; Park C.; Fay C. C.; Wang X.; Ke C. Mechanical strength of boron nitride nanotube-polymer interfaces. Appl. Phys. Lett. 2015, 107, 253105. 10.1063/1.4936755. [DOI] [Google Scholar]
- Kim K. S.; Kim M. J.; Park C.; Fay C. C.; Chu S.-H.; Kingston C. T.; Simard B. Scalable manufacturing of boron nitride nanotubes and their assemblies: a review. Semicond. Sci. Technol. 2017, 32, 013003 10.1088/0268-1242/32/1/013003. [DOI] [Google Scholar]
- Kim K. S.; Kingston C. T.; Hrdina A.; Jakubinek M. B.; Guan J.; Plunkett M.; Simard B. Hydrogen-Catalyzed, Pilot-Scale Production of Small-Diameter Boron Nitride Nanotubes and Their Macroscopic Assemblies. ACS Nano 2014, 8, 6211–6220. 10.1021/nn501661p. [DOI] [PubMed] [Google Scholar]
- www.tekna.com.
- Takizawa Y.; Chung D. D. L. Through-thickness thermal conduction in glass fiber polymer–matrix composites and its enhancement by composite modification. J. Mater. Sci. 2016, 51, 3463–3480. 10.1007/s10853-015-9665-x. [DOI] [Google Scholar]
- Ashrafi B.; Jakubinek M. B.; Martinez-Rubi Y.; Laqua K.; Homenick C. M.; Guan J.; Rahmat M.; Djokic D.; Kim K.-S.; Kingston C.; Simard B.; Yousefpour A.; Johnston A., Multifunctional Fiber Reinforced Polymer Composites Using Carbon and Boron Nitride Nanotubes. In International Aeronautical Conference; Cancun, Mexico, 2016. [Google Scholar]
- Rahmat M.; Naftel A.; Ashrafi B.; Jakubinek M. B.; Martinez-Rubi Y.; Simard B. Dynamic mechanical characterization of boron nitride nanotube—epoxy nanocomposites. Polym. Compos. 2019, 40, 2119–2131. 10.1002/pc.24995. [DOI] [Google Scholar]
- Jakubinek M. B.; Ashrafi B.; Martinez-Rubi Y.; Rahmat M.; Yourdkhani M.; Kim K. S.; Laqua K.; Yousefpour A.; Simard B. Nanoreinforced epoxy and adhesive joints incorporating boron nitride nanotubes. Int. J. Adhes. Adhes. 2018, 84, 194–201. 10.1016/j.ijadhadh.2018.03.008. [DOI] [Google Scholar]
- Rahmat M.; Ashrafi B.; Naftel A.; Djokic D.; Martinez-Rubi Y.; Jakubinek M. B.; Simard B. Enhanced shear performance of hybrid glass fiber–epoxy laminates modified with boron nitride nanotubes. ACS Appl. Nano Mater. 2018, 1, 2709–2717. 10.1021/acsanm.8b00413. [DOI] [Google Scholar]
- Shi X.; Zhang R.; Ruan K.; Ma T.; Guo Y.; Gu J. Improvement of thermal conductivities and simulation model for glass fabrics reinforced epoxy laminated composites via introducing hetero-structured BNN-30@BNNS fillers. J. Mater. Sci. Technol. 2021, 82, 239–249. 10.1016/j.jmst.2021.01.018. [DOI] [Google Scholar]
- Han Y.; Shi X.; Yang X.; Guo Y.; Zhang J.; Kong J.; Gu J. Enhanced thermal conductivities of epoxy nanocomposites via incorporating in-situ fabricated hetero-structured SiC-BNNS fillers. Compos. Sci. Technol. 2020, 187, 107944 10.1016/j.compscitech.2019.107944. [DOI] [Google Scholar]
- Zhang R.-H.; Shi X.-T.; Tang L.; Liu Z.; Zhang J.-L.; Guo Y.-Q.; Gu J.-W. Thermally Conductive and Insulating Epoxy Composites by Synchronously Incorporating Si-sol Functionalized Glass Fibers and Boron Nitride Fillers. Chin. J. Polym. Sci. 2020, 38, 730–739. 10.1007/s10118-020-2391-0. [DOI] [Google Scholar]
- Chaudhry M. S.; Czekanski A.; Zhu Z. H. Characterization of carbon nanotube enhanced interlaminar fracture toughness of woven carbon fiber reinforced polymer composites. Int. J. Mech. Sci. 2017, 131-132, 480–489. 10.1016/j.ijmecsci.2017.06.016. [DOI] [Google Scholar]
- Williams J.; Graddage N.; Rahatekar S. Effects of plasma modified carbon nanotube interlaminar coating on crack propagation in glass epoxy composites. Compos. A: Appl. Sci. Manuf. 2013, 54, 173–181. 10.1016/j.compositesa.2013.07.018. [DOI] [Google Scholar]
- Tugrul Seyhan A.; Tanoglu M.; Schulte K. Mode I and mode II fracture toughness of E-glass non-crimp fabric/carbon nanotube (CNT) modified polymer based composites. Eng. Fract. Mech. 2008, 75, 5151–5162. 10.1016/j.engfracmech.2008.08.003. [DOI] [Google Scholar]
- Domun N.; Paton K. R.; Blackman B. R. K.; Kaboglu C.; Vahid S.; Zhang T.; Dear J. P.; Kinloch A. J.; Hadavinia H. On the extent of fracture toughness transfer from 1D/2D nanomodified epoxy matrices to glass fibre composites. J. Mater. Sci. 2020, 55, 4717–4733. 10.1007/s10853-019-04340-8. [DOI] [Google Scholar]
- Karapappas P.; Vavouliotis A.; Tsotra P.; Kostopoulos V.; Paipetis A. Enhanced fracture properties of carbon reinforced composites by the addition of multi-wall carbon nanotubes. J. Compos. Mater. 2009, 43, 977–985. 10.1177/0021998308097735. [DOI] [Google Scholar]
- Davis D. C.; Whelan B. D. An experimental study of interlaminar shear fracture toughness of a nanotube reinforced composite. Compos. B Eng. 2011, 42, 105–116. 10.1016/j.compositesb.2010.06.001. [DOI] [Google Scholar]
- Cho H.; Walker S.; Plunkett M.; Ruth D.; Iannitto R.; Martinez Rubi Y.; Kim K. S.; Homenick C. M.; Brinkmann A.; Couillard M.; Dénommée S.; Guan J.; Jakubinek M. B.; Jakubek Z. J.; Kingston C. T.; Simard B. Scalable gas-phase purification of boron nitride nanotubes by Selective chlorine etching. Chem. Mater. 2020, 32, 3911–3921. 10.1021/acs.chemmater.0c00144. [DOI] [Google Scholar]
- Martinez Rubi Y.; Jakubek Z. J.; Chen M.; Zou S.; Simard B. Quality Assessment of Bulk Boron Nitride Nanotubes for Advancing Research, Commercial, and Industrial Applications. ACS Appl. Nano Mater. 2019, 2, 2054–2063. 10.1021/acsanm.9b00057. [DOI] [Google Scholar]
- Ashrafi B.; Jakubinek M. B.; Martinez-Rubi Y.; Rahmat M.; Djokic D.; Laqua K.; Park D.; Kim K.-S.; Simard B.; Yousefpour A. Multifunctional fiber reinforced polymer composites using carbon and boron nitride nanotubes. Acta Astronaut. 2017, 141, 57–63. 10.1016/j.actaastro.2017.09.023. [DOI] [Google Scholar]
- ASTM , D790–17, Standard Test Methods for Flexural Properties of Unreinforced and Reinforced Plastics and Electrical Insulating Materials; ASTM International: West Conshohocken, 2017. [Google Scholar]
- ISO , 179–1: Plastics — Determination of Charpy impact properties — Part 1: Non-instrumented impact test; International Organization for Standardization: Geneva, Switzerland, 2010. [Google Scholar]
- ISO , 179–2: Plastics — Determination of Charpy impact properties — Part 2: Instrumented impact test; International Organization for Standardization: 2020. [Google Scholar]
- ASTM , D5528–13, Standard Test Method for Mode I Interlaminar Fracture Toughness of Unidirectional Fiber-Reinforced Polymer Matrix Composites; ASTM International: West Conshohocken, PA, 2013. [Google Scholar]
- ASTM , D7905/D7905M-19e1, Standard Test Method for Determination of the Mode II Interlaminar Fracture Toughness of Unidirectional Fiber-Reinforced Polymer Matrix Composites; ASTM International: West Conshohocken, PA, 2019. [Google Scholar]
- Dean S. W.; Davidson B. D.; Sun X. Geometry and data reduction recommendations for a standardized end notched flexure test for unidirectional composites. J. Astm Int. 2006, 3, 100285 10.1520/JAI100285. [DOI] [Google Scholar]
- Tehrani M.; Boroujeni A. Y.; Hartman T. B.; Haugh T. P.; Case S. W.; Al-Haik M. S. Mechanical characterization and impact damage assessment of a woven carbon fiber reinforced carbon nanotube–epoxy composite. Compos. Sci. Technol. 2013, 75, 42–48. 10.1016/j.compscitech.2012.12.005. [DOI] [Google Scholar]
- Sharma S. P.; Lakkad S. C. Impact behavior and fractographic study of carbon nanotubes grafted carbon fiber-reinforced epoxy matrix multi-scale hybrid composites. Compos. A: Appl. Sci. Manuf. 2015, 69, 124–131. 10.1016/j.compositesa.2014.11.005. [DOI] [Google Scholar]
- Rahmanian S.; Thean K. S.; Suraya A. R.; Shazed M. A.; Mohd Salleh M. A.; Yusoff H. M. Carbon and glass hierarchical fibers: Influence of carbon nanotubes on tensile, flexural and impact properties of short fiber reinforced composites. Mater. Des. 2013, 43, 10–16. 10.1016/j.matdes.2012.06.025. [DOI] [Google Scholar]
- Ashrafi B.; Guan J.; Mirjalili V.; Zhang Y.; Chun L.; Hubert P.; Simard B.; Kingston C. T.; Bourne O.; Johnston A. Enhancement of mechanical performance of epoxy/carbon fiber laminate composites using single-walled carbon nanotubes. Compos. Sci. Technol. 2011, 71, 1569–1578. 10.1016/j.compscitech.2011.06.015. [DOI] [Google Scholar]
- Greenhalgh E. S., Failure analysis and fractography of polymer composites; Woodhead Publishing Limited: Oxford, 2009; 595. [Google Scholar]
Associated Data
This section collects any data citations, data availability statements, or supplementary materials included in this article.