

Abstract
Pore types and pore structure parameters are the important factors affecting the storage capacity of a shale oil reservoir. Pore morphology and mineralogical composition of shales have diverse effects on the upgrading of various phases of shale oil. To interpret the formation and distribution of different pore types and their structure parameters in the lacustrine calcareous shale, a combination of polarizing microscopy, X-ray diffraction, total organic carbon (TOC), field-emission scanning electron microscopy, and low-pressure nitrogen adsorption experiments were conducted on the Es3x shale of the Eocene Shahejie Formation in the Zhanhua Depression. The interpretations regarding pore types, pore structure parameters, and pore size distribution indicate that the pore morphology and pore size distribution in the lacustrine shale are very complicated and demonstrate strong heterogenic behavior. Inorganic pores (interparticle pores, intraparticle pores, intercrystalline pores, dissolution pores, and microfractures) are the most commonly distributed pore types in the studied shale. However, organic matter pores are poorly developed due to the lower thermal maturity of the Es3x shale. The Brunauer–Emmett–Teller specific surface and pore volume range from 0.026 to 1.282 m2/g (average 0.697 m2/g) and 0.003 to 0.008 cm3/g (average 0.005 cm3/g), respectively. The shape of the pores varies from slit-like to narrow slit. Different minerals develop different types of pores with various sizes extending from micropores (<2 nm), mesopores (2–50 nm), to macropores (>50 nm). The relationship between mineral components and pore parameters indicates that the carbonate minerals act as the main contributors to the formation and distribution of different pore types in the studied shale. Pore volume and the pore specific surface area did not show a good relationship with mineral composition and TOC due to disordered pores, but pore size shows a good relationship with mineral composition and TOC of the Es3x shale. The whole pore system description showed that the mesopores and macropores are abundantly distributed and are the main contributors to the pore system in the Es3x shale. A comprehensive understanding of the formation mechanism and structural features of various sized pores in a variety of different minerals can provide a good tool for the exploration and development of shale oil reservoirs.
1. Introduction
The information regarding pores and pore structure parameters is critical to understand fluid flows and storage mechanisms in shales.1 Pore characteristics of shales are very complex due to huge differences in pores sizes (micropores, mesopores, and macropores), microstructures, mineralogy, total organic carbon (TOC), and the complicated geological history of each system.2−8 Due to the increasing demand for oil and gas worldwide, unconventional hydrocarbon resources, especially shale oil and gas have gained significant attention. They have been extensively studied worldwide as a self-sourced and reservoir rock after successful exploration and production of shale oil and gas resources in North America and China.9−12 Currently, marine shale has been widely investigated and it has a relatively well-developed theory, methodology, and technology.1,13,14 However, the studies on lacustrine shale are still in the earlier stages and seek much attention.15,16 There is a wide range of dissimilarities between the lacustrine shale and marine shale in terms of their depositional environment, mineralogy, source rock features, and behavior of reservoir pore spaces.17−19 The characteristics and distribution of reservoir pore spaces in the lacustrine shale are quite different from marine shale.13,14,17−19 The mineral composition played an important in pore development in both types of shale. In the marine shale, the amount of organic matter (OM) pores is higher due to higher thermal maturities of OM, whereas lacustrine shale has few OM pores due to lower thermal maturities.1,4,11,13,14 Therefore, inorganic pores act as the main contributor to the total pore system in the lacustrine shale. The size, shape, and texture of pores in lacustrine and marine shales vary dramatically due to different mineralogical and OM properties. These differences suggest that the lacustrine shale needs further investigations in the development of its exploration and development theories to improve its methods and technology with more significance.
Shale oil resource systems not only produce oil but can also accumulate and store oil.20 Therefore, the reservoir evaluation and description can be beneficial for recovering reserves and estimating effective progress for shale oil. The studies on the reservoir properties of the lacustrine calcareous shale in the Zhanhua Depression are still in the earlier stages, whereas considerable research has been focused on the evaluation of source rock. Nevertheless, the information regarding characteristics of various forms of pore structures and their controlling aspects plays a vital role in accessing the research and development of shale oil and gas.21 Controlling factors of different types of pores have been studied by many researchers worldwide.11,13,22,23 The storage capacity of shale is largely influenced by various pore types and their properties.8,24−26
The Es3x shale is the lacustrine calcareous shale and it is widely distributed throughout the Bohai Bay Basin, east coast of China. Most of the current studies on the Es3x shale have been focused on the geochemical constraints and reservoir features, with very few studies on reservoirs’ microscopic pore structure features.27 In this research work, various advanced methods [TOC, X-ray diffraction (XRD), field-emission scanning electron microscopy (FE-SEM), and low-pressure N2 adsorption] have been used to study the formation and distribution mechanism of different pore types in the lacustrine shale. The current study is aims to: (1) characterize the different pores types (inorganic and organic pores), pore structure, and pore size distribution (PSD) (micro-, meso-, and macropores), (2) study the effect of lithofacies on pore types, (3) study the effect of different minerals on the development of different types of pores, and (4) study the implications for storage capacity of shale oil reservoir of the Es3x shale in the Zhanhua Depression, Bohai Bay Basin. The results derived from this study can help in understanding the formation mechanism and distribution of various pore types in the lacustrine shale in the Zhanhua Depression and other similar basins worldwide.
2. Geological Background
The Bohai Bay Basin is located on the east coast of China and is a Cenozoic rift basin with an area of approximately 200,000 km2 (Figure 1). From northeast to southwest, the Bohai Bay Basin is divided into seven sub-basins namely, the Linqing, Jizhong, Jiyang, Changwei, Huanghua, Bozhong, and Liaohe sub-basins (Figure 1).28−30 Amongst these sub-basins, Jiyang represents a typical rift basin of Mesozoic to Cenozoic age in the southeast of the Bohai Bay Basin.29 The Jiyang sub-basin comprises four secondary depressions: Dongying, Huimen, Zhanhua, and Chezhen, which are separated by the Chengdong Uplift, Chenjiazhuang Uplift, and Yihezhuang Uplift (Figure 1). The Zhanhua Depression is located in the northeastern part of the Jiyang sub-basin and represents the area of interest for this study. It has an area of approximately 2800 km2 and is positioned north and northwest of Chenjiazhuang uplifts, south of Yihezhuang and Chengdong uplifts, and west of the Gudao Uplift. The Zhanhua Depression is bounded by the Yidong fault and Chengnan fault on the north, Shaojia fault and Yinan fault on the west, and Gubei fault and Gunan fault on the eastern sides (Figure 1).31
Figure 1.

Location map and geology of the research area in the Zhanhua Depression, Bohai Bay Basin, eastern China (adapted and modified from Khan et al.32).
The Zhanhua Depression consists of a thick stratigraphic pile of Cenozoic strata which unconformably overlies the Mesozoic strata (Figure 2).33,34 The Cenozoic strata consist of the Paleogene and Neogene systems. The Paleogene system comprises Kongdian, Shahejie, and Dongying formations, and the Neogene system includes the Guantao and Minghuazhen formations (Figure 2). The Eocene–Oligocene Shahejie Formation is widely distributed in the Zhanhua Depression.33 The Shahejie Formation is composed of alternating layers of sandstones, siltstones, oil shales, mudstones, and evaporites deposited in fluvial–lacustrine–deltaic depositional settings (Figure 2). Shahejie Formation is divided into four members including Es1 (Es1s and Es1x), Es2 (Es2s and Es2x), Es3 (Es3s, Es3z, and Es3x), and Es4 (Es4s and Es4x).31,35
Figure 2.

(A) Stratigraphic column of the study area and the red box is showing our study interval (Es3x shale). (B) γ-ray and SP log against the lithology of the Es3x shale in the Zhanhua Depression, Bohai Bay Basin (adapted and modified from Khan et al.32).
The Es3x shale (lower third part of the Es3 member) of the Shahejie Formation in the Zhanhua Depression represents our study horizon. The Es3x shale is composed of a thick sequence (300–500 m) of organic-rich shale, dark-gray mudstone, and calcareous mudstone deposited in the lacustrine depositional environment (Figure 2).36−38
3. Results and Discussion
3.1. Mineral Characteristics and TOC Contents
The mineral composition and TOC content play an important role to classify shale lithofacies and characterization of shale reservoirs. The mineral composition (XRD analysis) and TOC contents (carbon and sulfur analysis) of 29 bulk samples from the Es3x shale member of the Eocene Shahejie Formation from well Luo-69 in the Zhanhua Depression are shown in Table 1. The vertical distribution of mineral constituents and TOC content in the Es3x shale is highly variable and complex. The Es3x shale is primarily composed of calcareous minerals, siliceous minerals, clay minerals, and pyrite (Figure 3).
Table 1. Total Mineralogical Composition (wt %) and TOC Content (wt %) of the Es3x Shale in the Zhanhua Depressiona.
| mineralogical composition (wt %) |
|||||||
|---|---|---|---|---|---|---|---|
| depth (m) | Q | Cal | Dol | Arag | Py | Clay | TOC (%) |
| 2937.8 | 12.2 | 6.8 | 3.8 | 49 | 11.2 | 17 | 6.56 |
| 2960 | 12.8 | 52.6 | 9.3 | 0 | 2.4 | 22.9 | 3.42 |
| 2990.05 | 9.6 | 53.7 | 6.9 | 0 | 3.4 | 26.4 | 2.36 |
| 2994.3 | 13 | 31.3 | 6.9 | 0 | 5.8 | 43 | 3.07 |
| 3012.2 | 11.9 | 53.6 | 5.4 | 0 | 4.9 | 24.2 | 4.41 |
| 3013.2 | 10.4 | 58.1 | 6.5 | 0 | 3.5 | 21.5 | 3.21 |
| 3016.3 | 14.3 | 37.3 | 6.9 | 0 | 5.4 | 36.1 | 3.79 |
| 3018.1 | 12.1 | 50.5 | 8.3 | 0 | 2.1 | 27 | 4.64 |
| 3023.8 | 14.2 | 38.4 | 10.1 | 0 | 5 | 32.3 | 5.19 |
| 3024.1 | 9.7 | 63.5 | 8.7 | 0 | 2.6 | 15.5 | 4.94 |
| 3033.5 | 11.9 | 42 | 10.6 | 0 | 3.1 | 32.4 | 5.83 |
| 3036.2 | 9.1 | 54.8 | 9.7 | 0 | 3.7 | 22.7 | 4.96 |
| 3038 | 12.1 | 52.6 | 8.5 | 0 | 3.1 | 23.7 | 3.99 |
| 3045.3 | 9.9 | 57.6 | 10.2 | 0 | 3.5 | 18.8 | 3.76 |
| 3052.5 | 8.2 | 64.7 | 7.8 | 0 | 1.4 | 17.9 | 6.44 |
| 3054.3 | 5.3 | 67.8 | 8.9 | 0 | 2.2 | 15.8 | 5.68 |
| 3056.43 | 8.9 | 67.6 | 6.1 | 0 | 2.6 | 14.8 | 5.7 |
| 3056.95 | 7.8 | 70.4 | 5.9 | 0 | 1.6 | 14.3 | 5.46 |
| 3063 | 8.4 | 71.2 | 4.2 | 0 | 1.8 | 14.4 | 1.83 |
| 3064.3 | 7.7 | 85.1 | 5.7 | 0 | 1.5 | 0 | 1.28 |
| 3067.8 | 5.6 | 75.6 | 8.2 | 0 | 2 | 8.6 | 2 |
| 3070.9 | 11.2 | 60.3 | 9.1 | 0 | 1.5 | 17.9 | 1.73 |
| 3090.7 | 6.7 | 65.8 | 7.3 | 0 | 1.9 | 18.3 | 1.65 |
| 3098.96 | 6.3 | 63.7 | 8.3 | 0 | 2.1 | 19.6 | 1.12 |
| 3100.68 | 9.5 | 62.6 | 7.6 | 0 | 2.2 | 18.1 | 1.62 |
| 3105.2 | 11.5 | 62.4 | 4.3 | 0 | 3.6 | 18 | 1.7 |
| 3110.2 | 7.5 | 73.5 | 3.1 | 0 | 1.4 | 14.5 | 1.27 |
| 3119 | 9 | 64.2 | 4.2 | 0 | 3.5 | 19.1 | 1.36 |
| 3140.25 | 11.9 | 50.1 | 2.7 | 0 | 4.5 | 29.4 | 1.53 |
Note: Q = quartz, F = K-feldspar, Cal = calcite, Dol = dolomite, Arag = aragonite, and Py = pyrite.
Figure 3.

Total mineralogical composition (wt %) and TOC content (wt %) of the Eocene shale in the Zhanhua Depression.
In the Es3x shale, siliceous minerals are primarily composed of quartz and feldspar. The concentration of quartz ranges from 5.3 to 14.3% with an average concentration of 9.6%. Quartz is mainly clay to a silt-sized mineral that is distributed randomly throughout the shale interval (Figure 4A). Only a few grains of K-feldspar are also observed in the study area (Figure 4B). Calcareous minerals in the Es3x shale mainly comprise of calcite and dolomite that are frequently observed in thin sections and also confirmed from XRD analysis. Only one thin section in our study area shows the concentration of aragonite mineral (49 wt %). The percentage of calcite minerals in the Es3x shale ranges from 6.8 to 85.1% (average 57%). Calcite is present in three forms in the Es3x shale, that is micrite, sparite (recrystallized calcite), and fibrous calcite (Figure 4C,D). Throughout the Es3x shale, the abundance of micrite is higher than sparite and calcite. The abundance of dolomite in the Es3x shale varies from 2.7 to 10.6% with an average of 7%. Dolomite mineral has a clear rhombohedral shape and is distributed throughout in the study well (Figure 4F). The clay mineral in the Es3x shale varies from 0 to 43% with an average quantity of 20%. The concentration of clay mineral contents decreases from top to bottom of the study interval. The content of pyrite in the study interval varies from 1.3 to 11.2% with an average of 3.3%. Pyrite framboids are abundantly distributed in the Es3x shale (Figure 4A,E). The concentration of pyrite decreases from the top to the bottom in the studied shale samples. Few mica flakes are also observed in thin sections (Figure 4F). The Es3x shale is manifested by high TOC content, which ranges from 1.12 to 6.56 wt % with an average concentration of 3.49 wt % (Table 1). The TOC content in the Es3x shale decreases with increasing burial depth and increasing calcite content. The relation of TOC content is directly proportional with quartz and is inversely proportional with calcite with increasing burial depth.
Figure 4.

Photomicrographs showing the characteristics of different minerals in the Es3x shale. (A) Quartz and pyrite, Well = Luo-69. (B) Feldspar, micrite and algae, Well = Luo-69. (C) Micrite calcite and sparry calcite, Well = Luo-69. (D) Recrystallized calcite and clay laminae, Well = Luo-69. (E) FE-SEM photomicrograph showing calcite and pyrite framboids distribution, Well = Luo-69. (F) Mica and dolomite, Well = Luo-69.
3.2. Classification of Shale Lithofacies
Shale lithofacies have been established based on TOC contents, mineralogy, and sedimentary structures. A total of six different categories of shale lithofacies have been formalized in the study area, that is organic-rich laminated clay-bearing aragonitic shale (LF1), organic-rich non-laminated clay-bearing calcareous shale (LF2), organic-fair non-laminated calcite-bearing argillaceous shale (LF3), organic-rich laminated clay-bearing calcareous shale (LF4), organic-poor laminated clay-bearing calcareous shale (LF5), and organic-poor laminated quartz-bearing calcareous shale (LF6) (Figures 5 and6).
Figure 5.
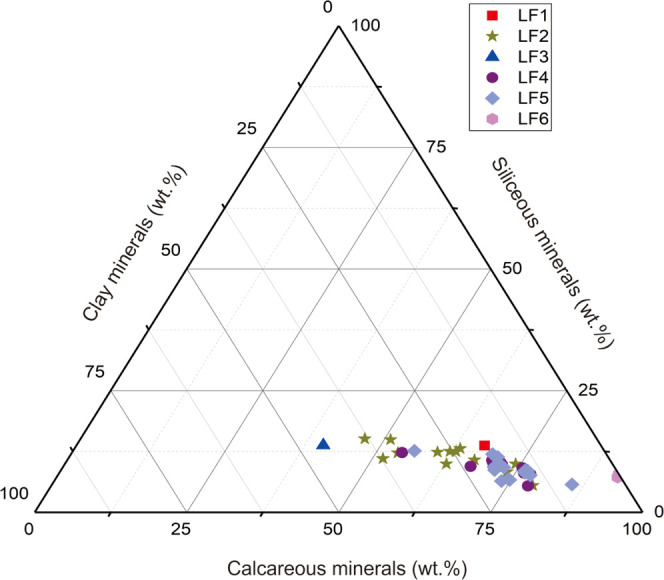
Ternary diagram showing the classification of the Es3x shale lithofacies (based on XRD analysis) from the well Luo-69 in the Zhanhua Depression, Bohai Bay Basin.
Figure 6.

Lithological and sedimentological characteristics of the Es3x shale lithofacies by thin-section analysis from the well Luo-69 in the Zhanhua Depression, Bohai Bay Basin.
3.3. Characteristics of Pore Types and Microfractures Based on FE-SEM Analysis
Numerous classifications of pores in shale formations have been proposed by various authors worldwide to give a vivid illustration regarding different pore types in shales. Loucks et al.11 divided the shale pores into intraparticle pores (IntraP pores), interparticle pores (InterP pores), and OM pores. Huang et al.39 classified the shale pores into inorganic mineral pores, OM pores, and microfractures. The Es3x shale comprises inorganic pores (InterP pores, IntraP pores, intercrystalline pores, and dissolution pores), OM pores, and microfractures.
3.3.1. Inorganic Pores
3.3.1.1. InterP Pores
InterP pores denote the types of pores that are formed among shale minerals or debris particles. The mineralogy of the Es3x shale in the Zhanhua Depression mainly comprises of quartz, calcite, dolomite, and clay minerals (Table 1). Under a field-emission electron microscope, the InterP pores are mainly developed among all these above minerals (Figure 7A,B). The arrangement of InterP pores in the study area is irregular with diverse morphology, primarily in linear, slit, and triangular shapes. The PSD is chiefly a micron size scale and is mostly present along the grain rims. Overall, the connectivity is relatively good in these pores, which can give good hydrocarbon flow channels because these pores are formed due to the anti-consolidation behavior of carbonate and silicate minerals resulting from directional alignment and accumulation of these minerals. This type of directional alignment enhances the connectivity between pores and further dissolution activity among these minerals also increases pore connectivity. These pore types are mostly encountered at the grain’s margins (Figure 7B).
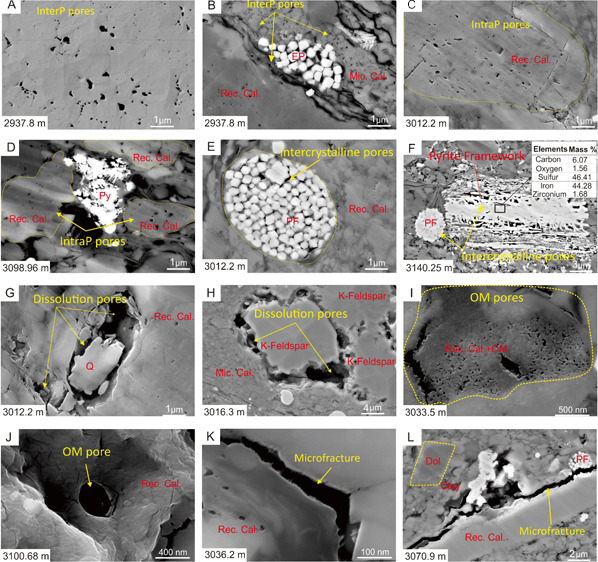
Figure 7.

FE-SEM images show the morphology and characteristics of various types of pores in the Es3x shales in the Zhanhua Depression. (A) Distribution of InterP pores in calcite, Well Luo-69. (B) Distribution of InterP pores at the margins of pyrite, recrystallized calcite grains, and micrite calcite, Well Luo-69. (C) Distribution of IntraP pores in the recrystallized calcite, Well Luo-69. (D) Characteristics and morphology of various shaped IntraP pores within the recrystallized calcite, Well Luo-69. (E,F) Distribution of micron-sized intercrystalline pores in pyrite framboids and pyrite framework having various shapes, Well Luo-69. (G,H) Dissolution occurs at the margins of quartz, recrystallized calcite, and K-feldspar to form dissolution pores, Well Luo-69. (I) Formation and distribution of OM pores in the honeycomb masses within the OM, Well Luo-69. (J) OM pores in the calcite grains, Well Luo-69. (K,L) Microfractures having variable length and width are developed along the rims of different minerals, Well Luo-69. Abbreviations: InterP = interparticle, IntraP = intraparticle, EP = euhedral pyrite, Mic. Cal. = micritic calcite, Rec. Cal. = recrystallized calcite, PF = pyrite framboid, Dol = Dolomite, and OM = organic matter.
3.3.1.2. IntraP Pores
These types of pores are primarily formed in the mineral grains, and their pore size and structure are greatly influenced by these grains (Figure 7C,D). The IntraP pores of the Es3x shale are mostly formed in carbonate minerals such as calcite and dolomite, and most of them are irregular. The quantity of IntraP pores in calcite is higher than dolomite because the content of calcite is very high (average 57 wt %) than dolomite (average 7 wt %) in the Es3x shale. These pores are most probably formed during the transformation of micritic calcite to sparry calcite. These pore types can offer a comparatively large space for hydrocarbon and can establish a pore system with InterP pores to enhance the seepage capacity of shales. These are also in the micron to sub-micron size scale.
3.3.1.3. Intercrystalline Pores
Two different types of pyrite are encountered in the study area during FE-SEM analysis, namely pyrite framboids and euhedral pyrite. Intercrystalline pores are developed in pyrite and recrystallized calcite (Figure 7E,F). Pyrite grains greatly affect the morphology and distribution of intercrystalline pores and these are mostly in triangular and polygonal forms with various pore size ranges. The intercrystalline pore sizes in the pyrite framboids are ranging from 15 to 0.8 μm, whereas in the recrystallized calcite, these are ranging from tens to hundreds of microns with bitumen filling in the pore spaces. The intercrystalline pores that are present along calcite and pyrite are mostly in wedge shapes and slit-like shapes, respectively, and their pore sizes are very small.
3.3.1.4. Dissolution Pores
Unstable minerals such as calcite, dolomite, and clay are developed under the action of subsurface fluid migration and pressure during diagenesis, and the process of dissolution usually transpires during diagenesis, resulting in the formation of dissolution pores. Most of the dissolution pores are formed in carbonate minerals (calcite and dolomite) (Figure 7G). As this shale member is in the mature stage, it has experienced great burial depth and hydrocarbon generation mechanism, therefore these pores are well-developed mainly in calcite and dolomite. At some places, the dissolution pores are formed along the rims of the quartz, feldspar, and clay minerals (Figure 7H). Those dissolution pores that are filled can act as storage spaces and seepage channels for shale hydrocarbon as well. Carbonate minerals are more prone to dissolution than other minerals in the Es3x shale.
3.3.2. OM Pores
OM pores are developed in the OM due to hydrocarbon generation. These pores have a very close relationship with the thermal evolution and hydrocarbon generation of OM. The formation of OM pores is mainly constrained by a combination of thermal maturity and TOC and these OM pores develop when maturity (Ro) surpasses 0.6%.40−42 In the Ordos Basin, numerous OM pores in the lacustrine shale start to develop when vitrinite reflectance is greater than 1.2%.43 The Es3x shale contains a high amount of TOC content extending from 1.12 to 6.56 wt % (average 3.49 wt %) and Ro extending from 0.6 to 0.8% (average 0.7%),16 but the amount of OM pores in the Es3x shale is very low and the reason behind this phenomenon is its low vitrinite reflectivity which is less than 1.2%. Round to oval-shaped OM pores are present within honeycomb masses within the OM (Figure 7I,J). The OM pores usually appeared to be isolated in two dimensions, but they may show connectivity in three dimensions. Not all kinds of OM in the Es3x shale appear to be susceptible to the formation of OM pores because there are some places in the Es3x shale samples characterized by the discontinuous distribution of OM that contain very few pores but most of which lack OM pores completely. As we used gold-coated samples for FE-SEM analysis, some of the smaller-sized pores may be filled with gold particles and the observed quantity of smaller OM pores may miscalculate the genuine numbers. The pores that are present in the OM are mostly nano–micrometer scale in size, and generally have round, oval, slit-like, and crescent irregular shapes (Figure 7I,J).
3.3.3. Microfractures
In the Zhanhua Depression, two different types of microfractures are observed under a field-emission electron microscope and simple polarizing microscope, and these are structural microfractures and bedding microfractures. Structural microfractures are developed due to the tectonic activities, and these are very long and wide. Structural microfractures greatly contribute to the shale diagenesis and reservoir properties in the Zhanhua Depression (Figure 7K). The highly brittle minerals (quartz, calcite, and dolomite) are conducive to the development of structural microfractures. Bedding microfractures, on the other hand, are formed between the lamina and between various laminae, due to the differences in the mechanical characteristics of various laminae and low-stress conditions. These are well-developed in the Es3x shale and are parallel to the bedding planes. Bedding microfractures are seldom filled with a variety of other mineral contents; consequently, they can contribute to horizontal connectivity and storage space for hydrocarbons (Figure 7L).
3.4. Pore Structure and PSD Based on Low-Pressure Nitrogen Adsorption Experiment
The study of pore structure and PSD of the Es3x shale were carried out based on low-pressure nitrogen adsorption (LPN2) analysis. Micropores (<2 nm), mesopores (2–50 nm), and macropores (>50 nm)44 were determined using this analysis. LPN2 adsorption–desorption curves of the Es3x shale samples are shown in Figure 8. These types of LPN2 adsorption–desorption curves from the Es3x shale in the Zhanhua Depression are similar to the type-II isothermal curve and type-H3 to type-H4 loops that are demarcated by IUPAC44 and Sing et al.45 (refer to Figures 15 and 16). There are slight variations in hysteresis loop curves in different lithofacies of the Es3x shale in the Zhanhua Depression, but their isotherms are almost the same (type-II) (Figure 8). The gas adsorption curve was slightly concave when the relative pressure (P/Po) was <0.5, and at this stage, there was the process of gas monolayer adsorption. An inflection stage appeared when the P/Po value was almost 0.5, and this stage showed the discrimination point of gas monolayer and multilayer adsorptions, and the gas adsorption capacity began to increase at this stage. The gas adsorption curve showed strong convexity when P/Po was >0.5, and this strong convexity indicates the presence of mesopores (2–50 nm) and macropores (>50 nm) in the studied shale. At this stage, the process of N2 gas multilayer adsorption occurred and adsorption capacity quickly increased. When the P/Po value was 0.5, there was a sudden declination in the desorption curve which showed the presence of slit-like pores having large pore spaces (Figure 8B,D,E), whreas in some lithofacies, the adsorption–desorption curve is narrow which showed the presence of narrow slit-like pores (Figure 8A,C,F). When the P/Po value was <0.5, the difference between adsorption and desorption curves was very small, and later on, the desorption curve gradually coincided with the adsorption curve as P/Po decreased.
Figure 8.

Nitrogen adsorption–desorption curves of the Es3x shale in the Zhanhua Depression.
Figure 15.

(A,B) Role of OM in the recrystallization of calcite and development of intercrystalline pores.
Figure 16.

Types of physisorption isotherms (modified and reproduced from Medina-Rodriguez and Alvarado45) where “B” is the beginning of the linear middle section of the isotherm which designates the point where monolayer coverage is complete and multilayer adsorption is about to start.
Hysteresis loops of the Es3x shale are interpreted based on the IUPAC classification scheme45 (Figures 15 and 16). The hysteresis loops of LF1 and LF3 are type-H4 loops that show wedge or narrow slit-like pores (Figure 8A,C). In contrast, the hysteresis loops of LF2, LF4, and LF5 are type-H3 loops that depict slit-shaped pores (Figure 8B,D,E). LF6 also represents the type-H4 loop but it has a very narrow adsorption–desorption curve that shows the abundance of macropores having wedge-shaped or narrow slit-like pore shapes (Figure 8F). The adsorption volume of all the lithofacies is approximately the same except for LF5. LF5 has a high adsorption capacity (12 cm3/g) because it has the largest surface area (1.31 m2/g) among all the lithofacies (Table 3).
Table 3. Relationship of Shale Lithofacies with Different Pore Structure Parameters.
| pore structure parameters |
mineral composition
of the Es3x shale (wt %) |
|||||||
|---|---|---|---|---|---|---|---|---|
| lithofacies | BET surface area (m2/g) | pore volume (cm3/g) | BET avg. pore dia. (nm) | quartz | carbonate minerals | clay | pyrite | TOC (%) |
| LF1 | 0.7993 | 0.0056 | 28.3662 | 12.2 | 59.6 | 17 | 11.2 | 6.56 |
| LF2 | 0.76794 | 0.0065 | 29.0723 | 11.9 | 55.6 | 27.86 | 4.28 | 3.70 |
| LF3 | 0.8328 | 0.0058 | 27.9229 | 13 | 38.2 | 43 | 5.8 | 3.07 |
| LF4 | 0.5173 | 0.0045 | 34.8007 | 9.6 | 65.3 | 22.05 | 2.975 | 5 |
| LF5 | 0.7311 | 0.0059 | 30.5762 | 9 | 69.9 | 18.15 | 2.6 | 1.54 |
| LF6 | 0.6511 | 0.0054 | 33.5969 | 7.7 | 90.8 | 0 | 1.5 | 1.28 |
The Brunauer–Emmett–Teller (BET) specific surface area of the Es3x shale samples ranges from 0.026 to 1.282 m2/g with an average of 0.697 m2/g (Table 3). The range of specific surface area varies for each lithofacies. For instance, LF1, LF2, LF3, and LF5 have higher BET specific surface areas than LF4 and LF6. LF1, LF2, LF3, and LF5 have average BET specific surface areas of 0.799, 0.767, 0.832, and 0.731 m2/g, respectively (Table 3), whereas the BET specific surface area of LF4 and LF6 are 0.517 and 0.651 m2/g, respectively (Figure 9 and Table 3). The interpretations deduced from the BET specific surface area indicate the distribution of mesopores in the studied shale (Figure 9).
Figure 9.

BET specific surface area (micro-, meso-, and macropore distribution) of different lithofacies of the Es3x shale in the Zhanhua Depression.
The pore volumes of the mesopores of the Es3x shale are ranging from 0.0038 to 0.0086 cm3/g with an average volume of 0.0058 cm3/g (Table 3). LF1, LF2, LF3, and LF5 have higher average volumes of mesopores, for example 0.0056, 0.0065, 0.0058, and 0.0059 cm3/g, respectively (Figure 10A–C,E). In contrast, LF4, and LF6 have relatively low volumes of mesopores, that is, 0.0045 and 0.0054 cm3/g, respectively (Figure 10D,F and Table 3). The samples from the Es3x shale show the highest macropore volumes (Figure 10). Pore volume of different lithofacies is variable which is given as: LF2 > LF5 > LF3 > LF1 > LF6 > LF4. The PSD is shown in Figure 9 and is examined using the Barrett–Joyner–Halenda model for various lithofacies. Detailed analysis of PSD demonstrates that approximately every sample of the Es3x shale depicts the pore distribution in the mesopore and macropore regions. Nevertheless, lithofacies with high TOC (>3 wt %) and a high amount of clay minerals (LF1-LF4) show the pore distribution in the micropore (except LF1), mesopore, and macropore regions (Figure 9).
Figure 10.

Pore volume (micro-, meso-, and macropore distribution) in different lithofacies of the Es3x shale in the Zhanhua Depression.
3.5. Effect of Lithofacies on Pore Types
The growth of various pore types in the studied shale samples depends on the inorganic minerals and to some extent on the OM dispersal, all of which differ among various lithofacies. The observed pore types in the Es3x shale are inorganic pores, OM pores, microfractures accompanying inorganic minerals, and OM. These types of pores are randomly distributed in the Es3x shale (Figure 7).
FE-SEM analysis of the representative samples of the Es3x shale showed that all the lithofacies (LF1–LF6) are primarily composed of inorganic pores with a limited amount of OM pores. All the lithofacies are composed of carbonate minerals and clay minerals with subordinate quartz and pyrite. InterP pores, IntraP pores, and a few microfractures are randomly scattered (Figure 7). The InterP pores are developed among quartz or carbonate minerals and clay minerals. These pores are formed due to the anti-consolidation behavior of carbonate and siliceous minerals resulting from directional alignment and accumulation of these minerals (Figure 7A,B). Though IntraP pores are commonly present within the carbonate grains (Figure 7C,D), IntraP pores are primarily formed due to the partial dissolution of carbonate minerals (calcite and dolomite) in our study area. IntraP pores have poor connectivity due to their isolated distribution. Both types of pores are widely distributed in all lithofacies (LF1–LF6) of the Es3x shale. Intercrystalline pores are also observed within pyrite framboids and the recrystallized calcite (Figure 7E,F). The size of the pores ranges from 15 to 0.8 μm and is connected within the pyrite framboids. These pores enhance the storage capacity of shale oil and gas. However, the extraction of oil from these pores is very difficult because of their smaller pore size. Dissolution pores are mostly associated with calcite grains (Figure 7G,H). The production of organic acid during hydrocarbon generation and evolution are thought to be responsible for the formation of dissolution pores. Organic acids dissolve the carbonate minerals to produce dissolution pores. The size of the pores varies from micro, meso, and macropores, but mesopores and macropores are abundantly distributed in all lithofacies (LF1–LF6) of the Es3x shale (Figures 9 and 10).
In the Es3x shale, OM pores are not well-developed. Hydrocarbon generation and OM maturation are important aspects in the formation of OM pores.11 During the maturation process, OM pores develop in the OM and OM-rich clay minerals, forming honeycomb masses of OM pores (Figure 7I,J). Thermal maturity and type of OM control the formation of OM pores in thermally mature rocks.11,46 According to the earlier literature,47 type-I to type-II kerogens are more prone to produce OM pores than type-III kerogen. The Es3x shale is composed of type-I to type-II kerogens with high TOC content (average of 3.08 wt %), but few OM pores were detected because the Es3x shale has very low thermal maturity (0.46–0.74%).16 Microfractures in shales provide oil and gas accumulation space and also enhance the migration capability and extraction efficiency following hydraulic fracturing.48,49 Two types of microfractures (structural and bedding microfractures) are frequently encountered in the Es3x shale (Figure 7K,L). These microfractures were possibly triggered by tectonic stress-induced coring, due to the variations and diversity in mechanical properties between different types of minerals, hydration of clay minerals, and hydrocarbon expulsion of OM. These different types of pores and various microfractures are randomly distributed in all lithofacies (LF1–LF6) of the Es3x shale in the Zhanhua Depression (Table 2).
Table 2. Comparison of Different Pore Type Characteristics and Their Relation with Lithofacies Using FE-SEM Analysisa.
| inorganic pores |
|||||||
|---|---|---|---|---|---|---|---|
| pore types | InterP | IntraP | InterC | dissolution | OM pore | microfracture | |
| pore size (μm) | 0.16–3.6 | 0.09–0.33 | 0.09–0.82 | 0.3–2.6 | 0.04–0.63 | 0.14–4.6 | |
| pore shape | linear-slit | irregular | triangular | slit-wedge | oval-slit | irregular | |
| connectivity | good | poor | fair | good | fair | good | |
| contents in lithofacies | LF1 | high | high | moderate | high | moderate | moderate |
| LF2 | high | high | moderate | high | low | high | |
| LF3 | high | high | low | high | low | moderate | |
| LF4 | high | high | low | high | moderate | moderate | |
| LF5 | high | high | low | moderate | low | moderate | |
| LF6 | moderate | Moderate | moderate | moderate | low | low | |
The pore sizes in this table are measured using FE-SEM software and ImagePro Plus software.
3.6. Effect of Lithofacies on Pore Structure Parameters
The critical constraints affected by the Es3x shale lithofacies are pore structure parameters. Based on the quantitative analysis, the mesopores and the macropores control the total BET specific surface area and total pore volumes of this lacustrine shale. The distribution of the micropores is also observed, but their contributions are limited to certain lithofacies. Figures 9B,D and 10B,D show that LF4 contributes some micropore surface area and pore volume followed by LF2 than other lithofacies. It is due to high TOC content (average 5 wt %) and the development of OM pores in LF4. Overall, the mineralogical composition is the main governing factor of the pore structure parameters with very limited influence of TOC content in the Es3x shale. A comprehensive understanding of the structural features of micro-, meso-, and macropores in a variety of different minerals can provide a good tool for the exploration and development of shale oil reservoirs.
3.6.1. Effect of Mineralogical Composition
3.6.1.1. Effect of Quartz
Overall, quartz content accounts for <20 wt % of the shale. The BET specific surface area and pore volume of micro- to mesopores gradually increase with increasing quartz contents.1 Quartz lacks secondary pores formed during diagenesis because of its terrigenous origin. The relationship between quartz and BET specific surface area and pore volume (pore structure parameters) is weakly positive in the Es3x shale (Figure 11A,B). The reason for this weak relationship is the low concentration of mesopores associated with quartz because it can only contribute to developing micropores. Though it can help to expand the mesopore BET specific surface area and pore volume, the overall quartz contribution to the development of mesopores is very low because of its lower concentration in the studied shale (Table 1). The relation of pore size with quartz confirmed that it has a negative contribution to the PSD (Figure 12C).
Figure 11.

Relationship between different mineral compositions with pore structure parameters in the Es3x shale.
Figure 12.

Relationship of pore size (nm) with mineral composition and TOC content.
3.6.1.2. Effect of Carbonate Minerals
The carbonate minerals have a negative relationship with the pore structure parameters of mesopores (Figure 11C,D). According to the previous literature,50 the dissolution of carbonate minerals may have a potential impact on the development of diverse pore types in the shale. During the thermal evolution of OM, carbon dioxide and some organic acids are generated that can dissolve calcite to produce pores (Figure 7G,H).11,51 Nevertheless, only 1–2% dissolution pores were formed during the thermal evolution of OM with full ionization potential and the maximum hydrogen ion (H+) supply.52 Dissolution of calcite can increase only 0.19% porosity of the unit volume of the shale, demonstrating that the increase of porosity through organic acids is very low. However, the dissolution of carbonate minerals can enhance the porosity in the Es3x shale because of its highest content percentage (Figure 7G,H). However, this dissolution can only contribute to the generation of macropores. The reason behind the negative relationship of carbonate minerals with pore structure parameters may be the larger-sized disordered pores associated with them (Figure 11C,D). The larger pores cannot be detected using LPN2 adsorption. The relationship of pore size with carbonate minerals confirmed that it has a positive contribution to the PSD (Figure 12D,E).
3.6.1.3. Effect of Clay Minerals
Clays are the key components in the generation of micro–nano scale pores in shales. Clay minerals generally have large BET specific surface area and pore volume in the shale.24 Clay minerals are usually more susceptible to deformation and compaction with high ductility, ultimately making them more prone to mechanical instability.11 Clay minerals usually have nano-scale pores with multi-stacked structures and decline with a higher degree of compaction.53 In our study area, clay minerals have a very weak positive correlation with pore structure parameters of the mesopores in the lacustrine Es3x shale (Figure 11E,F). There can be two possible explanations for this weak correlation. First, it may be associated with the low content of clay minerals in the Es3x shale, and second, it may be due to the filling of pores during compaction. These reasons are also confirmed by the negative association of pore size with clay minerals in the study area (Figure 12F). LF3 has a large BET specific surface area (0.832 m2/g) and pore volume (0.0058 cm3/g) (Table 3). Because it has the highest content of clay minerals (43 wt %) (Table 1) other lithofacies have the following order: LF1 > LF2 > LF5 > LF6 > LF4 (Table 3).
3.6.1.4. Effect of Pyrite
The weak positive correlation between pyrite and pore structure parameters indicates a little contribution of pyrite in the development of mesopores in the Es3x shale (Figure 11G,H). Pore structure parameters of LF1 are relatively higher than other lithofacies and also it has the highest content of pyrite (17 wt %) among all lithofacies (Table 3). Hence, we can infer from these statistics that the pyrite is also one of the contributors to pore formation. However, the content of pyrite is very low and offered only micropores in the study area. Therefore, it shows a negative correlation with pore size in the Es3x shale (Figure 12G). As the distribution of pyrite framboids is abundant with the associated intercrystalline pores (Figure 7E,F), we can assume that only the pyrite framboids act as one of the main contributors of pore formation in the Es3x shale than any forms of pyrite.32
Overall, the distribution of mineral contents plays an important role to control the formation and distribution of different pore types and their structural parameters in the Es3x shale in the Zhanhua Depression (Figure 13).
Figure 13.

Relationship of pore structure parameters with shale lithofacies having different mineralogical compositions and TOC contents. Note: SSA = specific surface area and APD = average pore diameter.
3.6.2. Effect of TOC on Pore Structure Parameters
There is no obvious interaction between pore structure parameters of mesopores and TOC content, which implies that OM is not a good contributor to mesopore development in the Es3x shale (Figure 14A,B). LF1, LF2, and LF3 have TOC content of more than 3 wt % with higher pore structure parameters, whereas LF4 also has TOC >3 wt % but it has the lowest pore structure parameters of the mesopore among all the lithofacies of the Es3x shale (Table 3 and Figure 13). The weak negative correlation between TOC and pore structure parameters shows that OM pores are very poorly developed in the Es3x shale. Many other types of highly matured transitional shales also revealed the same conditions.27,54−56 The reason behind this poor development is the low maturity of the Es3x shale because, for OM pore development in the lacustrine shale, the Ro should be more than 1.2%.16 In the Es3x shale, OM comprises of type-I to type-II kerogens.16 The oil-prone type-I (sapropel) to type-II (liptinite) kerogens can generate OM pores in large quantity over the bulk amount of OM consumption,57 but the vitrinite reflectance value of the studied shale does not meet the criteria to generate pores. Therefore, OM pore development is very poor in the Es3x shale. This indicates that the impact of OM could be negligible because it is still in the oil window. At this maturation stage, OM pores are not formed compared to those shales that are in the gas window or at the overmature stage. The cracking of OM into bitumen could fill some primary pores in the early phases of the oil window which can decrease the OM pore volume through the pyrobitumen precipitation in pores and micro-cracks.58,59 Under these conditions, the inorganic pores play an important role as the main contributors to the total pore network system in the Es3x shale.
Figure 14.

Relationship of TOC content with pore structure parameters of the Es3x shale.
OM also plays a significant part in the generation of intercrystalline pores in the calcite (Figure 15A,B). Due to the thermal evolution of OM, some organic acids and CO2 are released from OM. These two components from OM cause recrystallization of micrite to the recrystallized calcite and because of this recrystallization, some reservoir spaces are formed in the recrystallized calcite laminae known as intercrystalline pores (Figure 15A,B). Overall, the lithofacies having TOC contents of more than 3 wt % have higher pore structure parameters of the mesopores (Figure 13). Lithofacies with higher TOC contents are thought to produce more organic acid causing more recrystallization and dissolution and in turn, more intercrystalline pore and dissolution pore generation, increasing the porosity to some extent. Moreover, the calcite recrystallization also changes the mechanical properties and enhances the brittleness of the shale, which is beneficial for the fracturing of shale reservoirs.
3.7. Implications for Storage Capacity of Shale Oil Reservoir
Characteristics of mineralogical composition and OM were considered to be the important constraints for evaluating the storage capacity of the shale reservoirs. The most economical and commercial shale display specific enrichment setups, such as higher content of brittle minerals (>40%), TOC content >2%, and >30–40 m continuous thickness.10 The Es3x shale is considered to be a plausible prospect for shale oil exploration. In the Es3x shale, the average TOC content is 3.08 wt. %, higher carbonate mineral contents (average of 65.83%), and average Ro is 0.7%. The Es3x shale is classified into six lithofacies based on mineralogical compositions, TOC contents, and sedimentary structures. Inorganic pores are abundantly developed in this shale that acts as the main contributor to the shale reservoir. Lithofacies with higher TOC contents (>3%) have higher pore surface area and pore volume indicating favorable reservoir properties for shale oil (Figure 13). LF5 has greater thickness among all lithofacies with higher contents of brittle minerals and pore structure parameters but it is organic poor lithofacies having average TOC content less than 1.54 wt %, therefore it is not favorable lithofacies. Hence, we carefully selected LF1, LF2, and LF3 as favorable lithofacies because of their higher pore structure parameters as well as the high contents of brittle minerals and TOC. Therefore, it can be suggested that LF1, LF2, and LF3 are the most promising lithofacies in the Es3x shale (Figure 13) because of their sophisticated pore volume which is an indispensable parameter for reservoir fluid migration through the pore network after hydrofracking.
4. Conclusions
Based on the comprehensive quantitative and qualitative characterization of the Es3x shale deposited in a lacustrine setting, the following findings can be concluded from this research work:
-
(1)
The Es3x shale is classified into six lithofacies types based on mineral compositions, TOC contents, and sedimentary structures, that is, organic-rich laminated clay-bearing aragonitic shale (LF1), organic-rich non-laminated clay-bearing calcareous shale (LF2), organic-fair non-laminated calcite-bearing argillaceous shale (LF3), organic-rich laminated clay-bearing calcareous shale (LF4), organic-poor laminated clay-bearing calcareous shale (LF5), and organic-poor laminated quartz-bearing calcareous shale (LF6).
-
(2)
The common pore types of the Es3x shale are InterP pores, IntraP pores, intercrystalline pores, dissolution pores, OM pores, and microfractures. Whereas the shape of the pores is slit-like to narrow slit.
-
(3)
Inorganic pores play an important role and their whole pore system description showed that the mesopores and macropores are the main contributors to the pore system in the Es3x shale. The existence of micropores is subjected to the lithofacies types in the Es3x shale.
-
(4)
OM pores are poorly developed and their distribution is very scarce in all types of lithofacies of the Es3x shale, which may be associated with the lower thermal maturity of this shale. Microfractures associated with OM and brittle minerals are relatively well-developed in the Es3x shale.
-
(5)
The average values of the BET specific surface and pore volume in the Es3x shale are 0.697 m2/g and 0.005 cm3/g, respectively.
-
(6)
The relationship between mineral components and pore parameters indicates that the carbonate minerals act as the main contributors to the formation and distribution of different pore types in the studied shale. Pore volume and the pore specific surface area did not show a good relationship with mineral composition and TOC due to disordered mesopores and macropores, but pore size shows a good relationship with mineral composition and TOC of the Es3x shale.
-
(7)
LF1, LF2, and LF3 lithofacies of the Es3x shale are proposed to be more critical for fluid migration through pore network systems due to feasible pore structure parameters.
5. Sample Collection and Methods
5.1. Sampling and Thin-Section Petrography
The shale samples were collected from the Es3x shale of the Eocene Shahejie Formation in the Zhanhua Depression. A total of 43 core samples were obtained for this research work from Luo-69 well in the study area. It is an experimental well that was drilled through the Neogene Minghuazhen Formation and Guantao Formation (top) and the Paleogene Dongying, Shahejie, and Kongdian Formations (bottom). The study interval of the Es3x shale ranges from 2937.8 to 3140.25 m (Figure 2B). The lithology of the Es3x shale comprises of gray to dark-gray fine calcareous shale. Thin sections are prepared from core samples of the study interval. Core samples were repeatedly grounded to achieve a standard thickness ranging from 0.03 mm. A total of 43 thin sections were prepared after a detailed systematic analysis of hand specimens that represent the basic characteristics of the Es3x shale of the Eocene Shahejie Formation. Each sample was analyzed in detail using a Leica DM4 P microscope.
5.2. TOC Analysis and XRD Analysis
The TOC content is a key factor for the source rock evaluation because it reflects the copiousness of OM. Twenty-nine shale samples were selected and examined for TOC using a C–S (carbon and sulfur) analyzer (model: LECO CS744) that worked at 1200 °C in a closed system. The shale samples used for TOC content measurement were crushed and grounded to <100 mesh size. Next, 0.13–0.14 g of each powdered sample was added in a crucible and then immersed in a dilute HCl solution (volume ratio = 1:7) for 24 h to remove inorganic carbonates. The samples were then washed with distilled water to remove acid contaminations and placed in an oven for 2 h at 60 °C. Then, each sample was put into the LECO CS744 analyzer for TOC analysis. This technique is the most common technique for the evaluation of mineralogical composition in shale reservoir rocks.60 A total of 29 samples of the Es3x Shale of the Eocene Shahejie Formation from the Zhanhua Depression were selected and analyzed for clay fraction and whole-rock mineral constituents by using a Panalytical X’Pert PRO X-ray diffractometer equipped with a Cu X-ray target (40 kV, 40 mA). Each sample weighing 5 g was dried in an oven for 2 day at 40 °C and crushed to a powder form (80–100 mesh size) fraction by using an agate mortar and pestle. The angle range for the analysis of whole-rock minerals and clay fractions was 5–10°. Identification of various mineral phases and their semi-quantitative relative abundances (weight %) were deduced by computer diffractogram analysis.
5.3. FE-SEM Analysis
Based on the results of mineralogy from XRD analysis, shale samples having different mineralogical constituents were carefully chosen for FE-SEM analysis to observe different morphological features of various mineral proportions/OM, micropores, and microfractures. For FE-SEM analysis, the shale samples were polished with argon ions and then coated with gold to increase the smoothness and conductivity, respectively. FE-SEM analysis was performed on a Zeiss Crossbeam-550 (Gemini-2) scanning electron microscope. Additionally, an energy dispersive spectrometer system (Bruker Nano GmbH, Model: Flash Detector 6|100) was also used to specify the elemental constituents in detected minerals.
5.4. Low-Pressure Nitrogen Adsorption Analysis
The pore morphology including PSD, pore volume, and surface area of the Es3x shale was observed using the low-pressure nitrogen adsorption technique. A total of 20 representative shale samples were selected and then each sample was crushed to a powder form (60–80 mesh size). The required powdered samples (0.5 g from each sample) were degassed for 6 h at 110 °C for pore surface cleansing. This experiment was performed on the Micromeritics ASAP 2460 apparatus located at the Key Laboratory of Deep Oil and Gas, China University of Petroleum East China. The LP-N2-GA test was carried out at −195.8 °C temperature to characterize the pore structure.2 The pore surface area is calculated using the BET model,61 whereas the Barrett–Joyner–Halenda model is used to compute PSD and pore volume.61,62 The isotherms and hysteresis loops were analyzed based on previously defined models shown in Figures 16 and 17.45
Figure 17.

Classifications of adsorption hysteresis loop curves and pore types (modified and reproduced from Medina-Rodriguez and Alvarado45).
Acknowledgments
This research work was supported by National Science and Technology Major Project of China (Grant no. 2017ZX05009-002), the National Natural Science Foundation of China (nos. U1762217, 41702139, 42072164, and 41821002), Taishan Scholars Program (no. TSQN201812030), and the Fundamental Research Funds for the Central Universities (19CX07003A). The authors would also like to acknowledge the School of Geosciences, China University of Petroleum East China, and Qingdao Government for their analytical and financial support. This manuscript is greatly benefited from the constructive comments and prolific suggestions of three anonymous reviewers. We also extend our thanks to Prof. Dr. Mohamed Mahmoud for his thoughtful comments and editorial handling of the manuscript.
Supporting Information Available
The Supporting Information is available free of charge at https://pubs.acs.org/doi/10.1021/acsomega.2c01001.
Total pore size and mineral composition of the Es3x shale (PDF)
The authors declare no competing financial interest.
Supplementary Material
References
- Clarkson C. R.; Solano N.; Bustin R. M.; Bustin A. M. M.; Chalmers G. R. L.; He L.; Melnichenko Y. B.; Radliński A. P.; Blach T. P. Pore structure characterization of North American shale gas reservoirs using USANS/SANS, gas adsorption, and mercury intrusion. Fuel 2013, 103, 606–616. 10.1016/j.fuel.2012.06.119. [DOI] [Google Scholar]
- Rouquerol J.; Avnir D.; Fairbridge C. W.; Everett D. H.; Haynes J. M.; Pernicone N.; Ramsay J. D. F.; Sing K. S. W.; Unger K. K. Recommendations for the characterization of porous solids. Pure Appl. Chem. 1994, 66, 1739–1758. 10.1351/pac199466081739. [DOI] [Google Scholar]
- Anovitz L. M.; Cole D. R. Characterization and Analysis of Porosity and Pore Structures. Rev. Mineral. Geochem. 2015, 80, 61–164. 10.2138/rmg.2015.80.04. [DOI] [Google Scholar]
- Loucks R. G.; Ruppel S. C.; Wang X.; Ko L. T.; Peng S.; Zhang T.; Rowe H. D.; Smith P. H. Pore types, pore-network analysis, and pore quantification of the lacustrine shale-hydrocarbon system in the Late Triassic Yanchang Formation in the southeastern Ordos Basin, China. Interpretation 2017, 5, SF63. 10.1190/int-2016-0094.1. [DOI] [Google Scholar]
- Fink R.; Amann-Hildenbrand A.; Bertier P.; Littke R. Pore structure, gas storage and matrix transport characteristics of lacustrine Newark shale. Mar. Pet. Geol. 2018, 97, 525. 10.1016/j.marpetgeo.2018.06.035. [DOI] [Google Scholar]
- Rijfkogel L. S.; Ghanbarian B.; Hu Q.; Liu H.-H. Clarifying pore diameter, pore width, and their relationship through pressure measurements: A critical study. Mar. Pet. Geol. 2019, 107, 142. 10.1016/j.marpetgeo.2019.05.019. [DOI] [Google Scholar]
- Sun M.; Zhao J.; Pan Z.; Hu Q.; Yu B.; Tan Y.; Sun L.; Bai L.; Wu C.; Blach T. P.; Zhang Y.; Zhang C.; Cheng G. Pore characterization of shales: A review of small angle scattering technique. J. Nat. Gas Sci. Eng. 2020, 78, 103294. 10.1016/j.jngse.2020.103294. [DOI] [Google Scholar]
- Wang S.; Li X.; Xue H.; Shen Z.; Chen L. Fractal characteristics of shale pore structure and its influence on seepage flow. R. Soc. Open Sci. 2021, 8, 202271. 10.1098/rsos.202271. [DOI] [PMC free article] [PubMed] [Google Scholar]
- Zhang T.; Sun X.; Walters C. C.; Sundaram A.; Calla J. T. Geochemistry of oils and condensates from the lower Eagle Ford formation, south Texas. Part 1: Crude assay measurements and SimDist modeling. Mar. Pet. Geol. 2022, 139, 105576. 10.1016/j.marpetgeo.2022.105576. [DOI] [Google Scholar]
- Jarvie D. M.; Hill R. J.; Ruble T. E.; Pollastro R. M. Unconventional shale-gas systems: the Mississippian Barnett Shale of north-central Texas as one model for thermogenic shale-gas assessment. AAPG Bull. 2007, 91, 475–499. 10.1306/12190606068. [DOI] [Google Scholar]
- Loucks R. G.; Reed R. M.; Ruppel S. C.; Hammes U. Spectrum of pore types and networks in mudrocks and a descriptive classification for matrix-related mudrock pores. AAPG Bull. 2012, 96, 1071–1098. 10.1306/08171111061. [DOI] [Google Scholar]
- Zhao J.; Jin Z.; Jin Z.; Wen X.; Geng Y. Physical mechanism of organic matter-mineral interaction in Longmaxi Shale, Sichuan Basin, China. Acta Geol. Sin. 2016, 90, 1923–1924. 10.1111/1755-6724.12834. [DOI] [Google Scholar]
- Klaver J.; Desbois G.; Urai J. L.; Littke R. BIB-SEM study of the pore space morphology in early mature Posidonia Shale from the Hils area, Germany. Int. J. Coal Geol. 2012, 103, 12–25. 10.1016/j.coal.2012.06.012. [DOI] [Google Scholar]
- Pan S.; Zou C.; Yang Z.; Dong D.; Wang Y.; Wang S.; Wu S.; Huang J.; Liu Q.; Wang D.; Wang Z. Methods for Shale Gas Play Assessment: A Comparison between Silurian Longmaxi Shale and Mississippian Barnett Shale. J. Earth Sci. 2015, 26, 285–294. 10.1007/s12583-015-0524-0. [DOI] [Google Scholar]
- Zheng H.; Yang F.; Guo Q.; Pan S.; Jiang S.; Wang H. Multi-scale pore structure, pore network and pore connectivity of tight shale oil reservoir from Triassic Yanchang Formation, Ordos Basin. J. Petrol. Sci. Eng. 2022, 212, 110283. 10.1016/j.petrol.2022.110283. [DOI] [Google Scholar]
- Liang C.; Cao Y.; Jiang Z.; Wu J.; Guoqi S.; Wang Y. Shale Oil Potential of Lacustrine Black Shale in the Eocene Dongying Depression: Implications for Geochemistry and Reservoir. AAPG Bull. 2017, 101, 1835–1858. 10.1306/01251715249. [DOI] [Google Scholar]
- Shan C.; Zhao W.; Wang F.; Zhang K.; Feng Z.; Guo L.; Ma X.; Liao T. Nanoscale pore structure heterogeneity and its quantitative characterization in Chang7 lacustrine shale of the southeastern Ordos Basin, China. J. Petrol. Sci. Eng. 2020, 187, 106754. 10.1016/j.petrol.2019.106754. [DOI] [Google Scholar]
- Li Y.; Wang X.; Wu B.; Li G.; Wang D. Sedimentary Facies of Marine Shale Gas Formations in Southern China: The Lower Silurian Longmaxi Formation in the Southern Sichuan Basin. J. Earth Sci. 2016, 27, 807–822. 10.1007/s12583-015-0592-1. [DOI] [Google Scholar]
- Liang C.; Jiang Z.; Cao Y.; Wu M.; Guo L.; Zhang C. Deep-Water Depositional Mechanisms and Significance for Unconventional Hydrocarbon Exploration: A Case Study from the Lower Silurian Longmaxi Shale in the Southeastern Sichuan Basin. AAPG Bull. 2016, 100, 773–794. 10.1306/02031615002. [DOI] [Google Scholar]
- Jarvie D. M. Shale resource systems for oil and gas, part 2, shale-oil resource systems. AAPG Mem. 2012, 97, 89–119. 10.1306/13321447M973489. [DOI] [Google Scholar]
- Chalmers G. R.; Bustin R. M.; Power I. M. Characterization of gas shale pore systems by porosimetry, pycnometry, surface area, and field emission scanning electron microscopy/transmission electron microscopy image analyses: Examples from the Barnett, Woodford, Haynesville, Marcellus, and Doig units Characterization of Gas Shale Pore Systems. AAPG Bull. 2012, 96, 1099–1119. 10.1306/10171111052. [DOI] [Google Scholar]
- Bustin R. M.; Bustin A. M. M.; Cui A.; Ross D.; Pathi V. M.. Impact of Shale Properties on Pore Structure and Storage Characteristics. In All Days; SPE: Fort Worth, Texas, USA, 2008; p SPE-119892-MS. [Google Scholar]
- Chen L.; Jiang Z.; Ji W.; Chen W.; Li W.; Huang H. Controlling factors and accumulation significance of microscopic pore structure in the fifth member of Xujiahe Formation in the Western Sichuan Depression. J. China Coal Soc. 2015, 40, 449–457. 10.13225/j.cnki.jccs.2015.0014. [DOI] [Google Scholar]
- Ross D. J. K.; Marc Bustin R. The importance of shale composition and pore structure upon gas storage potential of shale gas reservoirs. Mar. Pet. Geol. 2009, 26, 916–927. 10.1016/j.marpetgeo.2008.06.004. [DOI] [Google Scholar]
- Han H.; Zhong N.; Ma Y.; Huang C.; Wang Q.; Chen S.; Lu J. Gas storage and controlling factors in an overmature marine shale: A case study of the Lower Cambrian Lujiaping shale in the Dabashan arc-like thrust–fold belt, southwestern China. J. Nat. Gas Sci. Eng. 2016, 33, 839–853. 10.1016/j.jngse.2016.06.027. [DOI] [Google Scholar]
- Hu Q.; Zhang Y.; Meng X.; Li Z.; Xie Z.; Li M. Characterization of micro-nano pore networks in shale oil reservoirs of Paleogene Shahejie Formation in Dongying Sag of Bohai Bay Basin, East China. Pet. Explor. Dev. 2017, 44, 720–730. 10.1016/S1876-3804(17)30083-6. [DOI] [Google Scholar]
- Zhang Q.; Pang Z.; Zhang J.; Lin W.; Jiang S. Qualitative and quantitative characterization of a transitional shale reservoir: a case study from the Upper Carboniferous Taiyuan shale in the eastern uplift of Liaohe Depression, China. Mar. Pet. Geol. 2017, 80, 307–320. 10.1016/j.marpetgeo.2016.11.019. [DOI] [Google Scholar]
- Allen M. B.; Macdonald D. I.; Xun Z.; Vincent S. J.; Brouet-Menzies C. Early Cenozoic two-phase extension and late Cenozoic thermal subsidence and inversion of the Bohai Basin, northern China. Mar. Pet. Geol. 1997, 14, 951–972. 10.1016/S0264-8172(97)00027-5. [DOI] [Google Scholar]
- Hao F.; Zhou X.; Zhu Y.; Yang Y. Lacustrine Source Rock Deposition in Response to Co-Evolution of Environments and Organisms Controlled by Tectonic Subsidence and Climate, Bohai Bay Basin. China. Org. Geochem. 2011, 42, 323–339. 10.1016/j.orggeochem.2011.01.010. [DOI] [Google Scholar]
- Huang C.; Wang H.; Wu Y.; Wang J.; Chen S.; Ren P.; Liao Y.; Zhao S. e.; Xia C. Genetic Types and Sequence Stratigraphy Models of Palaeogene Slope Break Belts in Qikou Sag, Huanghua Depression, Bohai Bay Basin, Eastern China. Sed. Geol. 2012, 261–262, 65–75. 10.1016/j.sedgeo.2012.03.005. [DOI] [Google Scholar]
- Jiu K.; Ding W.; Huang W.; Zhang Y.; Zhao S.; Hu L. Fractures of lacustrine shale reservoirs, the Zhanhua Depression in the Bohai Bay Basin, eastern China. Mar. Pet. Geol. 2013, 48, 113–123. 10.1016/j.marpetgeo.2013.08.009. [DOI] [Google Scholar]
- Khan D.; Qiu L.; Liang C.; Mirza K.; Rehman S. U.; Han Y.; Hannan A.; Kashif M.; Kra K. L. Genesis and Distribution of Pyrite in the Lacustrine Shale: Evidence from the Es3x Shale of the Eocene Shahejie Formation, Zhanhua Sag, East China. ACS Omega 2021, 7, 1244. 10.1021/acsomega.1c05874. [DOI] [PMC free article] [PubMed] [Google Scholar]
- Wang Y.; Li M.; Pang X.; Zhang S.; Shi D. Fault-fracture mesh petroleum plays in the Zhanhua Depression, Bohai Bay Basin: part 1. Source rock characterization and quantitative assessment. Org. Geochem. 2005, 36, 183–202. 10.1016/j.orggeochem.2004.08.003. [DOI] [Google Scholar]
- Hao F.; Zhou X.; Zhu Y.; Zou H.; Bao X.; Kong Q. Mechanisms of petroleum accumulation in the Bozhong sub-basin, Bohai Bay Basin, China. Part 1: origin and occurrence of crude oils. Mar. Pet. Geol. 2009, 26, 1528–1542. 10.1016/j.marpetgeo.2008.09.005. [DOI] [Google Scholar]
- Wang M.; Wilkins R. W. T.; Song G.; Zhang L.; Xu X.; Li Z.; Chen G. Geochemical and geological characteristics of the Es3 L lacustrine shale in the Bonan sag, Bohai Bay Basin, China. Int. J. Coal Geol. 2015a, 138, 16–29. 10.1016/j.coal.2014.12.007. [DOI] [Google Scholar]
- Wang Z.; Fu X.; Feng X.; Song C.; Wang D.; Chen W.; Zeng S. Geochemical features of the black shales from the Wuyu Basin, southern Tibet: implications for palaeoenvironment and palaeoclimate. Geol. J. 2015b, 52, 282–297. 10.1002/gj.2756. [DOI] [Google Scholar]
- Liu Q.; Zhu X.; Yang Y.; Geng M.; Tan M.; Jiang L.; Chen L. Sequence stratigraphy and seismic geomorphology application of facies architecture and sediment-dispersal patterns analysis in the third member of Eocene Shahejie Formation, slope system of Zhanhua Sag, Bohai Bay Basin, China. Mar. Pet. Geol. 2016, 78, 766–784. 10.1016/j.marpetgeo.2015.11.015. [DOI] [Google Scholar]
- Zhang S.; Zhang L.; Bao Y.; Li X.; Liu Q.; Li J.; Yin Y.; Zhu R.; Zhang S. Formation fluid characteristics and hydrocarbon accumulation in the Dongying sag, Shengli oilfield. Pet. Explor. Dev. 2012, 39, 423–435. 10.1016/S1876-3804(12)60059-7. [DOI] [Google Scholar]
- Huang X.; Zhang J.; Li X.; Sun R.; Peng J.; Long S. Pore types and characteristics of continental shale and discussion on the process of oil and gas accumulation: a case study of the western sag of Liaohe Depression. Nat. Gas Geosci. 2015, 26, 1422–1432. 10.11764/j.issn.1672-1926.2015.07.1422. [DOI] [Google Scholar]
- Dow W. G. Kerogen studies and geological interpretations. J. Geochem. Explor. 1977, 7, 79–99. 10.1016/0375-6742(77)90078-4. [DOI] [Google Scholar]
- Curtis M. E.; Cardott B. J.; Sondergeld C. H.; Rai C. S. Development of organic porosity in the Woodford Shale with increasing thermal maturity. Int. J. Coal Geol. 2012, 103, 26–31. 10.1016/j.coal.2012.08.004. [DOI] [Google Scholar]
- Modica C. J.; Lapierre S. G. Estimation of kerogen porosity in source rocks as a function of thermal transformation: example from the Mowry Shale in the Powder River Basin of Wyoming. AAPG Bull. 2012, 96, 87–108. 10.1306/04111110201. [DOI] [Google Scholar]
- Wu S.; Zhu R.; Cui J.; Cui J.; Bai B.; Zhang X.; Jin X.; Zhu D.; You J.; Li X. Characteristics of lacustrine shale porosity evolution, Triassic Chang 7 Member, Ordos Basin, NW China. Petrol. Explor. Dev. 2015, 42, 185–195. 10.1016/s1876-3804(15)30005-7. [DOI] [Google Scholar]
- Physical chemistry division commission on colloid and surface chemistry, subcommittee on characterization of porous solids. Recommendations for the characterization of porous solids (technical report). Pure Appl. Chem. 1994, 66, 1739–1758. [Google Scholar]
- Medina-Rodriguez B. X.; Alvarado V. Use of Gas Adsorption and Inversion Methods for Shale Pore Structure Characterization. Energies 2021, 14, 2880. 10.3390/en14102880. [DOI] [Google Scholar]
- Schieber J.Common themes in the formation and preservation of porosity in shales and mudstones: Illustrated with examples across the Phanerozoic: SPE Unconventional Gas Conference: Pittsburgh, Pennsylvania, February 23–25, 2010; SPE-132370-MS, p 10.
- Slatt R. M.; O’Brien N. R. Pore types in the Barnett and Woodford gas shales: Contribution to understanding gas storage and migration pathways in fine-grained rocks. AAPG Bull. 2011, 95, 2017–2030. 10.1306/03301110145. [DOI] [Google Scholar]
- Rijken P.; Cooke M. L. Role of shale thickness on vertical connectivity of fractures, application of crack-bridging theory to the Austin Chalk, Texas. Tectonophysics 2001, 337, 117–133. 10.1016/S0040-1951(01)00107-X. [DOI] [Google Scholar]
- Shedid S. A. Influences of fracture orientation on oil recovery by water and polymer flooding processes, an experimental approach. J. Petrol. Sci. Eng. 2006, 50, 285–292. 10.1016/j.petrol.2005.12.002. [DOI] [Google Scholar]
- Milliken K. L.; Curtis M. E. Imaging pores in sedimentary rocks: foundation of porosity prediction. Mar. Pet. Geol. 2016, 73, 590–608. 10.1016/j.marpetgeo.2016.03.020. [DOI] [Google Scholar]
- Khan D.; Qiu L.; Liang C.; Martizzi P.; Mirza K.; Liu J. Tracing forming mechanism of the sparry calcite growth in the lacustrine shale of east China: A glimpse into the role of organic matter in calcite transformation. Geol. J. 2022, 10.1002/gj.4379. [DOI] [Google Scholar]
- Lundegard P. D.; Land L. S.; Galloway W. E. Problem of secondary porosity: Frio Formation (Oligocene), Texas Gulf Coast. Geology 1984, 12, 399–402. 10.1130/0091-7613(1984)12<399:pospff>2.0.co;2. [DOI] [Google Scholar]
- Kuila U.; Prasad M. Specific surface area and pore-size distribution in clays and shales. Geophys. Prospect. 2013, 61, 341–362. 10.1111/1365-2478.12028. [DOI] [Google Scholar]
- Wu Z.; He S.; Han Y.; Zhai G.; He X.; Zhou Z. Effect of Organic Matter Type and Maturity on Organic Matter Pore Formation of Transitional Facies Shales: A Case Study on Upper Permian Longtan and Dalong Shales in Middle Yangtze Region, China. J. Earth Sci. 2020, 31, 368–384. 10.1007/s12583-019-1237-6. [DOI] [Google Scholar]
- Zhang J.-Z.; Li X.; Wang Y.; Fu Q.; Cai Y.; Niu H. Accumulation conditions and reservoir characteristics of marine-terrigenous facies coal measures shale gas from Longtan Formation in South Sichuan Basin. J. China Coal Soc. 2015, 40, 1871–1878. 10.13225/j.cnki.jccs.2015.0320. [DOI] [Google Scholar]
- Tang S.; Zhang J.; Elsworth D.; Tang X.; Li Z.; Du X.; Yang X. Lithofacies and pore characterization of the lower Permian Shanxi and Taiyuan shales in the southern North China basin. J. Nat. Gas Sci. Eng. 2016, 36, 644–661. 10.1016/j.jngse.2016.11.013. [DOI] [Google Scholar]
- Yang C.; Zhang J.; Wang X.; Tang X.; Chen Y.; Jiang L.; Gong X. Nanoscale pore structure and fractal characteristics of a marine-continental transitional shale: A case study from the Lower Permian Shanxi Shale in the southeastern Ordos Basin, China. Mar. Pet. Geol. 2017, 88, 54–68. 10.1016/j.marpetgeo.2017.07.021. [DOI] [Google Scholar]
- Bai F.; Sun Y.; Liu Y.; Guo M. Evaluation of the porous structure of Huadian oil shale during pyrolysis using multiple approaches. Fuel 2017, 187, 1–8. 10.1016/j.fuel.2016.09.012. [DOI] [Google Scholar]
- Ko L. T.; Ruppel S. C.; Loucks R. G.; Hackley P. C.; Zhang T.; Shao D. Pore-types and pore-network evolution in Upper Devonian-Lower Mississippian Woodford and Mississippian Barnett mudstones: Insights from laboratory thermal maturation and organic petrology. Int. J. Coal Geol. 2018, 190, 3–28. 10.1016/j.coal.2017.10.001. [DOI] [Google Scholar]
- Metwally Y. M.; Chesnokov E. M. Clay mineral transformation as a major source for authigenic quartz in thermo-mature gas shale. Appl. Clay Sci. 2012, 55, 138–150. 10.1016/j.clay.2011.11.007. [DOI] [Google Scholar]
- Brunauer S.; Emmett P. H.; Teller E. Adsorption of gases in multi-molecular layers. J. Am. Chem. Soc. 1938, 60, 309–319. 10.1021/ja01269a023. [DOI] [Google Scholar]
- Barrett E. P.; Joyner L. G.; Halenda P. P. The determination of pore volume and area distributions in porous substances. I. Computations from nitrogen isotherms. J. Am. Chem. Soc. 1951, 73, 373–380. 10.1021/ja01145a126. [DOI] [Google Scholar]
Associated Data
This section collects any data citations, data availability statements, or supplementary materials included in this article.