

Abstract
Background:
While numerous genetic loci associated with atopic dermatitis (AD) have been discovered, to date, work leveraging the combined burden of AD risk variants across the genome to predict disease risk has been limited.
Objectives:
This study aims to determine whether polygenic risk scores (PRSs) relying on genetic determinants for AD provide useful predictions for disease occurrence and severity. It also explicitly tests the value of including genome-wide association studies of related allergic phenotypes and known FLG loss-of-function (LOF) variants.
Methods:
AD PRSs were constructed for 1619 European American individuals from the Atopic Dermatitis Research Network using an AD training dataset and an atopic training dataset including AD, childhood onset asthma, and general allergy. Additionally, whole genome sequencing data were used to explore genetic scoring specific to FLG LOF mutations.
Results:
Genetic scores derived from the AD-only genome-wide association studies were predictive of AD cases (PRSAD: odds ratio [OR], 1.70; 95% CI, 1.49–1.93). Accuracy was first improved when PRSs were built off the larger atopy genome-wide association studies (PRSAD+: OR, 2.16; 95% CI, 1.89–2.47) and further improved when including FLG LOF mutations (PRSAD++: OR, 3.23; 95% CI, 2.57–4.07). Importantly, while all 3 PRSs correlated with AD severity, the best prediction was from PRSAD++, which distinguished individuals with severe AD from control subjects with OR of 3.86 (95% CI, 2.77–5.36).
Conclusions:
This study demonstrates how PRSs for AD that include genetic determinants across atopic phenotypes and FLG LOF variants may be a promising tool for identifying individuals at high risk for developing disease and specifically severe disease.
Keywords: Atopic dermatitis, polygenic risk score, atopic march, allergic disease, genetic architecture, filaggrin, disease prediction, genetic predisposition
Atopic dermatitis (AD) is a common skin disease often characterized by pruritus; dryness; and eczematous, erythematous skin lesions. AD has a broad health impact as it is estimated to be prevalent in 6% to 11% of the US population,1,2 is more common in children than in adults, and affects individuals worldwide.3 Reducing the burden of AD would be financially beneficial to both individuals and the overall health care system. The national cost of AD has been conservatively estimated to be $5.297 billion annually,4,5 and survey results report the median affected adult spends $600 out of pocket on AD-related expenses per year.6 These large nationwide and personal costs are important to contextualize among the profound psychological impacts and decreased quality of life associated with AD.7,8
Environmental factors such as climate, pollution, food, and use of personal care products are considered to play a role in disease development,9,10 but AD has been noted for its especially high heritability (71%-90%)11–13 among atopic diseases, suggesting a prominent role for genetic risk factors. AD often precedes the onset of other atopic diseases such as allergic rhinitis, food allergy, and asthma,14,15 described as the atopic march, and importantly, there is shared genetic etiology among asthma, AD, and allergic rhinitis.16,17 A recent review supports these overlaps in AD and asthma genetic loci with food allergy, notably a nonspecific role for FLG loss-of-function (LOF) variants, and HLA alleles.18 The common progression from AD to other atopic conditions further highlights the importance of identifying at-risk individuals for targeted interventions that might reduce the risk of AD, mitigate severity, or lower the propensity to march toward other comorbid conditions.
AD persists on a spectrum, and the improvement patients may attain through treatment options is often dependent on the severity of the disease.19 In addition, patients with AD are uniquely susceptible to cutaneous infections,20 including the viral complication known as eczema herpeticum and increased frequency of bacterial colonization and infection with Staphylococcus aureus.21,22 Moderate and severe AD is characterized by skin patches that are dry, red, inflamed, and itchy, and the resulting limitations to lifestyle (eg, avoidance of social interaction, sleep disturbance) have been associated with indicators for decreased quality of life.8
Polygenic risk scores (PRSs) are a summation of an individual’s particular genetic variants weighted by their disease-specific effect sizes, in which these effect sizes are typically derived from an external and independent genome-wide association study (GWAS). These scores are becoming more accurate as GWAS sample sizes increase23 and have demonstrated potential clinically utility.24–26 Genetic scores using <30 variants27–29 and PRSs using hundreds of variants30 have recently been applied to allergic phenotypes including AD. However, extensive investigation into PRS modeling methods specific to the genetic architecture of AD and analysis of the associations of these scores with measures of AD severity has yet to be addressed.
We aim to build on these primary frameworks of AD prediction through exploring the contribution of genetic signals across allergic phenotypes, PRS model types, thresholds for variant inclusion, FLG-specific genetic components, and an emphasis on the severity of AD. To the best of our knowledge, such an exhaustive score-based application of genetic data has not yet been applied to AD, despite the potential utility to inform preventative treatment options31–34 of high-risk individuals. It is important to frame our findings in the context of the following: (1) the genetic component for AD is complex35–37 and prediction methods have yet to be optimized; (2) a meta-analysis of AD GWASs has identified 27 AD risk loci across 15 chromosomes with gene sets enriched for innate immune cell signaling and T-cell polarization;11 (3) among these risk loci, LOF mutations in FLG that result in epidermal barrier deficiency are the strongest known risk factors;11,38 (4) AD fits into the larger genetic framework of the atopic march (eg, childhood onset asthma associations showed enrichment for dysregulated allergy and epithelial barrier function genes, suggesting broader connections between genetic risk factors for allergic disease and AD39); and (5) accurate methods for identifying high-risk individuals at birth who might benefit from prophylactic treatments currently under investigation.32–34,40–46 Thus, we compare methods involving external genome-wide training datasets for 3 atopic phenotypes (AD, childhood onset asthma, and general allergic disease) along with a score pertaining to 4 specific variants widely studied for their strong association with AD and LOF in the FLG gene.47–49 Through focusing on the genetic components of AD, we demonstrate notable differentiation between cases and control subjects and illustrate strong associations between PRSs and measures of AD severity.
METHODS
Our overall study design is summarized in Fig 1. Briefly, we used GWAS summary statistics from large external studies (see Table E1 in this article’s Online Repository at www.jacionline.org) to derive several PRS models for AD prediction. For each of these external training datasets, we perform model selection tailored to the genetic architecture of AD. The first model we name PRSAD (Fig 1, orange) as it uses a meta-analyzed AD-only GWAS dataset to train scores weighted specifically to AD. The second score, named PRSAD+ (Fig 1, green), is trained using a common factor GWAS that incorporates childhood onset asthma and general allergy GWASs in addition to the meta-analyzed AD GWAS. The third model, named PRSAD++ (Fig 1, yellow), combines the PRSAD+ with FLG genetic risk score (Fig 1, blue) for the presence of ≥1 of 4 well characterized LOF FLG mutations. The comparison of the 3 alternative PRS models is to allow us to evaluate (1) whether there is additional information to be gleaned from atopy-general rather than AD-specific GWAS signals (noting that some of the gain may arise from larger sample sizes rather than true pleiotropic genetic effects), and (2) the added value of specific FLG LOF variants that are known to carry high risk for AD.
FIG 1.
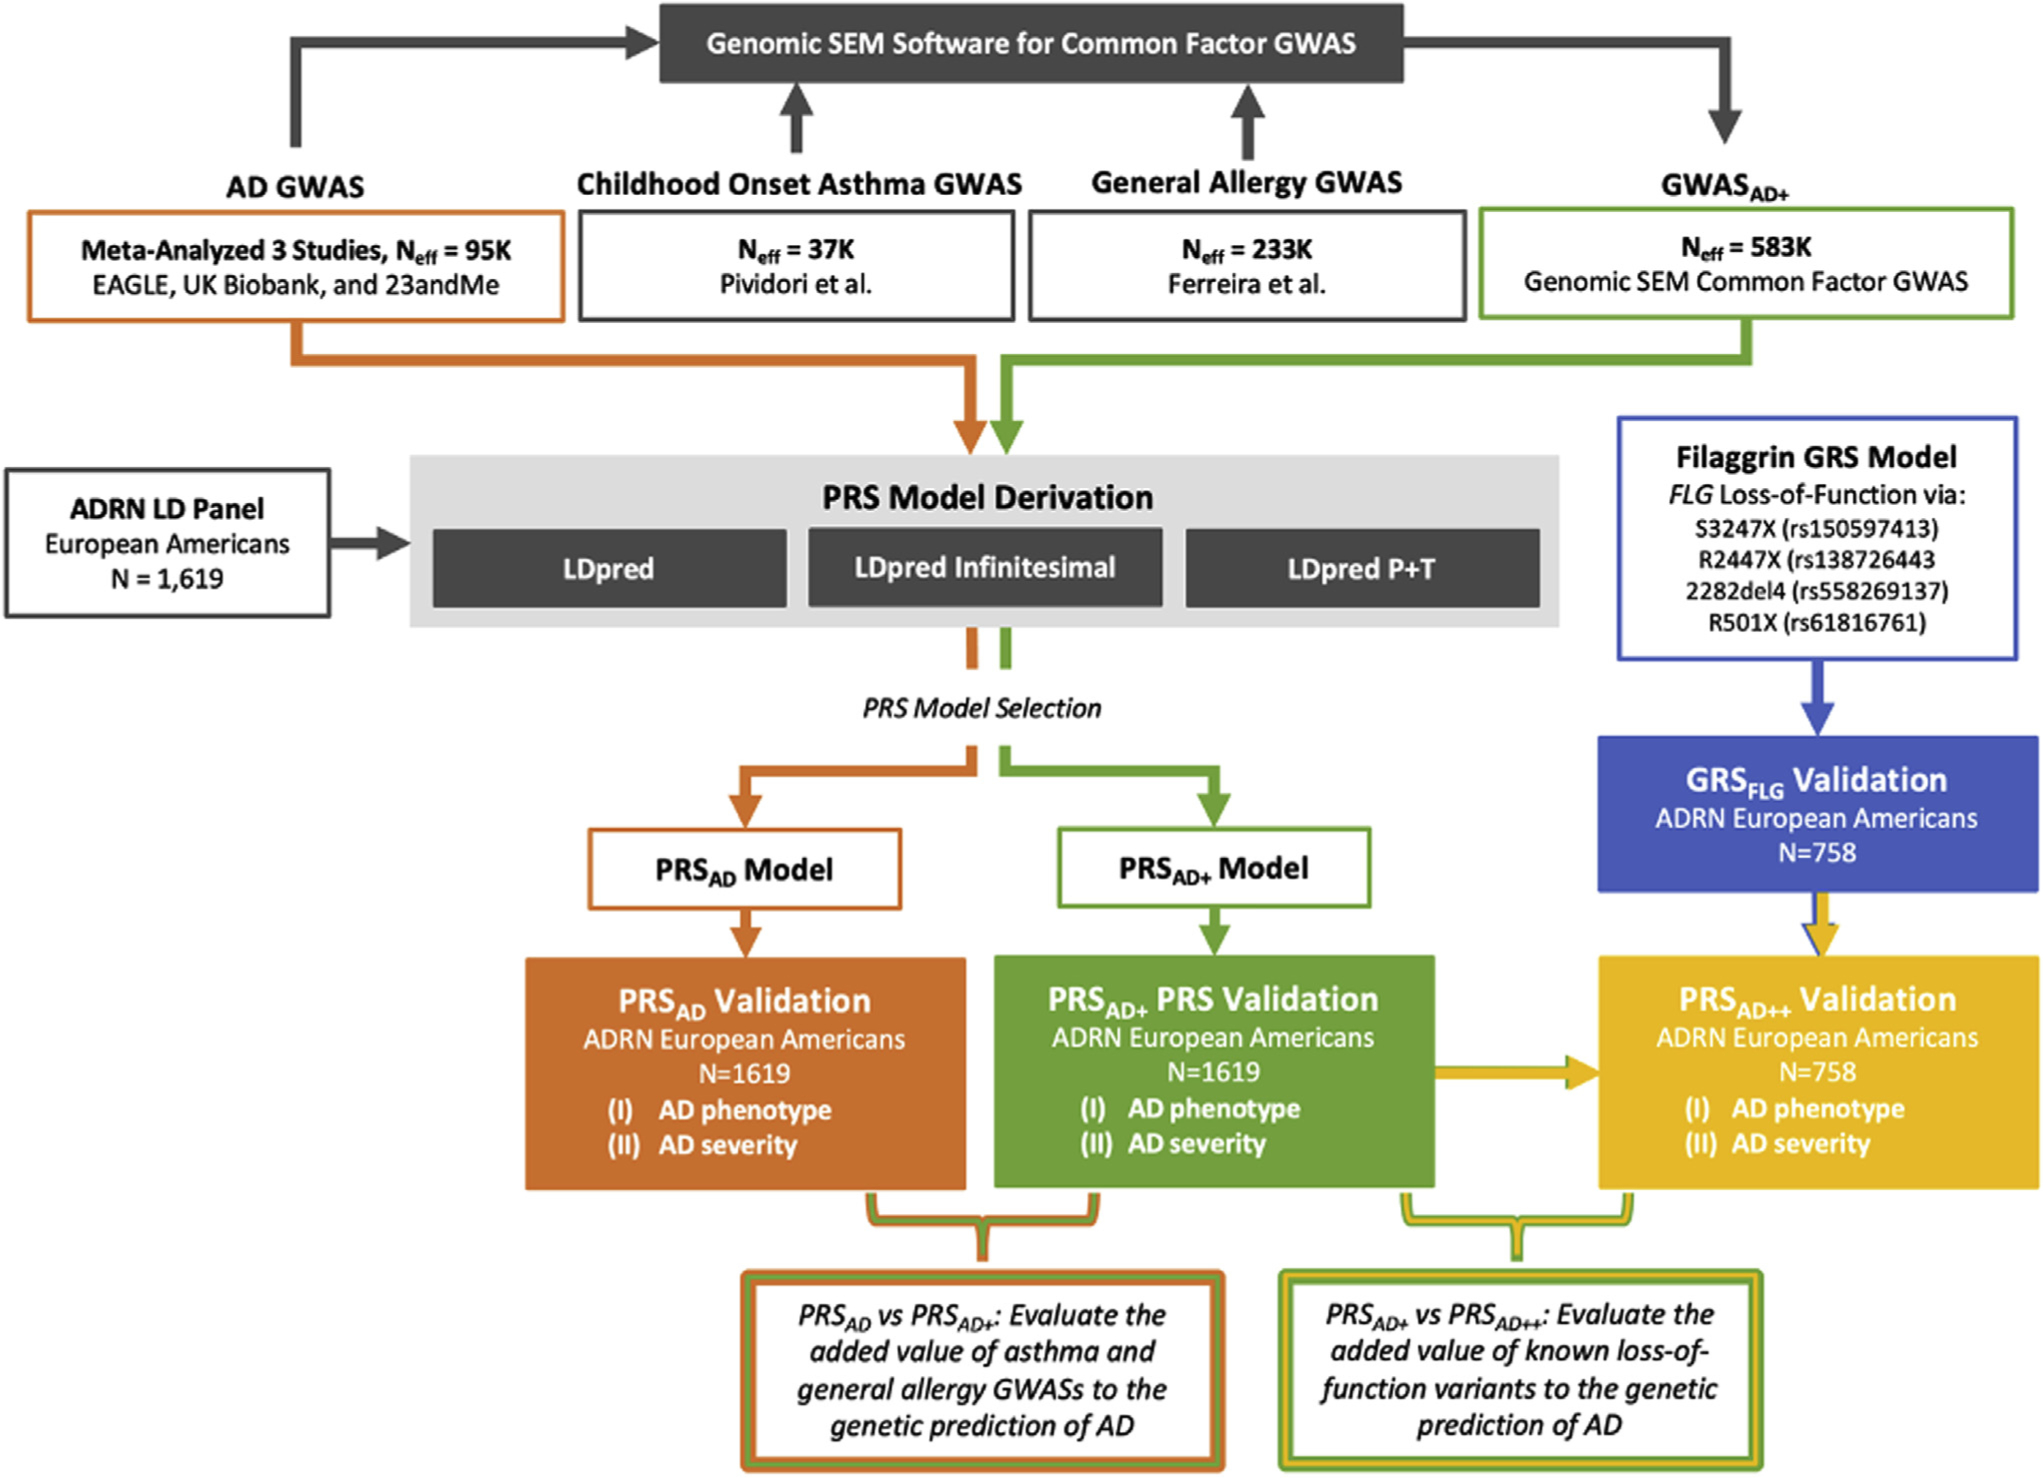
Workflow diagram for PRSAD (orange), PRSAD+ (green), and PRSAD++ (yellow) PRS derivation and validation. GRS, Genetic risk score.
External AD GWAS
Summary statistics from external training GWASs were used to derive PRS models and are summarized in Table E2 of this article’s Online Repository at www.jacionline.org. Effect sizes for AD risk variants were derived by inverse-variance meta-analysis (METAL software)50 for 2 AD GWASs of European-ancestry subjects: (1) The Early Genetics and Lifecourse Epidemiology (EAGLE) Eczema Consortium’s GWAS11 (European ancestry summary statistics excluding 23andMe available at https://data.bris.ac.uk/data/dataset/28uchsdpmub118uex26ylacqm; see note E1 in this article’s Online Repository at www.jacionline.org from Paternoster et al11 for case-control definitions; 23andMe summary statistics were obtained from 23andMe by visiting research.23andme.com/collaborate/#publication); and (2) the Neale Lab UK Biobank GWAS manifest for phenotype code 20002_1452 describing self-reported eczema/dermatitis for 9,321 cases and 351,820 control subjects.51 Because the effect sizes from the UK Biobank GWAS were estimated using a linear model, prior to meta-analysis, coefficients were transformed to odds ratios (ORs) using the linear-mixed model OR method52 (see this article’s Online Repository at www.jacionline.org, especially Table E2 for specifics).
External atopic phenotype GWASs
Given overlap with other atopic diseases such as allergic rhinitis and asthma,18 summary statistics from 2 large external GWASs—allergic disease and childhood onset asthma—were leveraged to assess whether genetic risk for these phenotypes can improve prediction of genetic risk for AD. In the GWAS of allergic disease,16 cases were defined via a broad allergic disease classification—the presence of any of these: asthma, hay fever (allergic rhinitis), or AD (available at https://genepi.qimr.edu.au/staff/manuelf/gwas_results/main.html). The GWAS summary statistics for childhood onset asthma39 (onset before 12 years of age) were obtained from the study investigators. Childhood onset asthma was used over adult-onset asthma because it is more TH2 cell–driven and associated with more epithelial barrier function genes.
Table E1 and Table E3 include specifics on sample size and the genetic-impact correlation of these GWASs.
Common factor GWASAD+
Recently, methods that incorporate multiple GWASs to derive a single PRS have been proposed53,54 that might further improve the prediction of related diseases such as AD, asthma, and allergic rhinitis. While food allergy is a phenotype of interest for inclusion, it was not included due to the lack of a large GWAS from which to derive PRS. We implemented the software Genomic Structural Equation Modeling (Genomic SEM; https://github.com/GenomicSEM/GenomicSEM) to produce a common-factor GWAS for AD, childhood onset asthma, and general allergies, which we refer to as the "a-factor GWAS" to build the downstream PRSAD+. Genomic SEM accounts for overlaps between subjects included in the constituent GWASs53 (an important consideration for our study, given that the same subjects from the UK Biobank were included in the AD, asthma, and general allergies GWASs). The effective sample size of the common-factor GWAS when implementing LDpred (https://github.com/bvilhjal/ldpred) was back-calculated using the averaging approach derived in Mallard et al55 (see the Online Repository).
PRS validation data from ADRN
Our study’s primary purpose was to estimate PRSs for a large group of unrelated European-ancestry Americans from the Atopic Dermatitis Research Network (ADRN) and to assess PRS prediction of AD risk and AD severity. All samples used for this study were obtained following written informed consent from participants. The University of Colorado; Johns Hopkins University; National Jewish Health; Oregon Health and Science University; University of California, San Diego; Boston Children’s Hospital; Northwestern University; Ann and Robert H. Lurie Children’s Hospital of Chicago; University of Rochester Medical Center; Children’s Hospital Los Angeles; Children’s Hospital of Philadelphia; and Mount Sinai School of Medicine institutional review boards approved the conduct of this study.
GWAS array data were generated in 2 batches: (1) 793 samples (683 cases and 110 controls) genotyped on the Multi-Ethnic Global Array (MEGA; Illumina, San Diego, Calif) genotyping chip, and (2) 833 subjects (594 cases and 239 controls) genotyped on the Illumina OMNI 2.5 array chip.56 Sample quality control steps included checks for duplicates and first- or second-degree relationships (resulting in the exclusion of 7 subjects) and principal component analysis to verify European ancestry (no subjects were excluded). We imputed the ADRN GWAS array data separately for each batch to the TOPMed Freeze5 reference panel on the Michigan Imputation Server.57 Post-imputation, variants with low minor allele frequency (<0.01) and genotype probability (<0.9) were removed within each batch. The 2 batches were then merged to a common set of 5,663,079 variants. Details on quality control and genotype imputation steps are available in the Online Repository. The clinical characteristics of the 1619 ADRN subjects (1274 cases and 345 nonatopic controls) available for PRS estimation, including measures of AD severity are further discussed below and are summarized in Figs E1 and E2 and Table E4 in this article’s Online Repository at www.jacionline.org. Cases were defined using AD standard diagnosis criteria with the extra requirement that subjects <4 years of age presented AD for at least 6 months (to avoid misdiagnosis). The nonatopic control subjects were defined as having no individual or family history of atopy and average total IgE < 100 kU/L.20
PRS model derivation and selection
We used 3 alternative linkage disequilibrium (LD) modeling methods in LDpred,58 relying on the above-mentioned external GWAS results while computing PRS for different parameter settings. These 3 models include (1) LD pruning followed by P value thresholding (P+T); (2) LDpred where posterior mean effect sizes are estimated given a proportion of causal markers and accounting for LD; and (3) LDpred-inf where the LDpred model is specialized to an infinitesimal prior, and all variants are considered causal. Because the complex genetic architecture of AD has not yet been well characterized, we implemented all 3 models across LDpred’s standard P+T grid (1, 3 × 10⁻¹, 1 × 10⁻¹, 3 × 10⁻², 1 × 10⁻², 3 × 10⁻³, 1 × 10⁻³, 3 × 10⁻⁴, 1 × 10⁻⁴, 3 × 10⁻⁵, 1 × 10⁻⁵, 1 × 10⁻⁶, 1 × 10⁻⁷, 1 × 10⁻⁸ for the P+T model) and proportion of causal variants grid (1, 3 × 10⁻¹, 1 × 10⁻¹, 3 × 10⁻², 1 × 10⁻², 3 × 10⁻³, 1 × 10⁻³ for the LDpred model). We used the 1619 ADRN European-ancestry American subjects for the LD reference panel. To account for the unbalanced case and control count of the training GWASs, we computed the effective samples size (neff) using the relevant variance inflation factor: neff = 4/(1/ncases+1/ncontrols).59
We compared results across these different model types and thresholds to determine the best approach for each of the 3 PRSs. Likelihood ratio tests were used to compare model fit for all pairs of models. Fig E3 in this article’s Online Repository (available at www.jacionline.org) illustrates the model selection process for PRSAD in which the LDpred model (proportion of causal variants = 3 × 10⁻²) was the selected based on these metrics. To visually interpret disease risk by strata, we include violin boxplots and quantile plots that were constructed using relative quantile status to distinguish AD cases and controls.60 Logistic regression models were used to validate each of the 3 PRSs in the ADRN data (n = 1274 cases, N = 1619 of European ancestry) where PRS was used as the predictor of case-control status. Models were ranked on the basis of area under the curve (AUC),61 OR, Nagelkerke R2, and McFadden R2. These metrics are widely used and provide slightly different methods for evaluation of PRS prediction accuracy.58,60
Contribution of FLG mutations to the PRSAD++
Because FLG LOF mutations48 were not included in the general PRS (see Fig E4 and Table E5 in this article’s Online Repository at www.jacionline.org), we used whole genome sequencing data, available for 758 ADRN subjects (described in the Online Repository), to assess enrichment of FLG mutations by PRS quantile. We used carrier status for any FLG LOF variant: that is, individuals with an alternate genotype for ≥1 of these—2282del4,38 R501X,11,38,51 S3247X,6,25 or R2447X6,25—were coded as 1 (carrier), and individuals without any of these LOF variants were coded as 0 (noncarrier). This FLG indicator was standardized and combined with the standardized PRSAD+ for the 758 individuals with whole genome sequencing data to create a composite PRSAD++.
AD severity correlations with PRSAD, PRSAD+, and PRSAD++
We used several measures to test for association between PRS and AD severity (Figs E1 and E2 and Table E4). The total eosinophil count (cells/mm3; calculated from the "CBC with differential" blood test), log-transformed values for total serum IgE, infant age of onset (AD onset before 1 year of age), eosinophil count, Rajka-Langeland (RL) scores, and Eczema Area and Severity Index (EASI) scores (a standardized system used to grade an individual’s degree of severity on a scale from 0 to 7262) were used in this analysis. Prior to log-transforming and adjusting individual severity measure values for age and sex (using linear model residuals), we added 1 to each EASI score to avoid taking the log10 of 0. A Box-Cox transformation with a λ of 1.5 was applied to the RL score to normalize the distribution. To assess prediction of moderate and severe AD, we classified individuals in the ADRN based on their adjusted EASI scores relative to the following definition of severity strata: clear = 0.0, 0.0 < mild < 6.0, 6.0 ≤ moderate < 23.0, 23.0 ≤ severe ≤ 72.0,63 transformed to the log10(EASI+1) scale. The distribution of AD severity is illustrated in Fig E1 and classification totals of the 1619 individuals are as follows: control, 345; clear AD, 2; mild AD, 447; moderate AD, 597; severe AD, 228. Finally, we tested for association between genetic principal components and PRSs (see Table E6 in this article’s Online Repository at www.jacionline.org).
RESULTS
PRS Model Selection
Accuracy of the various AD PRS models are summarized in Figs E5 to E10 and Table E7 in this article’s Online Repository (available at www.jacionline.org). Using LDpred’s default array of thresholds for P values (P+T models) and proportion of causal variants (LDpred models), AD was best predicted by the LDpred model with the proportion of causal markers set to 0.03 (Fig E3). The worst performing models included the P+T models with highly stringent thresholds (eg, P = 1 × 10⁻⁷). The most inclusive models, such as the LDpred infinitesimal and P+T P = 1 models, fell in between. These results regarding model selection suggest that there is some middle ground for how many variants with weak effect sizes are relevant toward the prediction of AD.
PRSAD, PRSAD+, and PRSAD++
The standardized PRSAD followed a normal distribution and ranged 7.74 SD units from −2.62 to 5.12 (Fig 2). The model had an AUC of 0.64, describing a 0.64 probability that the PRS model is able to correctly distinguish between AD cases and controls, based solely on PRS and no other clinical risk factors. When comparing controls to only individuals with severe AD, the AUC increased to 0.70.
FIG 2.
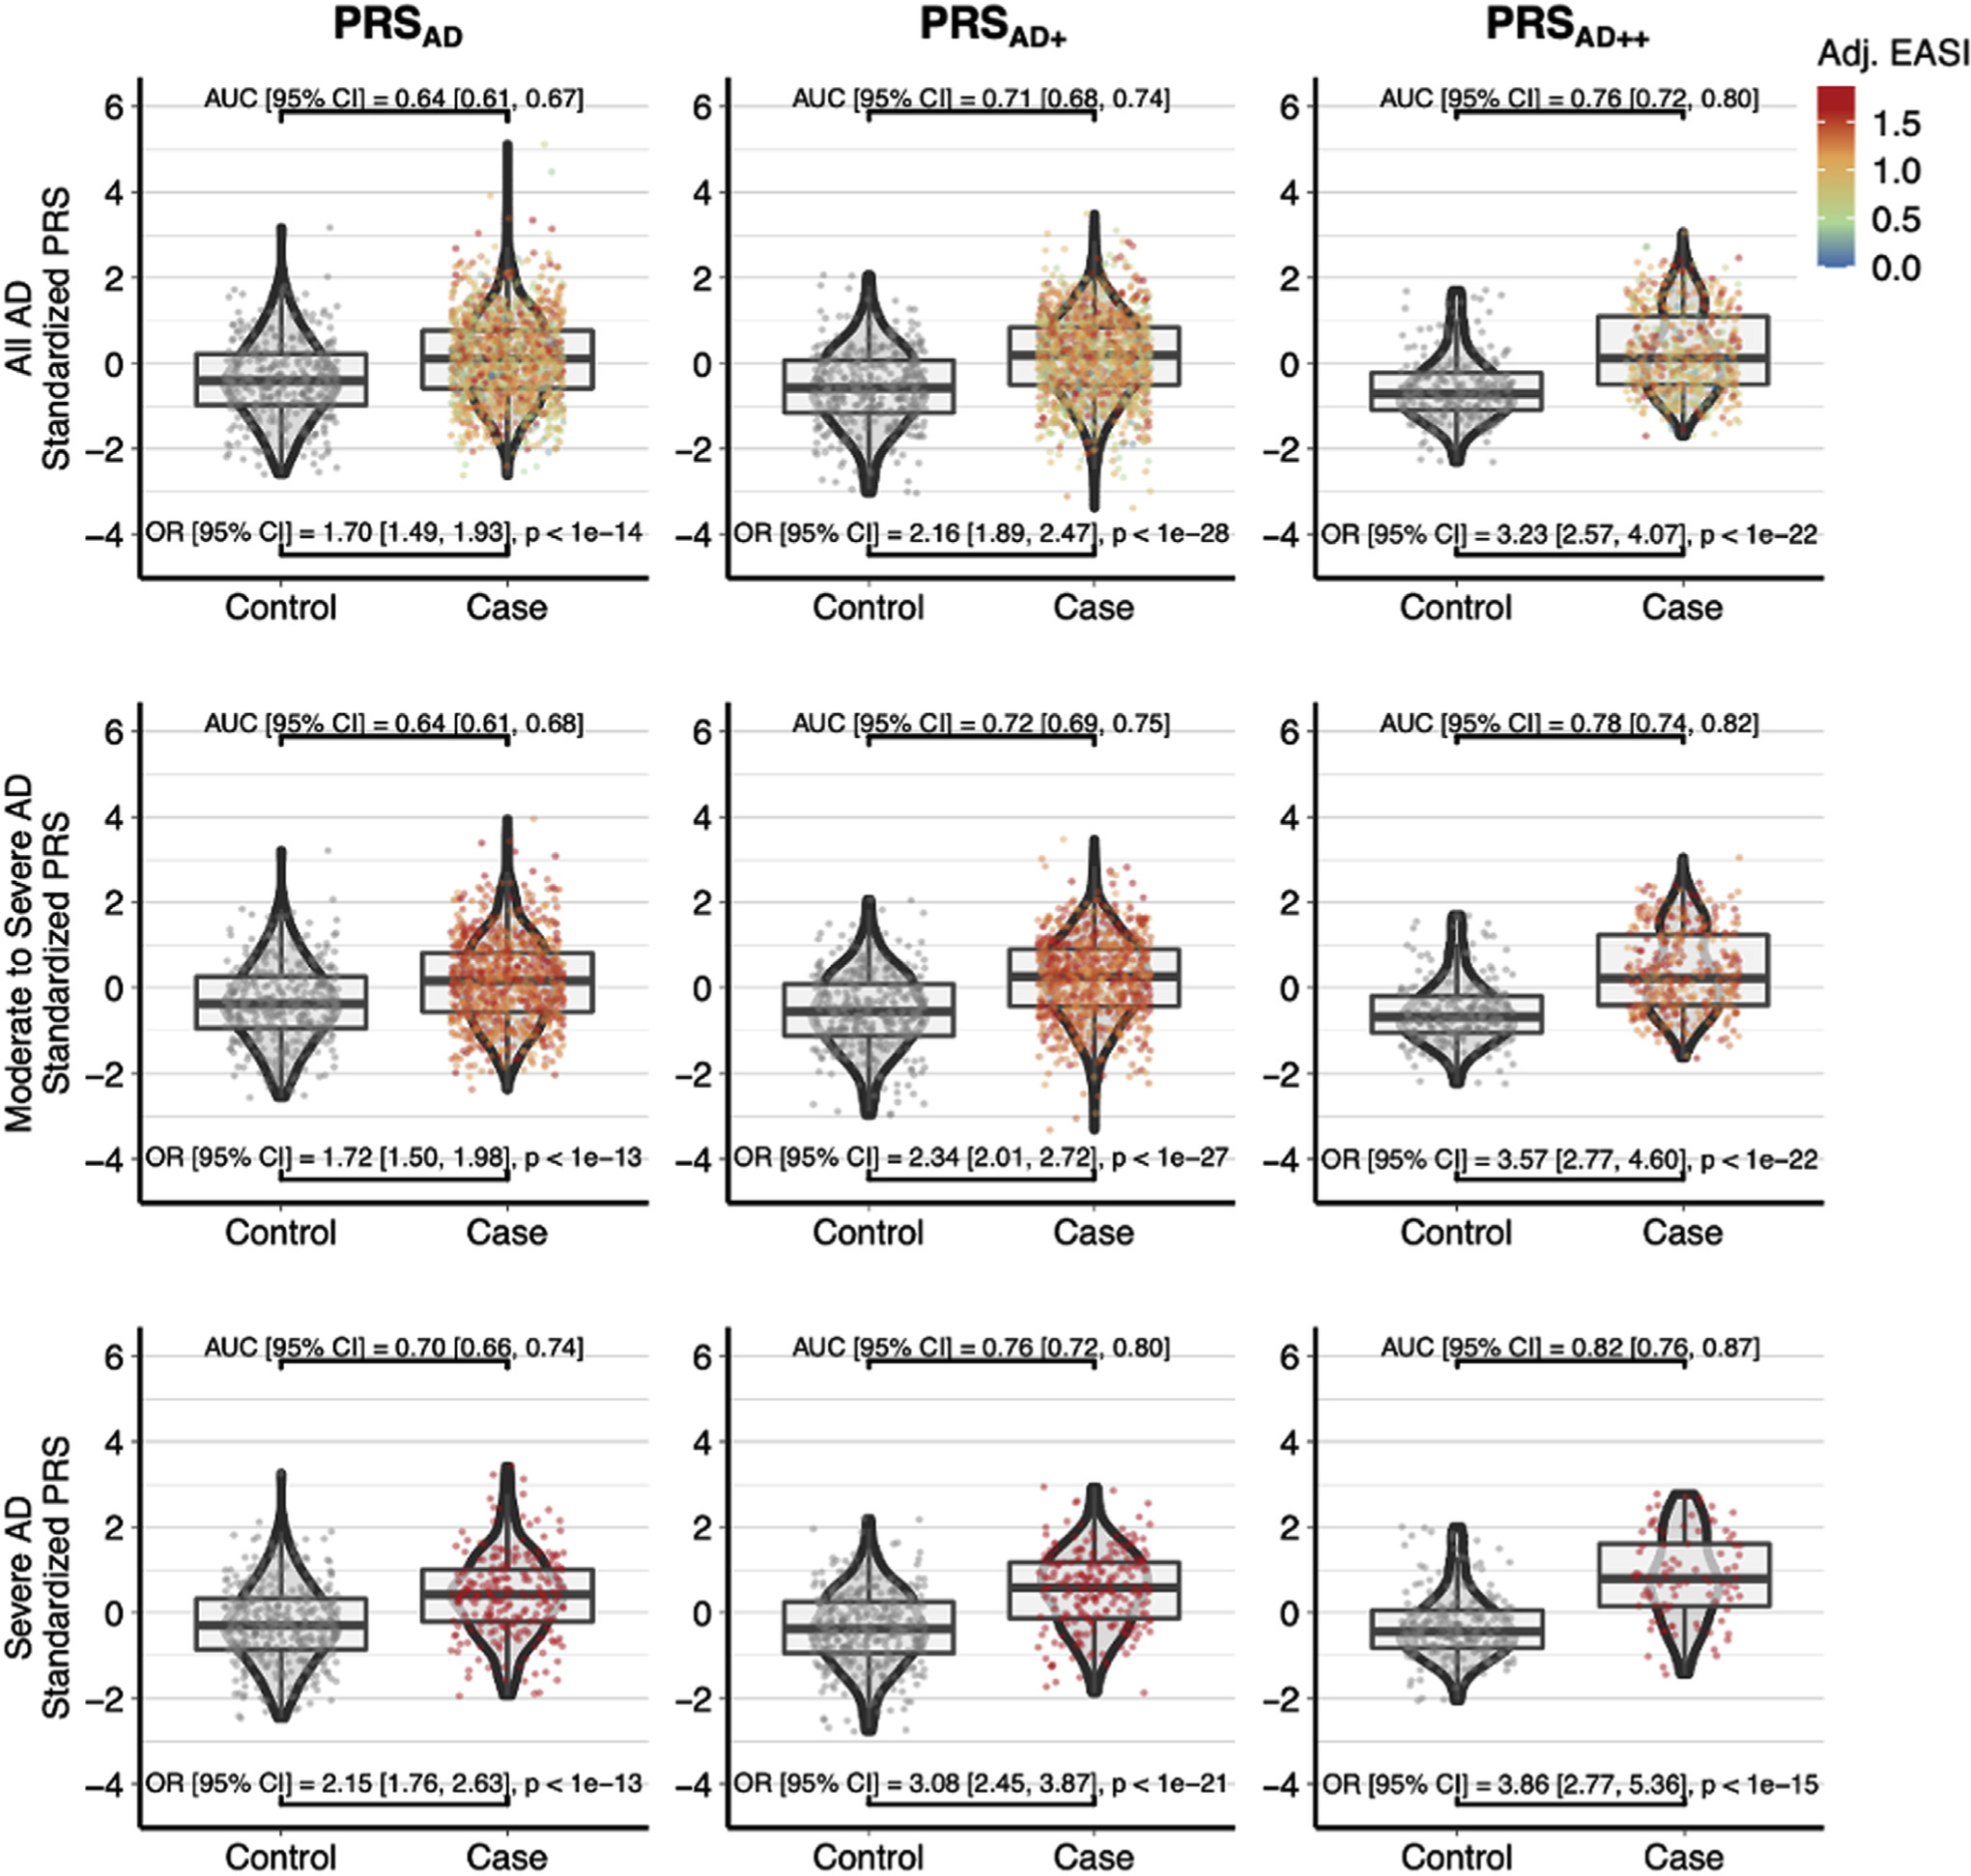
PRSAD PRSAD+, and PRSAD++. There is increased separation between cases and controls from left to right with the addition of related GWAS (PRSAD+) and FLG mutations (PRSAD++) and from top to bottom with increasing AD severity. The bottom right plot of PRSAD++ for severe AD versus controls has no interquartile overlap and an AUC of 0.82.
With the addition of related phenotypes in the common factor training dataset (PRSAD+) the AUC improved from 0.64 to 0.71, and further combining this score with the FLG genetic risk score shown in Fig E9 yielded a larger AUC of 0.76 (PRSAD++). Moreover, the scores explained most of the single nucleotide polymorphism–based heritability (h2SNP) (PRSAD+: Nagelkerke R2 = 0.132 and McFadden R2 = 0.086) captured by the training AD GWAS (h2SNP = 0.135) (Table E1). In terms of effect size, the PRSAD produced an OR of 1.70 (95% CI, 1.49–1.93) that improved to 3.23 (95% CI, 2.57–4.47) for the PRSAD++. These standardized PRSs are equivalent to Z-scores and a 1-unit SD increase in the PRSAD++ corresponded to an OR of 3.23 and a 3-unit SD increase resulted in an OR of 3.233 or 33.7. When including both age and sex as covariates, the AUC for PRSAD improved from 0.64 to 0.71, the AUC for PRSAD+ improved from 0.71 to 0.75, and the AUC for PRSAD++ improved from 0.76 to 0.80 (see Table E8 in this article’s Online Repository at www.jacionline.org).
When comparing PRS quantiles in Fig 3, we found that belonging to the upper quantiles (60%-100%) relative to the middle quantile (40%-50%) trended with an OR >1, and this trend strengthened for PRSAD+ and PRSAD++. The lower quantiles (0%-40%) followed this trend with ORs consistently <1. Notably, the PRSAD++ quantile plot illustrates that belonging to the top quantile relative to belonging to the middle quantile had a large OR of 10.56 (95% CI, 3.01–36.99) (Fig 3, top right).
FIG 3.
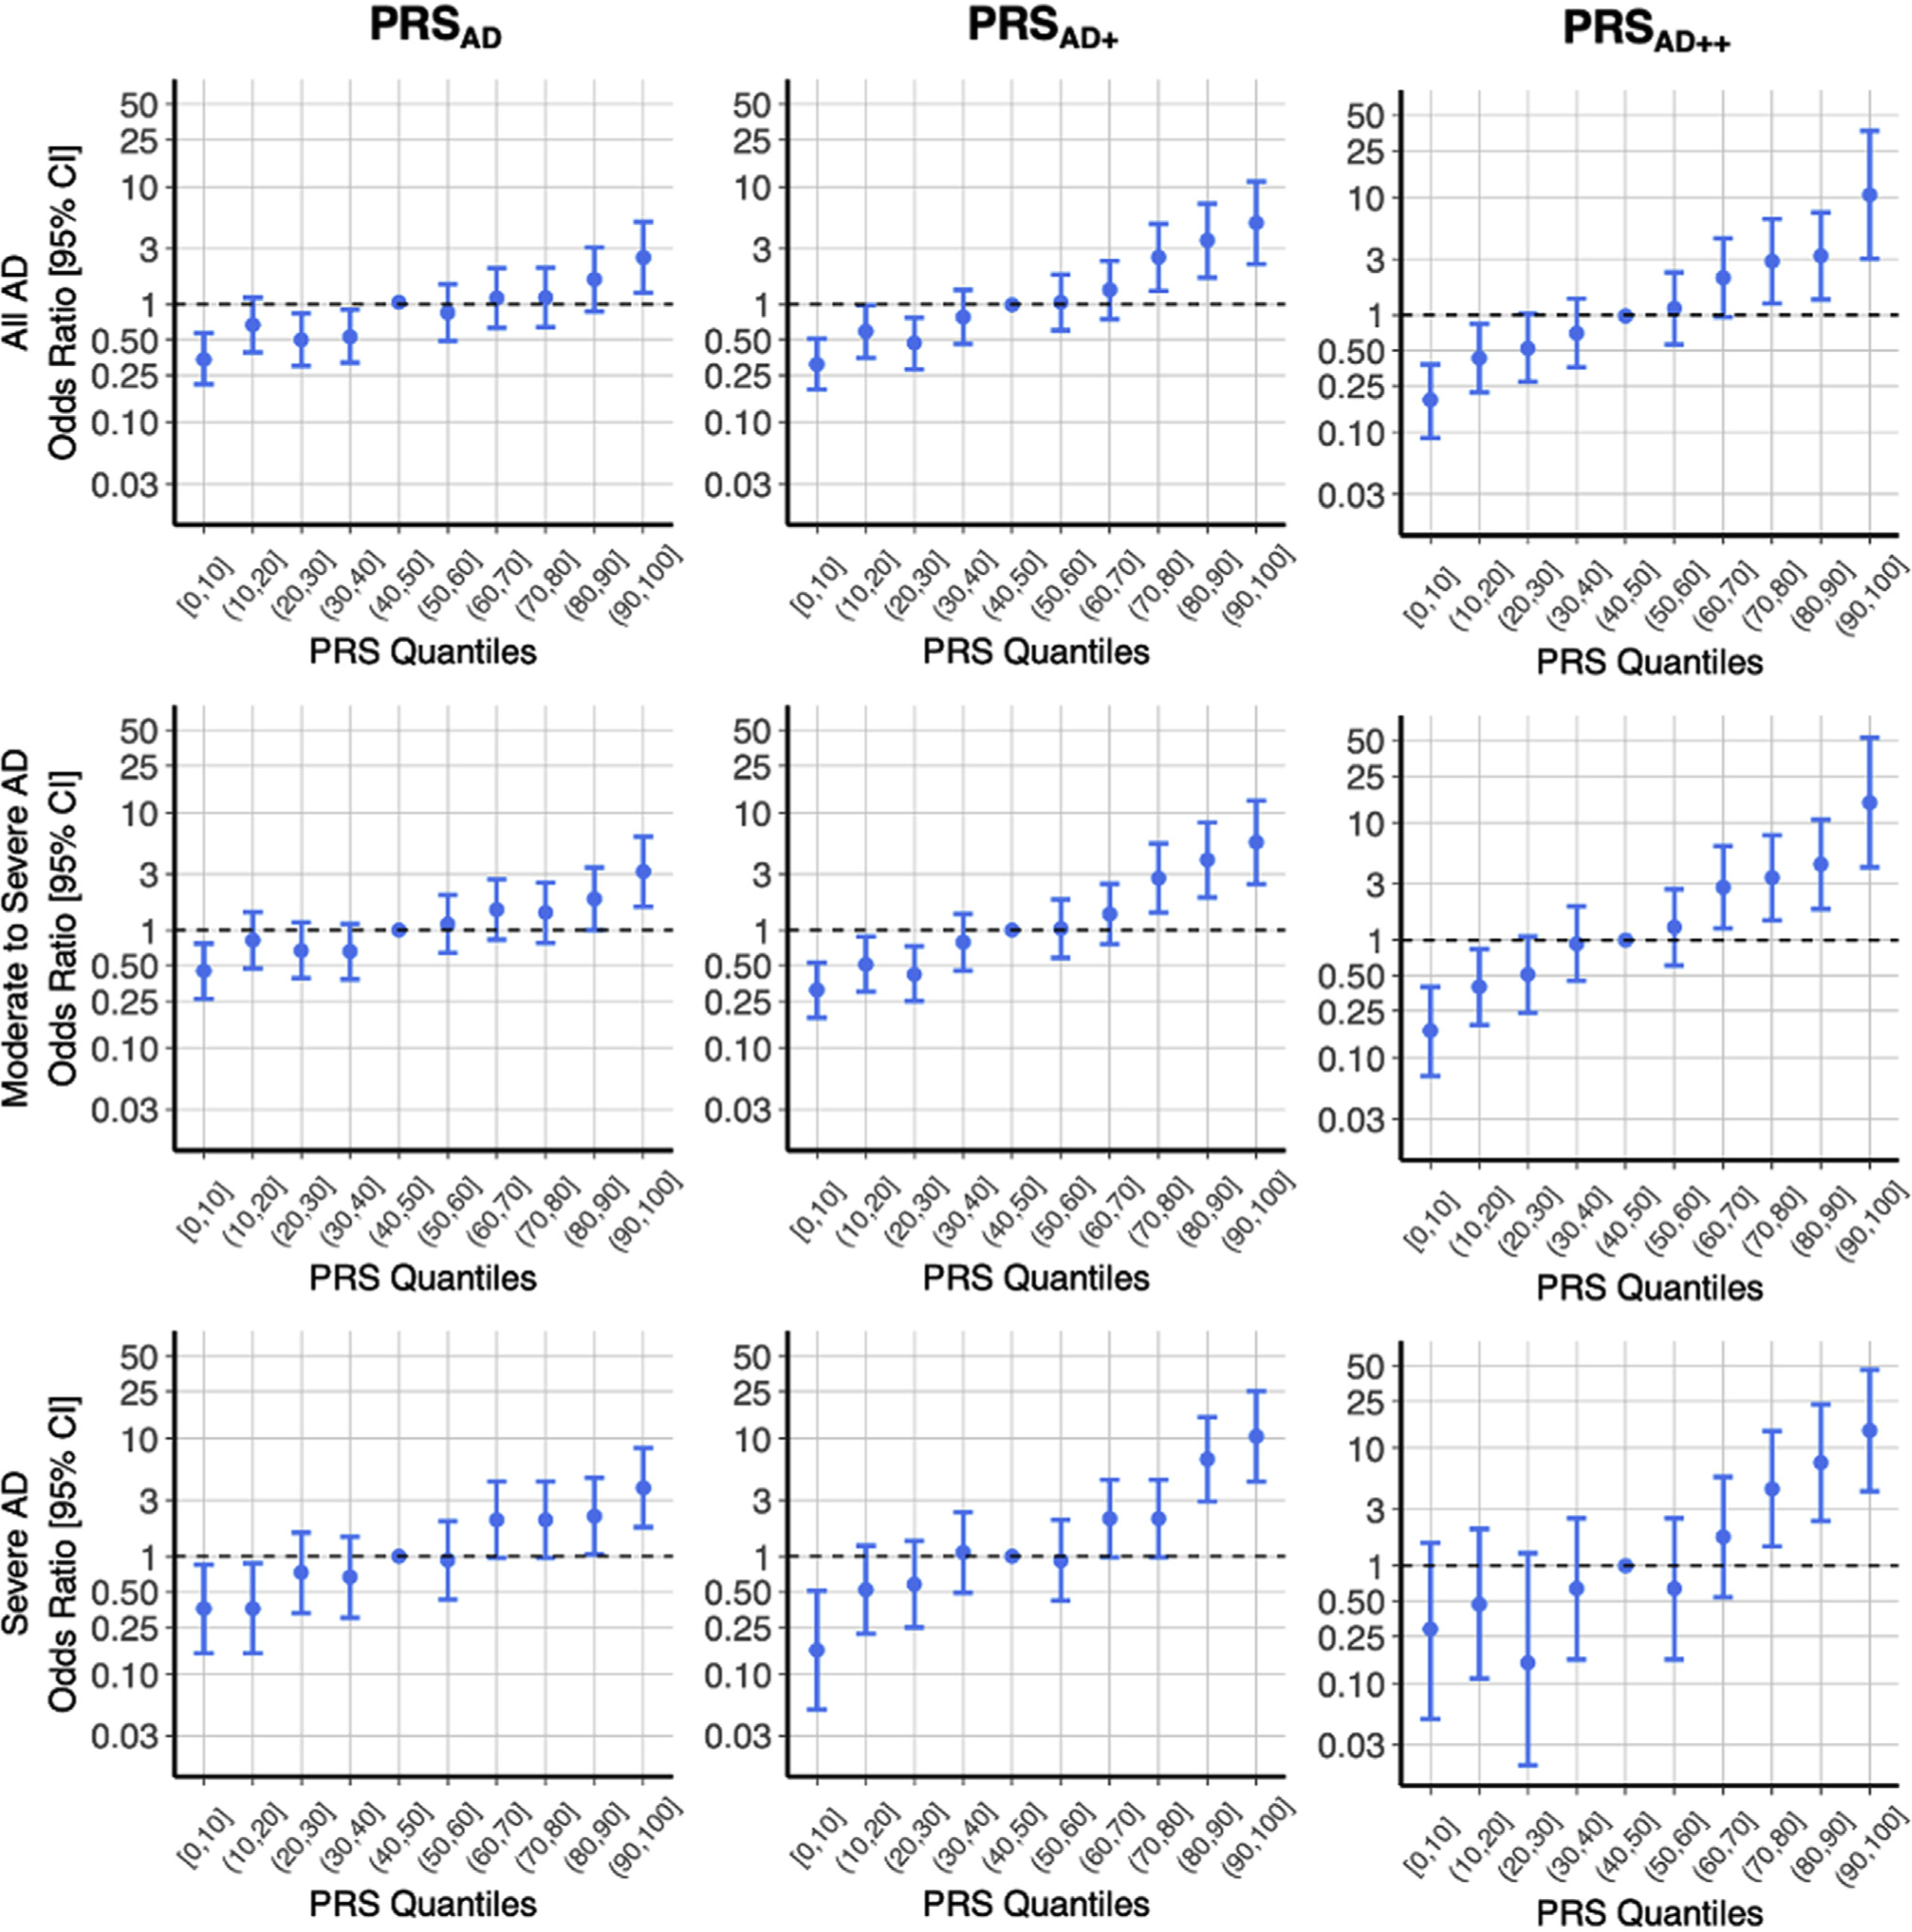
Quantile plots describe ORs and 95% CIs for each quantile relative to the median quantile (40%, 50%) as a predictor of AD case status. Noting the nonlinear spacing of tick marks on the log-transformed y-axis, the ORs illustrate the most distinction at the extreme quantiles for the PRSAD++. There is notable ability of PRS–especially at the extremes–to distinguish between cases and controls for this complex disease.
PRS correlates with AD severity
In addition to tracking phenotypic outcomes, PRS was positively correlated with disease severity among individuals affected with AD (Table I). The linear model between log-transformed EASI and PRS had a positive β slope of 0.036 (95% CI, 0.015–0.057; P < .001). All regressions between PRS and severity measures (EASI, total serum IgE, eosinophils, RL) and age of onset were statistically significant. The R2 increased for each severity measure along the progression from PRSAD to PRSAD+ to PRSAD++.
TABLE I.
PRSAD, PRSAD+, and PRSAD++ versus adjusted severity measures
| Linear model | Adjusted R2 | β (95% CI) | P value | ||
|
| |||||
| Adjusted EASI | |||||
| ~ PRSAD | 0.008 | 0.036 (0.015–0.057) | 9.12 3 10−4 | ||
| ~ PRSAD+ | 0.012 | 0.044 (0.022–0.066) | 7.66 3 10−5 | ||
| ~ PRSAD++ | 0.028 | 0.068 (0.035–0.102) | 6.55 3 10−5 | ||
| Adjusted total IgE | |||||
| ~ PRSAD | 0.045 | 0.181 (0.140–0.222) | 7.93 3 10−18 | ||
| ~ PRSAD+ | 0.061 | 0.209 (0.169–0.250) | 1.33 3 10−23 | ||
| ~ PRSAD++ | 0.136 | 0.349 (0.286–0.412) | 1.85 3 10−25 | ||
| Adjusted total eosinophils | |||||
| ~ PRSAD | 0.016 | 0.061 (0.038–0.084) | 2.1 3 10−7 | ||
| ~ PRSAD+ | 0.054 | 0.111 (0.088–0.133) | 1.77 3 10−21 | ||
| ~ PRSAD++ | 0.068 | 0.120 (0.089–0.152) | 2.23 3 10−13 | ||
| Adjusted RL | |||||
| ~ PRSAD | 0.005 | 0.294 (0.073–0.515) | 9.06 3 10−3 | ||
| ~ PRSAD+ | 0.010 | 0.436 (0.210–0.661) | 1.60 3 10−4 | ||
| ~ PRSAD++ | 0.018 | 0.557 (0.217–0.896) | 1.35 3 10−3 | ||
|
| |||||
| Logistic regression model | McFadden R2 | Nagelkerke R2 | AUC | OR (95% CI) | P value |
|
| |||||
| Infant age of onset | |||||
| ~ PRSAD | 0.023 | 0.041 | 0.608 | 1.45 (1.30–1.62) | 1.14 3 10−11 |
| ~ PRSAD+ | 0.031 | 0.054 | 0.622 | 1.55 (1.39–1.73) | 9.37 3 10−15 |
| ~ PRSAD++ | 0.085 | 0.143 | 0.697 | 2.07 (1.75–2.44) | 1.10 3 10−17 |
Measures for EASI, total IgE, total eosinophils, and RL were transformed and adjusted for sex, batch, and age. See the Online Repository for further details. Infant age of onset refers to AD onset before 1 year of age.
FLG mutations and the PRSs
The PRSAD and PRSAD+ models segregated a considerable number of AD cases without considering LOF FLG mutations into the upper quantiles, and in Fig 4, we examine FLG carrier frequency by quantile for each PRS distribution (Fig 4). For PRSAD on the bottom left of Fig 4, there was a trend of increasing prevalence of FLG LOF carriers toward the upper quantiles (mean PRSAD without FLG mutation, −0.213; mean PRSAD with FLG mutation, 0.349; difference of means, 0.562; t-test P < 1 × 10⁻¹¹). In comparing the bottom left (PRSAD) and bottom middle plots (PRSAD+) of Fig 4, we did not observe an increase in separation of PRS by FLG carrier status (mean PRSAD+ without FLG mutation, −0.171; mean PRSAD+ with FLG mutation, 0.290; difference of means, 0.461; t-test P < 1 × 10⁻⁸). This was noteworthy because the progression from AD to PRSAD+ introduced a 0.64 to 0.71 (+0.07) improvement in AUC. Therefore, this improvement in accuracy from training on the common factor GWAS compared to the AD-only GWAS seemed to be driven by signals different from epidermal barrier deficiency via FLG LOF. As expected, by explicitly adding in the FLG indicator with PRSAD++, there was a distinct shift toward nearly all FLG LOF carriers being placed in the upper PRS quantiles (mean PRSAD++ without FLG mutation, −0.432; mean PRSAD++ with FLG mutation, 1.387; difference of means, 1.818; t-test P < 1 × 10⁻¹⁵) (bottom right of Fig 4) that resulted in a 0.71 to 0.76 (+0.05) improvement in AUC. Although the first 2 principal components were marginally correlated with PRSs, the principal components were not predictive of AD risk (see Table E6 in this article’s Online Repository at www.jacionline.org), suggesting that population substructure (as would be captured by these principal components) is not a significant contributor to the trend in enrichment of FLG mutation carriers in the top PRS quantile. An auxiliary analysis in which we compared genetic scores for the epidermal differentiation complex (EDC) versus scores excluding the EDC suggested that FLG variants stand out as the primary signal within the EDC (see the PRS and the EDC section in the Online Repository).
FIG 4.
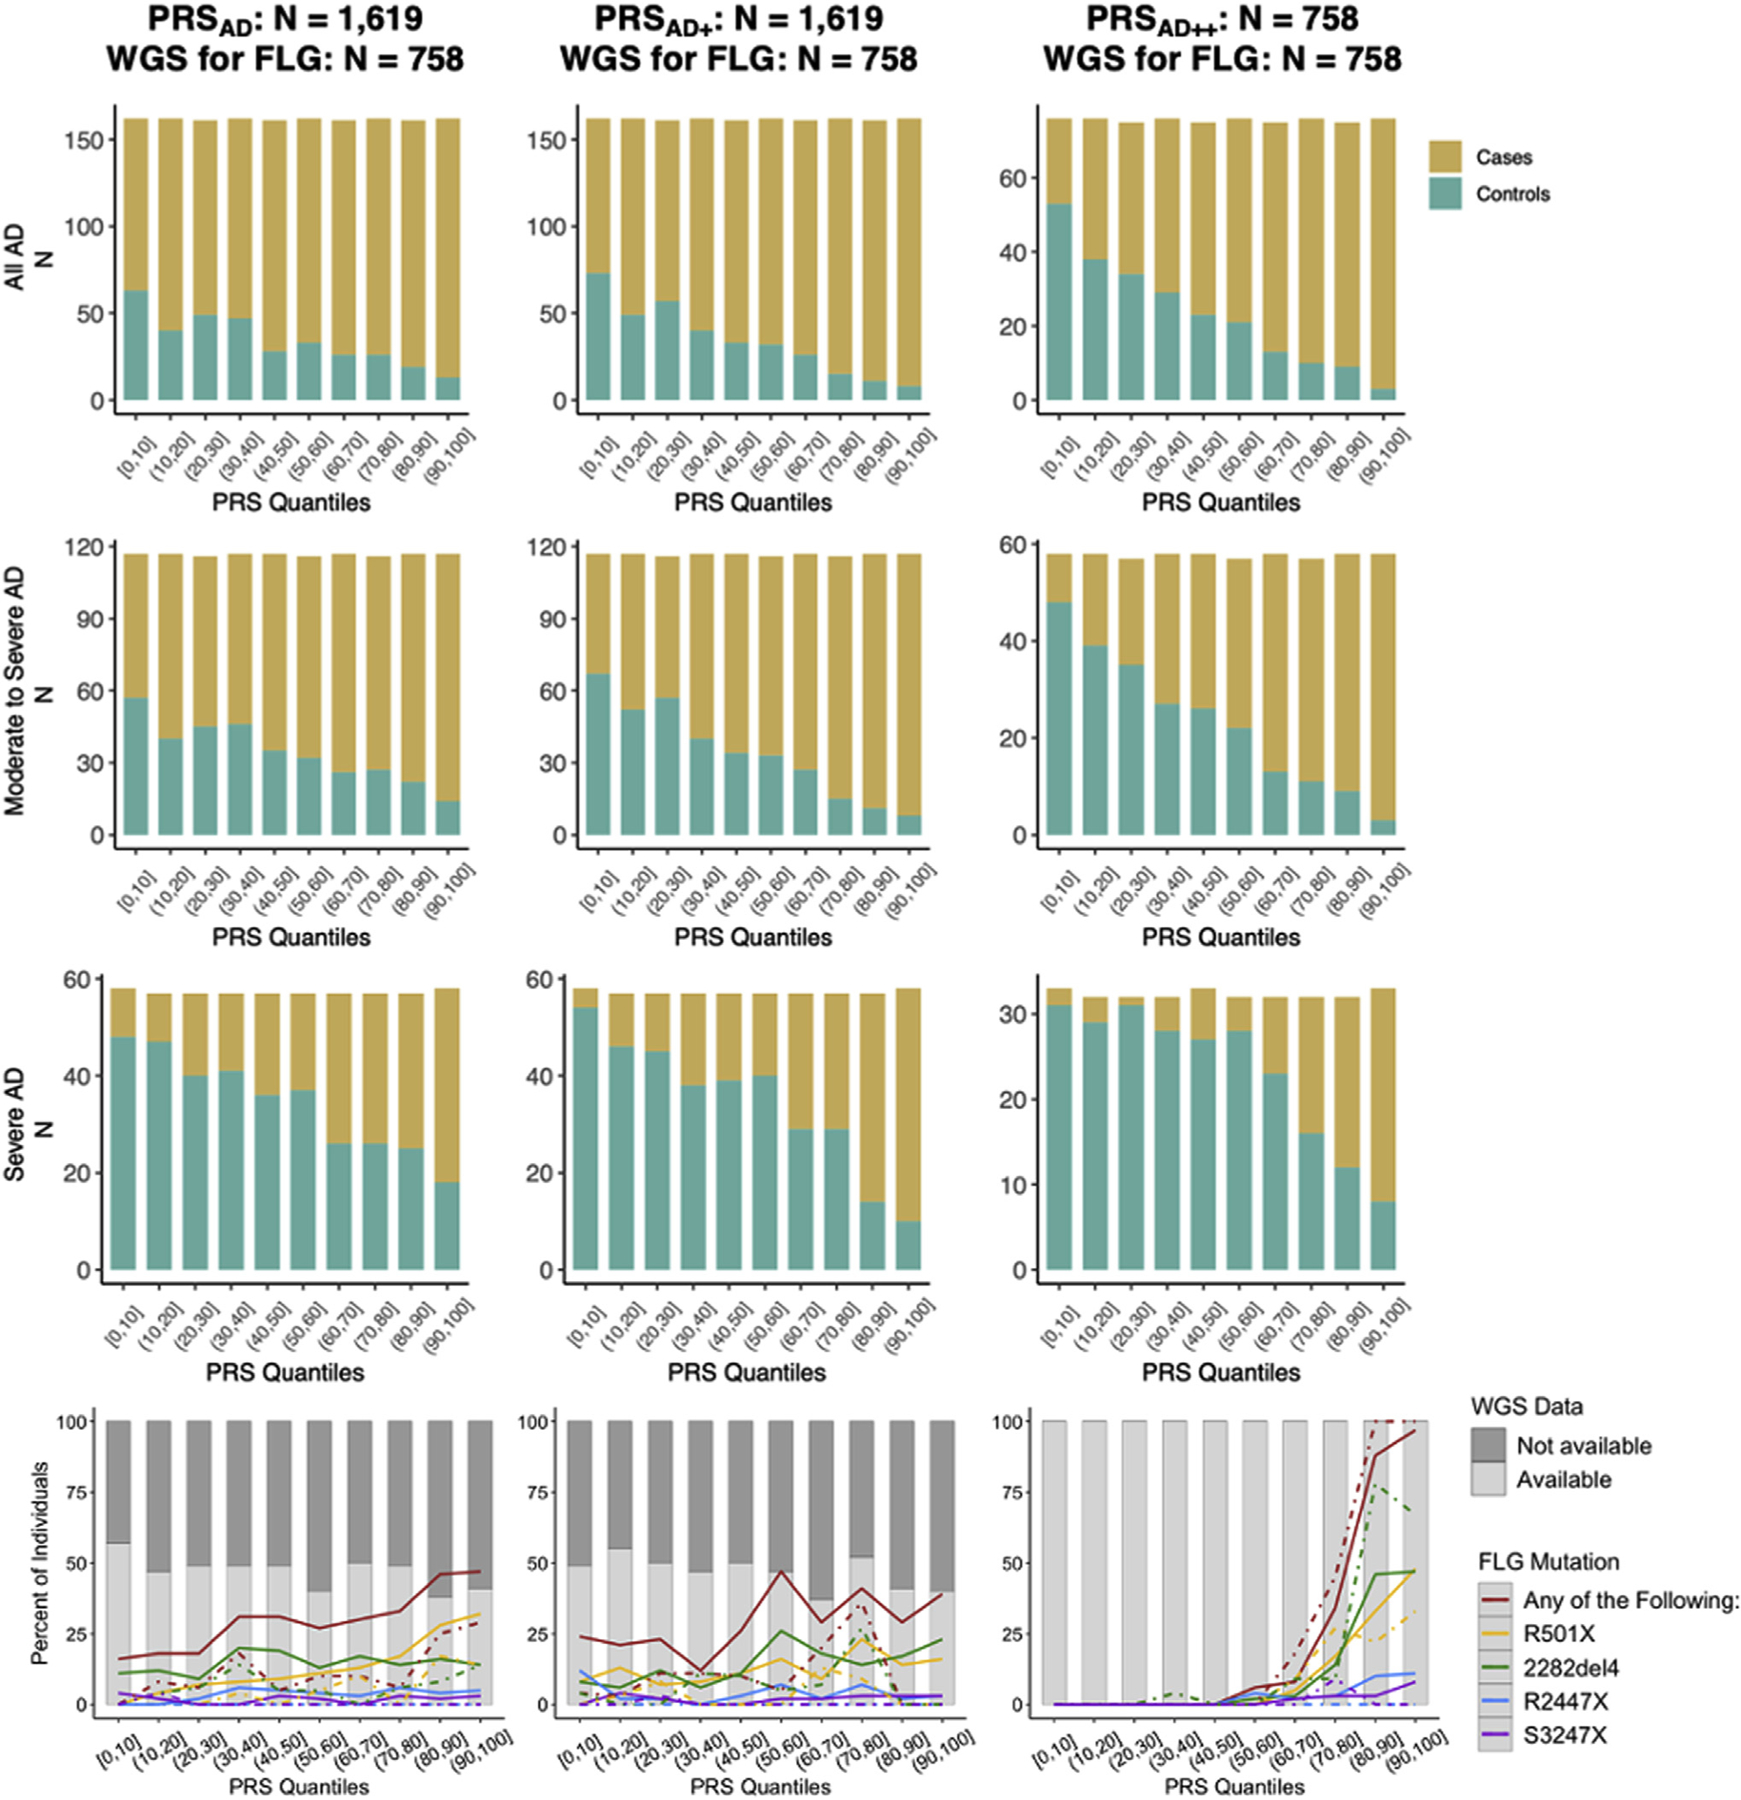
The top 3 × 3 stacked bar plots present the tally of cases and controls within each quantile of these PRS distributions. Cases tend to increase in frequency toward the upper quantiles while controls are increasingly common among the lower quantiles. This trend strengthens rightward (AD to AD+ to AD++) and downward (increased severity). In the bottom 3 plots, the gray bars in the background illustrate how roughly 50% of the individuals within each quantile had WGS data for investigation of the 4 FLG LOF genotypes. Among individuals with WGS data, the colored lines detail the percent of subjects who are carriers for R501X, 2282del4, R2447X, and S3247X; solid lines indicate percentage of cases, and dashed lines represent percentage of controls who are carriers within each quantile.
DISCUSSION
The present study quantifies predisposed genetic risk using multiple methods and training datasets. Consistent with those of Simard et al,29 our findings support the utility of using genetic scores to predict AD and to identify high-risk neonates. We illustrate how prediction accuracy can be optimized through the improvements across PRSAD, PRSAD+, and PRSAD++. Specifically, the PRSAD++ model outlines the utility of a training dataset that includes related atopic phenotypes, and the PRSAD++ model emphasizes the distinct signal of FLG LOF variants. Comparing these 3 genetic scores furthers our understanding of the complex genetic architecture underlying AD (through the evaluation of FLG vs non-FLG genetic components, multiple training datasets, and model selection across an array of causal variant thresholds) and quantifies the association between genetics and disease severity.
The ability to identify high-risk individuals at an early age might open the door for preventative measures, and 3 small, randomized trials have suggested a reduced risk of AD development by 32% to 50% from the daily application of emollients in the first few months of life.32–34 However, subsequent studies in larger cohorts failed to substantiate these findings of reduced risk of AD and dampened enthusiasm for easy-to-use and low-cost40 topical therapies.41–43 Investigators continue to study the utility of emollients for AD prevention,44,45 and there remains a need for high-quality data on the efficacy of primary prevention strategies.46 AD clinical trials have commonly used family history to identify high-risk infants, and the addition of PRS would enhance the accuracy of inclusion criteria for future studies. For example, PRS might be useful in investigating whether the efficacy of emollient therapy differs as a function of genetic determinants of skin barrier dysfunction compared to patients with low genetic risk and/or an AD phenotype primarily driven by TH2 cell imbalance. In addition, the positive correlation between PRS and AD severity suggests that PRS could be used to better understand the genetic predisposition to not only the development of AD, but also its severity. As exemplified by the AUCs calculated (without covariates) for food allergy (0.74), asthma (0.69), and allergic rhinitis (0.69) by Simard et al,29 PRS of AD has a broad scope of potential utility for predicting other allergic diseases as well.
In the context of clinical applications of PRS, there are imperative considerations regarding the social inequality of PRS-informed treatment options.64 As has been pointed out by many in the field, a critical ethical consideration of PRS stems from evidence that PRS can be biased and unreliable when there is misalignment between ethnicities of the target population and the GWAS.65 We are alarmed by the lack of non-European GWASs pertaining to AD and related phenotypes because the power harnessed in the large sample sizes from these external training datasets is essential to generating meaningful PRS calculations. This concern is compounded by increased morbidity of AD in ethnic minorities such as African Americans37 and evidence that AD likely has differing genetic architecture across ethnicities; for example, multiple studies have noted the differences in frequencies of FLG mutations associating with AD in individuals of European and non-European ancestry.66–69
Another limitation of our study lies in the definition of cases and controls. The inclusion criteria for cases might be biased toward including persistent AD rather than early infancy or transient AD. As aforementioned, all of the controls in this study were nonatopic, and this greatly limited our ability to disentangle atopy versus risk for AD. On one hand, these limitations might explain why the general allergy GWAS (Fig E6) was a more effective training dataset than the AD GWAS was (although some of the increase in prediction accuracy is likely due to the general allergy GWAS having an effective sample size ~2.3 times larger than that of the AD GWAS). In addition, some ADRN subjects have related comorbidities (51% of AD cases and 0% of controls are asthmatic) that might inflate the accuracy of these PRSs within the context of the atopic march. The comorbid nature of atopic diseases and the increased accuracy from the general allergy training dataset might be explained by recent findings showing AD and allergy sensitization are strong atopic disease risk markers early in life.70
Identifying ideal control subjects for AD is a pervasive challenge: when using population-based controls, it is extremely difficult to ascertain when AD onset can occur throughout one’s life span, and both atopy and AD are common diseases in the general population. While population controls are commonly used in GWAS for gene discovery, we note the challenges here in evaluating true prediction accuracy. Because our primary measures of severity (EASI and RL) were measured at the time of enrollment, it is important to acknowledge that severity ratings might vary over time and depend on the course of treatment (eg, a patient who needs systemic medications to achieve a mild EASI score is not mild but severe).
In the future, we hope to see further improvements in the predictive accuracy and breadth of these genetic models. Specifically, we urge the following areas of potential growth:
Larger effective GWAS sample sizes (of all ethnicities) will improve the accuracy of training datasets. Increasing effective sample sizes from tens of thousands to hundreds of thousands could greatly improve PRS accuracy of AD.
High standards for GWAS phenotype accuracy, as we suspect that the notable differences between the meta-analyzed summary statistics may be attributable to variable case definitions (eg, doctor diagnosed vs self-reported). This includes better coverage and distinction of subphenotypes of AD within the GWAS catalog.
AD outcomes are heavily influenced by the environment, and prediction could be improved by incorporating nongenetic covariates into these PRS models. While we explicitly focused on assessing genetic scores and their correlations with severity measures, covariates (that would be available for neonates) such as age, sex, and parents’ ethnicity have been shown to be useful for the prediction of AD.29 In our study, age was a more informative covariate than sex, and the inclusion of both variables as covariates in the model improved the AUCs for PRSAD by +0.07, PRSAD+ by +0.04, and PRSAD++ by +0.0 4(se eTabl eE 8i nthis article’s Online Repository at www.jacionline.org). Downstream measures such as total serum IgE or total eosinophil count would substantially improve model accuracy and likely result in almost perfect case-control separation (given the nonatopic control definition), leaving little room to assess the role of genetically derived risk.
The implementation of developing possibly superior statistical scoring methods71–73 might allow for models that are even more specifically tailored to the complex genetic architecture of AD.
Large non-European training GWAS datasets and new PRS modeling approaches suited for admixed populations need to be developed and implemented (see the Online Repository for auxiliary PRS analysis in African Americans).
In conclusion, this study presents a thorough framework for the genetic prediction of complex disease. We reason that methods of AD care could greatly benefit from applications of genetic scoring and that there is room to grow in our ability to optimally predict AD. AD PRS associates with AD severity and was improved with a common factor GWAS of AD, childhood-onset asthma, and general allergic disease exemplifying the entangled genetic architecture of atopic diseases. While polygenic scoring could play a special role in identifying high-risk individuals without FLG mutations, these variants continue to be a primary focus for atopic disease prediction.
Supplementary Material
Clinical implications: A genetic risk model combining AD and atopy-related genetic variants with FLG LOF indicators could identify high-risk neonates for targeted therapies to prevent the onset (or severity) of AD.
Acknowledgments
We thank all study subjects and 23andMe their participation along with Corey Cox and Tonya M. Brunetti for technical suggestions, John Finigan for computational resource support, and Olivia Lira for technical assistance.
Funding for this work was provided by the National Institutes of Health/National Institute of Allergy and Infectious Disease (grant U19 AI117673), the Atopic Dermatitis Research Network, and the Oregon National Primate Research Center (grant 8P51 OD011092 [to M.K.S.]).
Disclosure of potential conflict of interest: R.L. Gallo is a board member of MatriSys and Bioscience; has received a consulting fee from Sente; has pending grants through Novan and Regeneron; and has stock in Sente and MatriSys. L.C. Schneider is an investigator for Regeneron and DBV Technologies; a consultant for Amagma, Alladapt, and Ukko; and has grants from Genentech and Pfizer. A.S. Paller has been a consultant for AbbVie, Boehringer Ingelheim, Dermira, Eli Lilly, Forte, Galderma, LEO Pharma, Novartis, Pfizer, Regeneron, and Sanofi Genzyme; and an investigator for AbbVie, Eli Lilly, Incyte, LEO Pharma, Novartis, and Regeneron. L.A. Beck is a consultant for AbbVie, Allakos, AstraZeneca, Benevolent AIBio, Incyte, Janssen, Leo Pharma, Lilly, Naos Bioderma, Novartis, Pfizer, Principia Biopharma, Rapt Therapeutics, Regeneron, Sanofi/Genzyme, Sanofi-Aventis, UCB, and Vimalan; is an investigator for AbbVie, AstraZeneca, Kiniksa, Leo Pharma, Pfizer, Regeneron, and Sanofi; and has stock in Medtronics, Moderna, and Gilead. C. R. Gignoux has stock in 23andMe. K.C. Barnes receives royalties from UpToDate. The rest of the authors declare that they have no relevant conflicts of interest.
Abbreviations used
- AD
Atopic dermatitis
- AUC
Area under the curve
- EASI
Eczema Area and Severity Index
- EDC
Epidermal differentiation complex
- GRS
Genetic risk score
- GWAS
Genome-wide association study
- LD
Linkage disequilibrium
- LOF
Loss of function
- OR
Odds ratio
- P+T
P value thresholding
- PRS
Polygenic risk score
- RL
Rajka Langeland (score)
REFERENCES
- 1.Hanifin JM, Reed ML, Prevalence E, Group IW. A population-based survey of eczema prevalence in the United States. Dermatitis 2007;18:82–91. [DOI] [PubMed] [Google Scholar]
- 2.Shaw TE, Currie GP, Koudelka CW, Simpson EL. Eczema prevalence in the United States: data from the 2003 National Survey of Children’s Health. J Invest Dermatol 2011;131:67–73. [DOI] [PMC free article] [PubMed] [Google Scholar]
- 3.Deckers IAG, McLean S, Linssen S, Mommers M, van Schayck CP, Sheikh A. Investigating international time trends in the incidence and prevalence of atopic eczema 1990–2010: a systematic review of epidemiological studies. PLoS One 2012;7:e39803. [DOI] [PMC free article] [PubMed] [Google Scholar]
- 4.Drucker AM, Wang AR, Li W-Q, Sevetson E, Block JK, Qureshi AA. The burden of atopic dermatitis: summary of a report for the National Eczema Association. J Invest Dermatol 2017;137:26–30. [DOI] [PubMed] [Google Scholar]
- 5.Bickers DR, Lim HW, Margolis D, Weinstock MA, Goodman C, Faulkner E, et al. The burden of skin diseases: 2004: a joint project of the American Academy of Dermatology Association and the Society for Investigative Dermatology. J Am Acad Dermatol 2006;55:490–500. [DOI] [PubMed] [Google Scholar]
- 6.Smith Begolka W, Chovatiya R, Thibau IJ, Silverberg JI. Financial burden of atopic dermatitis out-of-pocket health care expenses in the United States. Dermatitis 2021. Jan 14 [E-pub ahead of print]. 10.1097/DER.0000000000000715. [DOI] [PMC free article] [PubMed] [Google Scholar]
- 7.Chiesa Fuxench ZC, Block JK, Boguniewicz M, Boyle J, Fonacier L, Gelfand JM, et al. Atopic Dermatitis in America study: a cross-sectional study examining the prevalence and disease burden of atopic dermatitis in the US adult population. J Invest Dermatol 2019;139:583–90. [DOI] [PubMed] [Google Scholar]
- 8.Silverberg JI, Gelfand JM, Margolis DJ, Boguniewicz M, Fonacier L, Grayson MH, et al. Patient burden and quality of life in atopic dermatitis in US adults: a population-based cross-sectional study. Ann Allergy Asthma Immunol 2018;121: 340–7. [DOI] [PubMed] [Google Scholar]
- 9.Barnes KC. An update on the genetics of atopic dermatitis: scratching the surface in 2009. J Allergy Clin Immunol 2010;125:16–31. [DOI] [PMC free article] [PubMed] [Google Scholar]
- 10.Kantor R, Silverberg JI. Environmental risk factors and their role in the management of atopic dermatitis. Exp Rev Clin Immunol 2017;13:15–26. [DOI] [PMC free article] [PubMed] [Google Scholar]
- 11.Paternoster L, Standl M, Waage J, Baurecht H, Hotze M, Strachan DP, et al. Multiancestry genome-wide association study of 21,000 cases and 95,000 controls identifies new risk loci for atopic dermatitis. Nat Genet 2015;47:1449–56. [DOI] [PMC free article] [PubMed] [Google Scholar]
- 12.Ober C, Yao T-C. The genetics of asthma and allergic disease: a 21st century perspective. Immunol Rev 2011;242:10–30. [DOI] [PMC free article] [PubMed] [Google Scholar]
- 13.Bataille V, Lens M, Spector TD. The use of the twin model to investigate the genetics and epigenetics of skin diseases with genomic, transcriptomic and methylation data. J Eur Acad Dermatol Venereol 2012;26:1067–73. [DOI] [PubMed] [Google Scholar]
- 14.Bantz SK, Zhu Z, Zheng T. The atopic march: progression from atopic dermatitis to allergic rhinitis and asthma. J Clin Cell Immunol 2014;5:202. [DOI] [PMC free article] [PubMed] [Google Scholar]
- 15.Davidson WF, Leung DYM, Beck LA, Berin CM, Boguniewicz M, Busse WW, et al. Report from the National Institute of Allergy and Infectious Diseases workshop on "Atopic dermatitis and the atopic march: Mechanisms and interventions.". J Allergy Clin Immunol 2019;143:894–913. [DOI] [PMC free article] [PubMed] [Google Scholar]
- 16.Ferreira MA, Vonk JM, Baurecht H, Marenholz I, Tian C, Hoffman JD, et al. Shared genetic origin of asthma, hay fever and eczema elucidates allergic disease biology. Nat Genet 2017;49:1752. [DOI] [PMC free article] [PubMed] [Google Scholar]
- 17.Zhu Z, Lee PH, Chaffin MD, Chung W, Loh P-R, Lu Q, et al. A genome-wide cross-trait analysis from UK Biobank highlights the shared genetic architecture of asthma and allergic diseases. Nat Genet 2018;50:857–64. [DOI] [PMC free article] [PubMed] [Google Scholar]
- 18.Kanchan K, Clay S, Irizar H, Bunyavanich S, Mathias RA. Current insights into the genetics of food allergy. J Allergy Clin Immunol 2021;147:15–28. [DOI] [PMC free article] [PubMed] [Google Scholar]
- 19.Schmitt J, Schakel K, Schmitt N, Meurer M. Systemic treatment of severe atopic eczema: a systematic review. Acta Derm Venereol 2007;87:100–11. [DOI] [PubMed] [Google Scholar]
- 20.Beck LA, Boguniewicz M, Hata T, Schneider LC, Hanifin J, Gallo R, et al. Phenotype of atopic dermatitis subjects with a history of eczema herpeticum. J Allergy Clin Immunol 2009;124:260–9.e1-e7. [DOI] [PMC free article] [PubMed] [Google Scholar]
- 21.Simpson EL, Villarreal M, Jepson B, Rafaels N, David G, Hanifin J, et al. Patients with atopic dermatitis colonized with Staphylococcus aureus have a distinct phenotype and endotype. J Invest Dermatol 2018;138:2224–33. [DOI] [PMC free article] [PubMed] [Google Scholar]
- 22.Broccardo CJ, Mahaffey S, Schwarz J, Wruck L, David G, Schlievert PM, et al. Comparative proteomic profiling of patients with atopic dermatitis based on history of eczema herpeticum infection and Staphylococcus aureus colonization. J Allergy Clin Immunol 2011;127:186–93. [DOI] [PMC free article] [PubMed] [Google Scholar]
- 23.Wray NR, Kemper KE, Hayes BJ, Goddard ME, Visscher PM. Complex trait prediction from genome data: contrasting EBV in livestock to PRS in humans. Genetics 2019;211:1131–41. [DOI] [PMC free article] [PubMed] [Google Scholar]
- 24.Torkamani A, Wineinger NE, Topol EJ. The personal and clinical utility of polygenic risk scores. Nat Rev Genet 2018;19:581–90. [DOI] [PubMed] [Google Scholar]
- 25.Lambert SA, Abraham G, Inouye M. Towards clinical utility of polygenic risk scores. Hum Mol Genet 2019;28:R133–42. [DOI] [PubMed] [Google Scholar]
- 26.Khera AV, Chaffin M, Aragam KG, Haas ME, Roselli C, Choi SH, et al. Genome-wide polygenic scores for common diseases identify individuals with risk equivalent to monogenic mutations. Nat Genet 2018;50:1219–24. [DOI] [PMC free article] [PubMed] [Google Scholar]
- 27.Paternoster L, Savenije OEM, Heron J, Evans DM, Vonk JM, Brunekreef B, et al. Identification of atopic dermatitis subgroups in children from 2 longitudinal birth cohorts. J Allergy Clin Immunol 2018;141:964–71. [DOI] [PMC free article] [PubMed] [Google Scholar]
- 28.Johansson A, Rask-Andersen M, Karlsson T, Ek WE. Genome-wide association analysis of 350 000 Caucasians from the UK Biobank identifies novel loci for asthma, hay fever and eczema. Hum Mol Genet 2019;28:4022–41. [DOI] [PMC free article] [PubMed] [Google Scholar]
- 29.Simard M, Madore A-M, Girard S, Waserman S, Duan Q, Subbarao P, et al. Polygenic risk score for atopic dermatitis in the Canadian population. J Allergy Clin Immunol 2020;147:406–9. [DOI] [PubMed] [Google Scholar]
- 30.Clark H, Granell R, Curtin JA, Belgrave D, Simpson A, Murray C, et al. Differential associations of allergic disease genetic variants with developmental profiles of eczema, wheeze and rhinitis. Clin Exp Allergy 2019;49:1475–86. [DOI] [PMC free article] [PubMed] [Google Scholar]
- 31.Løset M, Brown SJ, Saunes M, Hveem K. Genetics of atopic dermatitis: from DNA sequence to clinical relevance. Dermatology 2019;235:355–64. [DOI] [PubMed] [Google Scholar]
- 32.Simpson EL, Chalmers JR, Hanifin JM, Thomas KS, Cork MJ, McLean WHI, et al. Emollient enhancement of the skin barrier from birth offers effective atopic dermatitis prevention. J Allergy Clin Immunol 2014;134:818–23. [DOI] [PMC free article] [PubMed] [Google Scholar]
- 33.Horimukai K, Morita K, Narita M, Kondo M, Kitazawa H, Nozaki M, et al. Application of moisturizer to neonates prevents development of atopic dermatitis. J Allergy Clin Immunol 2014;134:824–30.e6. [DOI] [PubMed] [Google Scholar]
- 34.Lowe AJ, Su JC, Allen KJ, Abramson MJ, Cranswick N, Robertson CF, et al. A randomized trial of a barrier lipid replacement strategy for the prevention of atopic dermatitis and allergic sensitization: the PEBBLES pilot study. Br J Dermatol 2018;178:e19–21. [DOI] [PubMed] [Google Scholar]
- 35.Bin L, Leung DYM. Genetic and epigenetic studies of atopic dermatitis. Allergy Asthma Clin Immunol 2016;12:52. [DOI] [PMC free article] [PubMed] [Google Scholar]
- 36.Boyle EA, Li YI, Pritchard JK. An expanded view of complex traits: from polygenic to omnigenic. Cell 2017;169:1177–86. [DOI] [PMC free article] [PubMed] [Google Scholar]
- 37.Daya M, Barnes KC. African American ancestry contribution to asthma and atopic dermatitis. Ann Allergy Asthma Immunol 2019;122:456–62. [DOI] [PMC free article] [PubMed] [Google Scholar]
- 38.Rodriguez E, Baurecht H, Herberich E, Wagenpfeil S, Brown SJ, Cordell HJ, et al. Meta-analysis of filaggrin polymorphisms in eczema and asthma: robust risk factors in atopic disease. J Allergy Clin Immunol 2009;123: 1361–70.e7. [DOI] [PubMed] [Google Scholar]
- 39.Pividori M, Schoettler N, Nicolae DL, Ober C, Im HK. Shared and distinct genetic risk factors for childhood-onset and adult-onset asthma: genome-wide and transcriptome-wide studies. Lancet Respir Med 2019;7:509–22. [DOI] [PMC free article] [PubMed] [Google Scholar]
- 40.Xu S, Immaneni S, Hazen GB, Silverberg JI, Paller AS, Lio PA. Cost-effectiveness of prophylactic moisturization for atopic dermatitis. JAMA Pediatr 2017;171: e163909. [DOI] [PubMed] [Google Scholar]
- 41.Chalmers JR, Haines RH, Bradshaw LE, Montgomery AA, Thomas KS, Brown SJ, et al. Daily emollient during infancy for prevention of eczema: the BEEP randomised controlled trial. Lancet 2020;395:962–72. [DOI] [PMC free article] [PubMed] [Google Scholar]
- 42.Skjerven HO, Rehbinder EM, Vettukattil R, LeBlanc M, Granum B, Haugen G, et al. Skin emollient and early complementary feeding to prevent infant atopic dermatitis (PreventADALL): a factorial, multicentre, cluster-randomised trial. Lancet 2020;395:951–61. [DOI] [PubMed] [Google Scholar]
- 43.Perrett KP, Peters RL. Emollients for prevention of atopic dermatitis in infancy. Lancet 2020;395:923–4. [DOI] [PubMed] [Google Scholar]
- 44.Lowe A, Su J, Tang M, Lodge CJ, Matheson M, Allen KJ, et al. PEBBLES study protocol: a randomised controlled trial to prevent atopic dermatitis, food allergy and sensitisation in infants with a family history of allergic disease using a skin barrier improvement strategy. BMJ Open 2019;9:e024594. [DOI] [PMC free article] [PubMed] [Google Scholar]
- 45.Kelleher MM, Cro S, Cornelius V, Axon E, Lodrup Carlsen KC, Skjerven HO, et al. Skincare interventions in infants for preventing eczema and food allergy. Cochrane Database Syst Rev 2021;2:CD013534. [DOI] [PMC free article] [PubMed] [Google Scholar]
- 46.Bawany F, Beck LA, Järvinen KM. Halting the march: primary prevention of atopic dermatitis and food allergies. J Allergy Clin Immunol Pract 2020;8:860–75. [DOI] [PMC free article] [PubMed] [Google Scholar]
- 47.O’Regan GM, Sandilands A, McLean WHI, Irvine AD. Filaggrin in atopic dermatitis. J Allergy Clin Immunol 2009;124:R2–6. [DOI] [PubMed] [Google Scholar]
- 48.Weidinger S, O’Sullivan M, Illig T, Baurecht H, Depner M, Rodriguez E, et al. Filaggrin mutations, atopic eczema, hay fever, and asthma in children. J Allergy Clin Immunol 2008;121:1203–9.e1. [DOI] [PubMed] [Google Scholar]
- 49.Sandilands A, Smith FJD, Irvine AD, Irwin McLean WH. Filaggrin’s fuller figure: a glimpse into the genetic architecture of atopic dermatitis. J Invest Dermatol 2007; 127:1282–4. [DOI] [PubMed] [Google Scholar]
- 50.Willer CJ, Li Y, Abecasis GR. METAL: fast and efficient meta-analysis of genome-wide association scans. Bioinformatics 2010;26:2190–1. [DOI] [PMC free article] [PubMed] [Google Scholar]
- 51.Lab Neale. GWAS round 2. August 1, 2018. Available at: http://www.nealelab.is/uk-biobank/. Accessed December 5, 2019.
- 52.Lloyd-Jones LR, Robinson MR, Yang J, Visscher PM. Transformation of summary statistics from linear mixed model association on all-or-none traits to odds ratio. Genetics 2018;208:1397–408. [DOI] [PMC free article] [PubMed] [Google Scholar]
- 53.Grotzinger AD, Rhemtulla M, de Vlaming R, Ritchie SJ, Mallard TT, Hill WD, et al. Genomic SEM provides insights into the multivariate genetic architecture of complex traits. bioRxiv 2018;305029. [DOI] [PMC free article] [PubMed] [Google Scholar]
- 54.Krapohl E, Patel H, Newhouse S, Curtis CJ, von Stumm S, Dale PS, et al. Multipolygenic score approach to trait prediction. Mol Psychiatry 2018;23:1368–74. [DOI] [PMC free article] [PubMed] [Google Scholar]
- 55.Mallard TT, Linner RK, Okbay A, Grotzinger AD, de Vlaming R, Meddens SFW, et al. Not just one p: multivariate GWAS of psychiatric disorders and their cardinal symptoms reveal two dimensions of cross-cutting genetic liabilities. bioRxiv 2019; 603134. [DOI] [PMC free article] [PubMed] [Google Scholar]
- 56.Johnston HR, Hu Y-J, Gao J, O’Connor TD, Abecasis GR, Wojcik GL, et al. Identifying tagging SNPs for African specific genetic variation from the African Diaspora Genome. Sci Rep 2017;7:46398. [DOI] [PMC free article] [PubMed] [Google Scholar]
- 57.Das S, Forer L, Schönherr S, Sidore C, Locke AE, Kwong A, et al. Next-generation genotype imputation service and methods. Nat Genet 2016;48:1284–7. [DOI] [PMC free article] [PubMed] [Google Scholar]
- 58.Vilhjalmsson Bjarni J, Yang J, Finucane Hilary K, Gusev A, Lindström S, Ripke S, et al. Modeling linkage disequilibrium increases accuracy of polygenic risk scores. Am J Hum Genet 2015;97:576–92. [DOI] [PMC free article] [PubMed] [Google Scholar]
- 59.Hsieh FY, Lavori PW, Cohen HJ, Feussner JR. An overview of variance inflation factors for sample-size calculation. Eval Health Prof 2003;26:239–57. [DOI] [PubMed] [Google Scholar]
- 60.Choi SW, Heng Mak TS, O’Reilly PF. A guide to performing polygenic risk score analyses. bioRxiv 2018;416545. [DOI] [PMC free article] [PubMed] [Google Scholar]
- 61.Hanley JA, McNeil BJ. The meaning and use of the area under a receiver operating characteristic (ROC) curve. Radiology 1982;143:29–36. [DOI] [PubMed] [Google Scholar]
- 62.Hanifin JM, Thurston M, Omoto M, Cherill R, Tofte SJ, Graeber M, et al. The eczema area and severity index (EASI): assessment of reliability in atopic dermatitis. Exp Dermatol 2001;10:11–8. [DOI] [PubMed] [Google Scholar]
- 63.Chopra R, Vakharia PP, Sacotte R, Patel N, Immaneni S, White T, et al. Severity strata for Eczema Area and Severity Index (EASI), modified EASI, Scoring Atopic Dermatitis (SCORAD), objective SCORAD, Atopic Dermatitis Severity Index and body surface area in adolescents and adults with atopic dermatitis. Br J Dermatol 2017;177:1316–21. [DOI] [PubMed] [Google Scholar]
- 64.Martin AR, Kanai M, Kamatani Y, Okada Y, Neale BM, Daly MJ. Clinical use of current polygenic risk scores may exacerbate health disparities. Nat Genet 2019; 51:584–91. [DOI] [PMC free article] [PubMed] [Google Scholar]
- 65.Martin AR, Gignoux CR, Walters RK, Wojcik GL, Neale BM, Gravel S, et al. Human demographic history impacts genetic risk prediction across diverse populations. Am J Hum Genet 2017;100:635–49. [DOI] [PMC free article] [PubMed] [Google Scholar]
- 66.Margolis DJ, Gupta J, Apter AJ, Ganguly T, Hoffstad O, Papadopoulos M, et al. Filaggrin-2 variation is associated with more persistent atopic dermatitis in African American subjects. J Allergy Clin Immunol 2014; 133:784–9. [DOI] [PMC free article] [PubMed] [Google Scholar]
- 67.Akiyama M FLG mutations in ichthyosis vulgaris and atopic eczema: spectrum of mutations and population genetics. Br J Dermatol 2010;162:472–7. [DOI] [PubMed] [Google Scholar]
- 68.Winge MCG, Bilcha KD, Lieden A, Shibeshi D, Sandilands A, Wahlgren CF, et al. Novel filaggrin mutation but no other loss-of-function variants found in Ethiopian patients with atopic dermatitis. Br J Dermatol 2011; 165:1074–80. [DOI] [PubMed] [Google Scholar]
- 69.Gao P-S, Rafaels NM, Hand T, Murray T, Boguniewicz M, Hata T, et al. Filaggrin mutations that confer risk of atopic dermatitis confer greater risk for eczema herpeticum. J Allergy Clin Immunol 2009;124:507–13.e1-e7. [DOI] [PMC free article] [PubMed] [Google Scholar]
- 70.Tran MM, Lefebvre DL, Dharma C, Dai D, Lou WYW, Subbarao P, et al. Predicting the atopic march: results from the Canadian Healthy Infant Longitudinal Development Study. J Allergy Clin Immunol 2018;141:601–7.e8. [DOI] [PubMed] [Google Scholar]
- 71.Mak TSH, Porsch RM, Choi SW, Zhou X, Sham PC. Polygenic scores via penalized regression on summary statistics. Genet Epidemiol 2017;41:469–80. [DOI] [PubMed] [Google Scholar]
- 72.Privé F, Vilhjálmsson BJ, Aschard H, Blum MGB. Making the most of clumping and thresholding for polygenic scores. bioRxiv 2019;653204. [DOI] [PMC free article] [PubMed] [Google Scholar]
- 73.Privé F, Arbel J, Vilhjálmsson BJ. LDpred2: better, faster, stronger. bioRxiv 20202020.2004.2028.066720. [DOI] [PMC free article] [PubMed] [Google Scholar]
Associated Data
This section collects any data citations, data availability statements, or supplementary materials included in this article.