

Abstract
Motivation
m6A methylation is a highly prevalent post-transcriptional modification in eukaryotes. MeRIP-seq or m6A-seq, which comprises immunoprecipitation of methylation fragments , is the most common method for measuring methylation signals. Existing computational tools for analyzing MeRIP-seq data sets and identifying differentially methylated genes/regions are not most optimal. They either ignore the sparsity or dependence structure of the methylation signals within a gene/region. Modeling the methylation signals using univariate distributions could also lead to high type I error rates and low sensitivity. In this paper, we propose using mean vector testing (MVT) procedures for testing differential methylation of RNA at the gene level. MVTs use a distribution-free test statistic with proven ability to control type I error even for extremely small sample sizes. We performed a comprehensive simulation study comparing the MVTs to existing MeRIP-seq data analysis tools. Comparative analysis of existing MeRIP-seq data sets is presented to illustrate the advantage of using MVTs.
Results
Mean vector testing procedures are observed to control type I error rate and achieve high power for detecting differential RNA methylation using m6A-seq data. Results from two data sets indicate that the genes detected identified as having different m6A methylation patterns have high functional relevance to the study conditions.
Availability
The dimer software package for differential RNA methylation analysis is freely available at https://github.com/ouyang-lab/DIMER.
Supplementary information
Supplementary data are available at Briefings in Bioinformatics online.
Keywords: RNA methylation, differential analysis, statistical methods
1 Introduction
N6-Methyladenosine (m6A) is one of the several known transcriptomic modifications in eukaryotes [4]. It is the most prevalent modification found in mature RNA, occurring at an average of 1 in every 2000 bases [14]. Besides a high abundance around the stop codons, it is also observed in non-coding RNAs (ncRNA) and long ncRNAs [28], transfer RNAs [33] and ribosomal RNAs [19]. Despite being first detected in the 1970s [13], its exact mechanism and implications are not entirely known. In recent years, there has been increased interest in understanding the role of m6A methylation in gene regulation [15], RNA splicing and stability [14] and cell differentiation and proliferation [38]. It is also observed to play a role as pacesetter in the mammalian circadian clock [18]. Besides regulating cellular mechanism, recent work has shed light on the role of m6A methylation in cancer biology as a regulator of tumorigenesis and self-renewal in glioblastoma stem cells. Researchers have shown that tumorigenesis and self-renewal of glioblastoma stem cells is regulated by m6A modification [9].
Unlike DNA methylation, which can be determined at the base pair level through bisulphite
sequencing, there is no exact method for studying m6A methylation. Determining m6A
methylation at the base pair level is challenging because methylated and unmethylated
adenosine bases have nearly identical chemical properties. Hence, reverse transcription of
an m6A base does not yield a comparable method like bisulfite sequencing in DNA. The
standard and widely used method to measure RNA methylation is through immunoprecipitation
sequencing, m6A-seq or MeRIP-Seq [28]. Using
antibodies that target m6A nucleosides in fragmented transcripts, libraries are prepared for
the transcripts carrying the m6A-methyl group, called the immunoprecipitated (IP) fragments.
Library size of the IP fragments depends on the capture rate of the experiment and the
quality of transcripts in the sample. To account for this variability in transcript
abundance in the samples, a control library is also prepared. Combining the immunoprecipated
and control samples, the relative transcript abundance is used as a measure of methylation
signal. While some recent techniques have been developed to study RNA methylation at near
nucleotide resolution [22], such experiments have
low throughput and are not exact nucleotide-level. To better localize the exact location of
methylated adenosines, motif finding algorithms are generally used. For example, [8, 17] have
identified that most methylated adenosines are found in the consensus DRACH (D =
 , R =
, R =
 , H =
, H =
 ) motif.
Besides identifying methylated nucleosides at the base pair level, a clinically important computational challenge in understanding RNA methylation is to compare the methylation profiles of transcriptomes under two or more conditions. Differential methylation analysis is an important step in understanding the role of methylation/demethylation enzyme complexes such as METTL3-METTL14 complex [23], WTAP [31], FTO [36], etc. There are two main methods used for detecting regions with high levels of differential methylation: peak-calling and window-based.
Peak-calling algorithms first identify contiguous regions with high levels of methylation called peaks on the two conditions (e.g. wild-type versus knockout) and then do a comparison of the peaks. Similar to MACS [37] for ChIP-Seq experiments, peaks in MeRIP-Seq are defined as regions enriched in the IP samples compared to control samples. Several methods have been developed targeting m6A methylation data sets such as exomePeak [27], HEPeak [10], SRAMP [39], m6aPred [7] and iRNA-Methyl [6]. When differential analysis is our primary interest, these methods have a notable drawback. Since the same data are used for calling peaks and testing differential methylation, there is potential for over-fitting the data and type I error in the hypothesis testing part may not be controlled [26].
Window-based methods do not involve peak-calling and thus do not suffer from over-fitting as the data are used only for differential analysis. In window-based methods, the region of interest—typically an entire gene or an exon—is divided into windows of pre-defined width. These windows are then used to impart methylation signals. Differential analysis is then performed by comparing the signals across all the windows within a given region of interest. For example, a simple method is to calculate the total methylation signal in the gene by adding the signals across all the windows and using a Fisher’s exact test. Without loss of generality, we consider a gene as our region of interest for the remainder of the paper.
Statistical methods for comparing the window-based methylation signals in a region of
interest can be broadly classified into two categories: univariate and multivariate. In
univariate methods, the signals within each window are modeled independently using
parametric models. The region of interest is then deemed differentially methylated by
combining the results of all the windows. Higher-level methods involve modeling the
parameters across the windows using another parametric model, similar to applying a prior
distribution in a Bayesian model. Differential methylation of the region is then defined
based on the parameters of the higher-level model. Currently existing methods such as
MeTDiff [11] and DRME [24] use univariate methods to model these window-based signals.
Likelihood based tests are then used for detecting differentially methylated regions. In
multivariate methods, signals across all the windows are considered simultaneously as a data
vector and modeled using multivariate distributions. The number of windows will correspond
to the dimension of the distribution. The mean signal across all the windows can be compared
using standard multivariate test statistics such as the Hotelling’s
 test.
test.
The main advantage of using multivariate distributions is that this approach allows specifying a non-zero dependence structure between the windows. Univariate methods have the drawback of ignoring the dependence structure of the methylation signals between windows. In MeRIP-Seq experiments, the sequences are typically 50 base pairs (bp) long and could potentially overlap multiple windows. Thus, incorporating the dependence structure in the testing procedure is of utmost importance to control error rates.
2 Approach
In traditional multivariate analysis, inference is based on the assumption that the number
of samples is larger than the dimension. For a given window size, the number of windows can
be as large as a few thousands. However, in most MeRIP-Seq experiments, the number of
replicates is small, usually less than 10 per condition. Methods such as Hotelling’s
 test suffer from the curse of
dimensionality and are not applicable when the number of windows is larger than
the number of replicates. Dimension reduction methods such as principal component analysis
(PCA) can be used to make the dimension smaller than the sample size. However, vast amounts
of information could potentially be lost when reducing the dimension from thousands to as
low as two or three.
test suffer from the curse of
dimensionality and are not applicable when the number of windows is larger than
the number of replicates. Dimension reduction methods such as principal component analysis
(PCA) can be used to make the dimension smaller than the sample size. However, vast amounts
of information could potentially be lost when reducing the dimension from thousands to as
low as two or three.
To address the issue of small sample size in multivariate analysis, several test statistics have been proposed when the mean is the parameter of interest. High-dimensional mean vector tests (MVTs) construct the test statistic by avoiding operations (e.g. inversion of sample covariance matrix), which are affected by the curse of dimensionality. They have been shown as an alternative with good performance in comparison to univariate methods for capture-based DNA methylation studies [3]. Inspired by those results, we studied the performance of MVTs when applied to MeRIP-Seq data. We designed a simulation study emulating data from existing MeRIP-Seq experiments to study how the MVTs perform in comparison to univariate methods currently available. We then applied the four methods considered to two publicly available data sets (GSE 61995 [16]; GSE 87516 [21]) to study the functional importance of RNA methylation.
The rest of the article is organized as follows. In Section 3, we discuss the issues with existing MeRIP-seq analysis tools. Mathematical formulation of the data and hypothesis test and description of existing univariate methods are also provided in detail. The MVTs and their mathematical details are discussed in section 3.3. In section 4, simulation studies designed based on MeRIP-Seq data sets are presented. Results from our analysis of two data sets are presented in section 5. Implementation of our analysis tool dimer is discussed in section 7.
3 Methods
Consider a gene that is covered by  disjoint adjacent windows.
Denote by
disjoint adjacent windows.
Denote by  and
and  the number of reads mapped to the
  bin,
bin,
 for the IP and control
samples, respectively. The vectors of signals, denoted by
for the IP and control
samples, respectively. The vectors of signals, denoted by  and
and  ,
define the methylation signal of the gene. The windows give a measure of resolution and are
generally shorter than the immunoprecipitated sequences. Let
,
define the methylation signal of the gene. The windows give a measure of resolution and are
generally shorter than the immunoprecipitated sequences. Let  and
and  denote the pair of methylation signal vectors for the two conditions, respectively. Let
 and
and  denote
the sample sizes for the two groups, respectively. Our goal is to test if the gene is
differentially methylated between two conditions, e.g. wild-type versus knockout. A
regression-based approach for studying the association between the treatment condition and
RNA methylation would be to fit a multivariate logistic regression model. Since the number
of bins is larger than the sample size in most studies, a regularized model is more
suitable. However, the performance of this approach based on either deviance-based
likelihood ratio test (LRT) or existence of non-zero regression coefficients is not good due
to the extremely low sample size (see Supplementary Material).
denote
the sample sizes for the two groups, respectively. Our goal is to test if the gene is
differentially methylated between two conditions, e.g. wild-type versus knockout. A
regression-based approach for studying the association between the treatment condition and
RNA methylation would be to fit a multivariate logistic regression model. Since the number
of bins is larger than the sample size in most studies, a regularized model is more
suitable. However, the performance of this approach based on either deviance-based
likelihood ratio test (LRT) or existence of non-zero regression coefficients is not good due
to the extremely low sample size (see Supplementary Material).
Generally, differential methylation is mathematically defined in one of two ways: difference in mean or difference in distribution. The MVTs use a non-parametric approach, i.e. no specific form of distribution for the model, to establish difference in the mean methylation signals. Univariate methods use parametric models and establish difference in distribution by showing difference in the parameters. While the former is the most preferred description of differential methylation, the latter is more complete.
3.1 MeTDiff
In MeTDiff [11], differential methylation is defined as the difference in distribution of signals for the two conditions. Proposed as a method for detecting differentially methylated peaks, MeTDiff can be generalized for a gene. In MeTDiff, the methylation counts of the windows in a gene are modeled using a beta-binomial model with a single pair of parameters,
 |
(1) |
A
gene is defined as differentially methylated if the two distributions differ, i.e.
 .
An LRT statistic is calculated and compared against the
.
An LRT statistic is calculated and compared against the  -distribution with appropriate degrees
of freedom. Note that the asymptotic properties of the LRT statistic are on the number of
windows within the gene. Depending on the window size, the number of windows is generally
large enough to have good approximation. This is the main advantage of MeTDiff, since the
test can be applied even for studies with a single replicate.
-distribution with appropriate degrees
of freedom. Note that the asymptotic properties of the LRT statistic are on the number of
windows within the gene. Depending on the window size, the number of windows is generally
large enough to have good approximation. This is the main advantage of MeTDiff, since the
test can be applied even for studies with a single replicate.
The Beta-Binomial mixture is a logical choice to model this kind of data due to conjugacy
of the distributions. But when the signals are sparse, the distribution of the
probabilities  tends to be
multimodal. Sparsity of signals also induces a mode around zero, a feature that is not
addressed by MeTDiff. Empirical distribution of the probability of methylation for some
genes (see Supplementary Material) shows that a mixture of Beta distributions is a more
appropriate model. The beta-binomial model also does not incorporate the dependence
between adjacent windows as mentioned above.
tends to be
multimodal. Sparsity of signals also induces a mode around zero, a feature that is not
addressed by MeTDiff. Empirical distribution of the probability of methylation for some
genes (see Supplementary Material) shows that a mixture of Beta distributions is a more
appropriate model. The beta-binomial model also does not incorporate the dependence
between adjacent windows as mentioned above.
3.2 DRME
Differential RNA methylation (DRME) [24] models the IP and input read counts using a negative binomial model. Differential methylation of the gene is parametrized determined by the mean of the distribution, which is parameterized to account for the total abundance of the gene and variable library size between samples. Estimation of the parameters and construction of the test statistic for this method are inspired by the DESeq [2] approach.
A major drawback of this method is representation of the entire methylation signal of a gene using a single count. The univariate measure of methylation allows for testing one-sided alternative. The parametrization accounts for technical variability. However, adding the methylation signals across all the windows ignores the biological variability within the gene. For nucleotide-level modifications such as methylation, using genewise measures is not accurate as it can potentially average out the difference over the entire region. For example, effects of regions with hyper- and hypo-methylation can be canceled out since they are combined through addition.
3.3 Mean vector tests
In window-based methylation signal estimation methods such as HEPeak [10] and exomePeak [27], the region of interest is divided into bins of equal size. When the resolution is set to be very small, the bin size is generally small enough for a single fragment to cover multiple bins. When a fragment overlaps multiple bins, the signal is shared equally among all the bins. While the dependence of true methylation status at the nucleotide level is unknown, this method of assigning signals imparts a strong dependence structure on neighboring bins.
Reads overlapping multiple windows imposes a strong dependence structure on the read counts across the gene. Univariate models fail to address this dependence, even with higher-level models such as MeTDiff. Multivariate models consider all the windows simultaneously and are parameterized to model both the mean signal and the dependence structure. Univariate approaches model the read counts within the windows using discrete distributions, such as Poisson or negative binomial. Multivariate distributions of discrete random variables are not very well characterized. Since both IP and control samples have to be modeled simultaneously, a canonical extension of the univariate methods is not feasible. This is because standard models such as additive Poisson model [25] allow only very restricted covariance structures. Multivariate generalizations of binomial distribution [1, 35] are not well studied for high dimensions.
To avoid modeling discrete multivariate discrete signals, the methylation read counts need to be transformed to a continuous measure. Using both IP and control samples simultaneously, define the relative read count
 |
(2) |
as
the measure of methylation signal for all the windows in a gene. An infinitesimally small
quantity  (
( ) is added to the denominator to
handle the situation when both IP and control samples have zero read count. The function
) is added to the denominator to
handle the situation when both IP and control samples have zero read count. The function
 is a monotonically increasing function
with
is a monotonically increasing function
with  . In our analysis, we used the
identity function
. In our analysis, we used the
identity function  for simplicty. Alternatively, the
inverse hyperbolic function,
for simplicty. Alternatively, the
inverse hyperbolic function,  , can be used.
Parametrizing the first two moments of the methylation signal vectors, let
 and
and
 be the mean vector and
covariance matrix for the first condition. For samples from the second condition, denote
these parameters by
be the mean vector and
covariance matrix for the first condition. For samples from the second condition, denote
these parameters by  and
and
 , respectively,
 |
Defining differential methylation through the mean vectors, the hypothesis can be formulated as
 |
(3) |
Traditional
Hotelling’s  -test cannot be used for testing the
hypothesis because the data violate all the necessary conditions. The number of bins in a
gene,
-test cannot be used for testing the
hypothesis because the data violate all the necessary conditions. The number of bins in a
gene,  , is generally large while the sample size
for most studies,
, is generally large while the sample size
for most studies,  , is very small for most studies.
This results resulting in what is called a large p small n situation.
Also, the covariance matrices of the two groups are not necessarily equal and cannot be
assumed to be otherwise.
, is very small for most studies.
This results resulting in what is called a large p small n situation.
Also, the covariance matrices of the two groups are not necessarily equal and cannot be
assumed to be otherwise.
With increasing interest in high-dimensional data analysis, several test statistics have
been proposed for testing the hypothesis in (4). The key to constucting the test statistic is to find a function of the data,
which estimates the difference between the means  and
and
 , commonly through
the Euclidean distance,
, commonly through
the Euclidean distance,
 |
(4) |
A
large value of observed  will serve as an indication of
difference in the mean methylation signals of the two groups. Among such testing
procedures, three tests are known to outperform their predecessors in terms of
performance: Chen–Qin test (
will serve as an indication of
difference in the mean methylation signals of the two groups. Among such testing
procedures, three tests are known to outperform their predecessors in terms of
performance: Chen–Qin test ( ) [5], Park–Ayyala test (
 ) [30] and Srivastava–Katayama–Kano test (
 )
[34].
)
[34].
An attractive feature of this class of MVT statistics is that they are distribution free,
hence the error of model misspecification can be avoided. They are applicable for a large
set of population parameter values and are also applicable for unequal covariance
matrices. These test statistics are established to be asymptotically normal, therefore
critical values for the tests at a given significance level can be easily calculated.
These methods have been applied previously in capture-based DNA methylation studies for
detection of differential methylation [3]. It has
been found that while the small sample sizes affect the type I error rates, the MVT is
still conservative as compared to other methods. Among the three mean vector tests,
 is shown to have better performance
over
is shown to have better performance
over  and
and  .
Under a wide range of models,
.
Under a wide range of models,  was observed to control type I error
at a specified significance level and attain reasonable power even for very sparse signals
and small number of replicates. In this paper,
was observed to control type I error
at a specified significance level and attain reasonable power even for very sparse signals
and small number of replicates. In this paper,  is applied as a
multivariate method for detection of differentially methylated genes in m6A RNA
methylation studies.
is applied as a
multivariate method for detection of differentially methylated genes in m6A RNA
methylation studies.
From the MeRIP-Seq experiment, the IP and control read vectors for a given gene are
recorded for all the replicates. Let  denote the read count vectors of IP and control samples from the first condition.
Similarly, denote the read count vectors observed under the second condition by
denote the read count vectors of IP and control samples from the first condition.
Similarly, denote the read count vectors observed under the second condition by
 .
Using the relative measure defined in (3), obtain the vectors
.
Using the relative measure defined in (3), obtain the vectors  for the first condition and
  under the second condition, respectively. The length of the vector is denoted by
 , which is determined by the length of the
gene and the window size chosen. The test statistic
, which is determined by the length of the
gene and the window size chosen. The test statistic  is
given by
is
given by
 |
(5) |
where
and
 ,
,
 and
and  .
The test statistic is asymptotically normal and the
.
The test statistic is asymptotically normal and the  -value
is given by
-value
is given by  , where
 is the normal cumulative
distribution function. To adjust for multiple testing when analyzing all the genes, we use
false discovery rate (FDR) to control the type I error.
is the normal cumulative
distribution function. To adjust for multiple testing when analyzing all the genes, we use
false discovery rate (FDR) to control the type I error.
Note that although the alternative in (4) is two-sided, the rejection region is right-sided. This is because the
function  is non-negative and the null hypothesis is rejected for large positive values of
 .
The hypothesis in (4) can be
equivalently written as
.
The hypothesis in (4) can be
equivalently written as  versus
  .
.
4 Simulation study
To compare the performance of  , MeTDiff, DRME and Fisher’s exact
test, we performed a comprehensive simulation study. We generated the data sets using
parameters estimated from real data sets. The read counts for IP and control samples for the
two conditions were randomly generated using a mixture beta-binomial model. Read count
vectors were generated for 10 000 regions, with the lengths randomly selected from the mouse
genome. Each region is divided into equally sized bins of size
, MeTDiff, DRME and Fisher’s exact
test, we performed a comprehensive simulation study. We generated the data sets using
parameters estimated from real data sets. The read counts for IP and control samples for the
two conditions were randomly generated using a mixture beta-binomial model. Read count
vectors were generated for 10 000 regions, with the lengths randomly selected from the mouse
genome. Each region is divided into equally sized bins of size  and
and
 . For regions that are not differentially
methylated, the count vectors are generated using a mixture beta-binomial model,
. For regions that are not differentially
methylated, the count vectors are generated using a mixture beta-binomial model,
 |
Relative
counts of IP samples can be obtained as  and
and
 ,
respectively.
,
respectively.
The Bernoulli component is added to induce sparsity into the model. These components for a given window can be different for all the samples, modeling the irregularity in observed reads. It reflects the absence of uniform methylation across all samples either due to non-methylation or lack of sequencing depth. The beta mixture model is proposed based on the multi-modal distribution of IP read proportions observed in real data (GSE 61995; see Supplementary Material). For the differentially methylated regions, the counts are generated similarly except for the proportions,
 |
The
proportion of windows differing between the two groups can be controlled by
 . The beta distribution parameters
 and
and  also control the difference between the two groups. The number of mixture components
 determines multimodality of the distribution
of proportions. We varied
determines multimodality of the distribution
of proportions. We varied  between 1 and 3 to study robustness of the
tests to distribution misspecification. For each value of
between 1 and 3 to study robustness of the
tests to distribution misspecification. For each value of  , we
studied four models (Models I–IV) varying the values of
, we
studied four models (Models I–IV) varying the values of  . The values of
parameters used are
. The values of
parameters used are  and
and  , respectively. Sample sizes
for the two groups were set to four,
, respectively. Sample sizes
for the two groups were set to four,  .
.
The methods were compared using three measures: area under the curve (AUC) of the receiver operating curve (ROC) constructed using the 20000 tests; the type I error rate based on the 10000 non-differentially methylated regions and the power based on the 10000 differentially methylated regions. Average AUC is reported by replicating each simulation setting 100 times.
4.1 Results
Figure 1 shows the ROC curves for the four models
when  equals 3. Results for
 equal to 1 and 2 are presented in
Supplementary Material (Figures S1 and
S2). The ROC curves were plotted using average sensitivity and specificity based
on 100 replicates. The average AUC calculated from 100 replicates is also presented in the
plots, which shows an increasing trend for
equal to 1 and 2 are presented in
Supplementary Material (Figures S1 and
S2). The ROC curves were plotted using average sensitivity and specificity based
on 100 replicates. The average AUC calculated from 100 replicates is also presented in the
plots, which shows an increasing trend for  with increasing
distance between null and alternative. The AUC increases with both proportion of
differently methylated windows (
with increasing
distance between null and alternative. The AUC increases with both proportion of
differently methylated windows ( ) and parameters of
the negative binomial (
) and parameters of
the negative binomial ( ). Both DRME and
Fisher’s exact test show very similar results, they are only slightly better than random
guess for all four settings. Under all the four models, MeTDiff is seen to have the least
AUC and is at most as good as a random guess. This lack of performance of MeTDiff can be
attributed to deviations in the distributional assumptions (distribution modality,
dependence) of the method.
). Both DRME and
Fisher’s exact test show very similar results, they are only slightly better than random
guess for all four settings. Under all the four models, MeTDiff is seen to have the least
AUC and is at most as good as a random guess. This lack of performance of MeTDiff can be
attributed to deviations in the distributional assumptions (distribution modality,
dependence) of the method.
Figure 1.

ROC Curves of the four simulation models, Models I–IV, for mixture of
 components. The numbers in the
legend correspond to the average AUC (
components. The numbers in the
legend correspond to the average AUC ( ) of the plot
calculated over 100 random simulations.
) of the plot
calculated over 100 random simulations.
For the four methods, type I error and power are calculated at the nominal significance
level of  to compare their performance.
The results are presented in Table 1. For the type
I error, which is equal to 1 - specificity, values close to
to compare their performance.
The results are presented in Table 1. For the type
I error, which is equal to 1 - specificity, values close to  indicate good performance. For the power, which is the sensitivity of the test, higher
values indicate that the test is able to correctly identify true positives. Under all
scenarios,
indicate good performance. For the power, which is the sensitivity of the test, higher
values indicate that the test is able to correctly identify true positives. Under all
scenarios,  controls type I error and achieves
good power, which increases with increasing difference between the groups. The univariate
methods, MeTDiff, DRME and Fisher, all have inflated false positive rates and low
power.
controls type I error and achieves
good power, which increases with increasing difference between the groups. The univariate
methods, MeTDiff, DRME and Fisher, all have inflated false positive rates and low
power.
Table 1.
Type I error and power for the Models I–IV defined in the simulation study setup for
 . The values presented are
based on a nominal significance level of
. The values presented are
based on a nominal significance level of  and
averaged over 100 replicates
and
averaged over 100 replicates
| Type I error | Power | ||||||||
|---|---|---|---|---|---|---|---|---|---|

|
Model | MeTDiff | CQ | DRME | Fisher | MeTDiff | CQ | DRME | Fisher |

|
I | 0.465 | 0.044 | 0.137 | 0.242 | 0.471 | 0.161 | 0.169 | 0.278 |
| II | 0.466 | 0.043 | 0.137 | 0.243 | 0.472 | 0.446 | 0.207 | 0.312 | |
| III | 0.465 | 0.044 | 0.136 | 0.243 | 0.471 | 0.485 | 0.207 | 0.317 | |
| IV | 0.466 | 0.044 | 0.137 | 0.247 | 0.474 | 0.849 | 0.280 | 0.380 | |

|
I | 0.466 | 0.044 | 0.135 | 0.237 | 0.471 | 0.172 | 0.168 | 0.272 |
| II | 0.466 | 0.043 | 0.135 | 0.237 | 0.473 | 0.469 | 0.208 | 0.308 | |
| III | 0.467 | 0.044 | 0.135 | 0.236 | 0.472 | 0.496 | 0.207 | 0.312 | |
| IV | 0.466 | 0.044 | 0.134 | 0.236 | 0.475 | 0.853 | 0.282 | 0.379 | |

|
I | 0.467 | 0.045 | 0.130 | 0.222 | 0.471 | 0.199 | 0.169 | 0.264 |
| II | 0.467 | 0.045 | 0.131 | 0.224 | 0.473 | 0.524 | 0.212 | 0.303 | |
| III | 0.466 | 0.045 | 0.131 | 0.224 | 0.472 | 0.514 | 0.207 | 0.303 | |
| IV | 0.467 | 0.045 | 0.131 | 0.223 | 0.476 | 0.861 | 0.283 | 0.372 | |
The results presented in Figure 1 and Table 1 are based on the identity function for
 in (3). To study how monotone transformation of the signals
will affect
in (3). To study how monotone transformation of the signals
will affect  , we repeated the simulation with
signals transformed as
, we repeated the simulation with
signals transformed as  . The results are
presented in Supplementary Material (Table S1). Under all models, the type I error has increased slightly, but is
still controlled at
. The results are
presented in Supplementary Material (Table S1). Under all models, the type I error has increased slightly, but is
still controlled at  significance level. The MVT shows a
significant increase power for the arcsine-transformed data under all the settings.
significance level. The MVT shows a
significant increase power for the arcsine-transformed data under all the settings.
5 Data analysis
In previously published m6A methylation studies, analysis of the data has commonly focused on detecting regions with enhanced methylation signal (peaks) and understanding their importance. In our analysis, we have focused on doing a gene-level analysis. At the gene level, one can further investigate the detected genes for their functional importance and explore significant canonical pathways. To the best of our knowledge, there are no results reported for comparison of RNA methylation at the gene level.
We applied the four methods to two data sets to detect differentially methylated genes and
investigate their biological relevance in the context of the respective experimental setup.
For each data set, we aligned the sequences to the appropriate reference transcriptome to
obtain gene-wise read counts. To study robustness of the methods to window size, we used
window sizes of 10, 20, 30, 40 and 50 for assigning read counts. For each window size, the
 -values calculated for the genes were adjusted
for multiple testing correction using FDR. Genes expressing differentially methylated
transcripts were reported using the nominal
-values calculated for the genes were adjusted
for multiple testing correction using FDR. Genes expressing differentially methylated
transcripts were reported using the nominal  significance level as
cut-off. Downstream analysis of selected genes was performed using Ingenuity Pathway
Analysis (IPA) (QIAGEN Inc.) [20].
significance level as
cut-off. Downstream analysis of selected genes was performed using Ingenuity Pathway
Analysis (IPA) (QIAGEN Inc.) [20].
5.1 Study I
The first data set we analyzed was collected by Geula et al. [16]. In this study, the effects of methyltransferase knockout in
cellular development of mice were studied. Particularly, the role of m6A in pluripotency
transitions by comparing METTL3 methyltransferase knock-out samples against wild-type in
mouse embryonic stem cells (mESCs) was investigated. The data set consists of three
replicates (IP+control) from wild-type mESC and three replicates from knock-out mESC
samples. Raw sequence files for the samples were acquired from NCBI (accession number GSE
61995). Using the Ensembl reference transcriptome (GRCm67) for alignment, We reported the
read counts for a total of 37 991 genes. After preliminary processing of the data and
filtering of genes (see Supplementary Materials), the four test statistics were applied to
the remaining genes. The number of differentially expressed genes after FDR correction for
the five window sizes is reported in Table 2. As
seen from the table,  is the most conservative among the
four methods, followed by DRME. Fisher’s exact test and MeTDiff are extremely liberal,
detecting almost half of the genes in the analysis as differentially methylated.
is the most conservative among the
four methods, followed by DRME. Fisher’s exact test and MeTDiff are extremely liberal,
detecting almost half of the genes in the analysis as differentially methylated.
Table 2.
Number of differentially methylated genes detected by the four methods when using five different windows sizes for Study I
| Bin size |

|
MeTDiff | DRME | Fisher |
|---|---|---|---|---|
| 10 | 1739 | 22 445 | 4067 | 22 356 |
| 20 | 1796 | 22 487 | 3637 | 19 342 |
| 30 | 1890 | 22 235 | 3336 | 17 169 |
| 40 | 1899 | 22 313 | 3106 | 15 866 |
| 50 | 1952 | 22 336 | 2912 | 14 815 |
To measure robustness of the set of genes detected across the five window sizes, we
calculated the overlap of genes at different window size. A method is deemed robust if the
overlap across all five window sizes is relatively higher compared to the remaining
overlaps. This can be calculated by comparing the number in the middle to the maximum of
the remaining numbers in the Venn diagram. Figure 2
shows the common number of genes detected when using different window sizes for the four
methods. To compare robustness of the methods across window sizes, proportion of commonly
detected genes adjusted for the total number of genes detected was calculated. This
measure is an adjusted Jaccard index (see Supplementary Material). It can be seen from the
figure that  (adj. Jaccard index of
 ) and DRME (
 )
detect a very high proportion of genes common to all window sizes as compared to MeTDiff
(
)
detect a very high proportion of genes common to all window sizes as compared to MeTDiff
( ) and Fisher’s exact test
(
) and Fisher’s exact test
( ).
).
Figure 2.

Venn diagrams showing the common sets of genes detected to be differentially methylated for Study I when using different bin sizes for assigning methylation signals. The circles correspond to different bin sizes from 10 to 50 base-pairs.
IPA analysis To better understand the role of the genes detected by the four
methods in the growth of mESCs, we studied their molecular and cellular functions. For
each method, the top five cellular functions detected using IPA are presented in Table
3 in the decreasing order of
 -values. The output from IPA analysis is
presented in Supplementary Material. To accommodate the large number of genes detected by
MeTDiff and Fisher’s exact test in IPA, the top 1000 genes (based on smallest
-values. The output from IPA analysis is
presented in Supplementary Material. To accommodate the large number of genes detected by
MeTDiff and Fisher’s exact test in IPA, the top 1000 genes (based on smallest
 -value) were selected for analysis. For
 and DRME, all the genes selected by
the testing procedure were used in the analysis. Genes detected using 50 bp window-size
were used for this analysis.
and DRME, all the genes selected by
the testing procedure were used in the analysis. Genes detected using 50 bp window-size
were used for this analysis.
Table 3.
Top five molecular and cellular functions detected as significant using IPA for Study
I. The functions are presented in the decreasing order of signficance (determined by
the  -value). The results are based on the
top 1000 genes for DRME and MeTDiff and all the genes are used for
-value). The results are based on the
top 1000 genes for DRME and MeTDiff and all the genes are used for
 and DRME
| Method | Molecular and cellular functions detected as significant |
|---|---|

|
Cellular development; cellular growth and proliferation; cellular function and maintenance; cellular movement; cell cycle |
| MeTDiff | Cell death and survival; cellular movement; cellular development; cellular growth and proliferation; cell morphology |
| DRME | Cell morphology; amino acid metabolism; lipid metabolism; molecular transport; small molecule biochemistry |
| Fisher’s test | Cell cycle; cellular development; cellular growth and proliferation; cell morphology; gene expression |
A majority of the functions detected by DRME are not related to cellular development. All
five functions highlighted by  and MeTDiff are
related to cell growth. A majority of the functions (four out of five) detected by
Fisher’s exact test are also associated with cellular development. This indicates that the
genes identified by
and MeTDiff are
related to cell growth. A majority of the functions (four out of five) detected by
Fisher’s exact test are also associated with cellular development. This indicates that the
genes identified by  , MeTDiff and Fisher’s test to have
strongest evidence of differential methylation (in terms of the smallest
, MeTDiff and Fisher’s test to have
strongest evidence of differential methylation (in terms of the smallest
 -value) have very high functional
relevance. Table 4 shows that MeTDiff and Fisher’s
test detect a very large number of genes. As evident from the inflated type I error rates
of these two methods from the simulation study, there is a high chance that most of these
genes detected could be false positives. The high specificity of
-value) have very high functional
relevance. Table 4 shows that MeTDiff and Fisher’s
test detect a very large number of genes. As evident from the inflated type I error rates
of these two methods from the simulation study, there is a high chance that most of these
genes detected could be false positives. The high specificity of  is a strong indication that there is a relatively smaller chance of the genes detected by
 to be false positives.
Table 4.
Number of differentially methylated genes detected by the four methods for data in Study II. The five rows correspond to the window sizes used to assign read counts to genes
| Window size |

|
MeTDiff | DRME | Fisher |
|---|---|---|---|---|
| 10 | 460 | 17 320 | 1749 | 12 370 |
| 20 | 451 | 17 283 | 1248 | 8023 |
| 30 | 455 | 17 203 | 1046 | 5946 |
| 40 | 452 | 16 937 | 983 | 4783 |
| 50 | 470 | 16 827 | 974 | 3870 |
5.2 Study II
The second data set we analyzed was from the study by Lichinchi et al. (NCBI accession
number GSE 87516) [21]. In this study, the
authors focused on exploring m6A methylation in human cells, comparing the methylation
topologies between normal human (HEK293T) cells and those infected with Zika (MR766)
virus. The data set consists of three replicates each ( ) from normal and Zika-infected
samples, respectively. Aligning the sequences to GRCh38 reference transcriptome,
methylation signals are calculated for 58 233 genes. After preliminary screening and
testing as described in Supplementary Materials, we studied genes exhibiting differential
methylation and the subsequent pathways detected. The number of genes detected by the four
methods are presented in Table 4.
) from normal and Zika-infected
samples, respectively. Aligning the sequences to GRCh38 reference transcriptome,
methylation signals are calculated for 58 233 genes. After preliminary screening and
testing as described in Supplementary Materials, we studied genes exhibiting differential
methylation and the subsequent pathways detected. The number of genes detected by the four
methods are presented in Table 4.
Venn diagrams presented in Figure 3 show how
consistent the results are across different window sizes. The adjusted Jaccard index for
the four methods are  —
— ,
MeTDiff—
,
MeTDiff— , DRME—
 and Fisher’s exact test—
 . This is an indication that
 selects a small number of genes
robustly across all window sizes. However, it can be observed that the Venn diagrams do
not show consistency (percentage of overlap) in the genes selected by the five window
sizes. Greater consistency has been achieved when window size 10 is removed from this list
(see Supplementary Materials). This suggests that the data are very noisy when window size
of 10 bp is considered.
selects a small number of genes
robustly across all window sizes. However, it can be observed that the Venn diagrams do
not show consistency (percentage of overlap) in the genes selected by the five window
sizes. Greater consistency has been achieved when window size 10 is removed from this list
(see Supplementary Materials). This suggests that the data are very noisy when window size
of 10 bp is considered.
Figure 3.
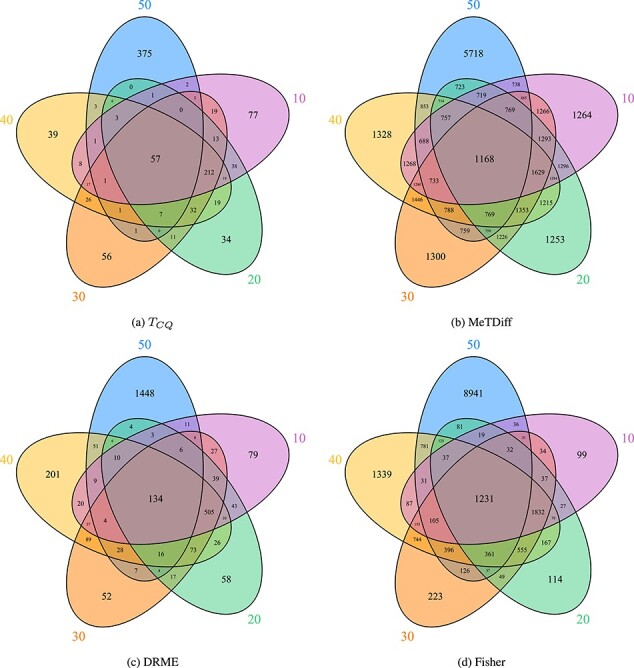
Venn diagrams showing the common sets of genes detected to be differentially methylated for Study II when using different window sizes for assigning methylation signals. The circles correspond to different window sizes from 10 to 50 base pairs.
To understand the functional relevance of genes detected, the diseases and functions
associated with these genes were studied using IPA analysis (Table 4). Heatmaps of the IPA results are presented in Supplementary
Material. Zika virus infection in humans is known to be positively associated with
microcephaly [29], which can lead to
developmental and neurological disorders. The results indicate that the genes detected by
 show strong evidence of association
with neurological and developmental disorders. The other three methods detect diseases
such as cancer, which are not known to be associated with Zika virus infection.
show strong evidence of association
with neurological and developmental disorders. The other three methods detect diseases
such as cancer, which are not known to be associated with Zika virus infection.
6 Conclusions and discussions
In this paper, we proposed using MVT procedures as a multivariate alternative for testing gene-wise or region-wise differential methylation of RNA. In comparison to existing methods that use univariate distributions, the MVT approach uses signals from all the windows simultaneously. As observed from the simulation studies, the MVT is better at controlling type I error and also achieves higher power than the other procedures being compared. The MVT has a higher area under the curve in the ROC curves, indicating better detection of methylated genes the method has high specificity and low false positive rate.
Read counts from the immunoprecipitation data are converted to methylation signals using
the ratio of IP read count to the total read count (IP + Control). Using the raw methylation
signal and an arcsine transformation have shown to control type I error rate of MVTs well.
Both methods have high sensitivity, with the arcinse transformation having higher power
compared to the raw signal. Some functions that can be considered instead of the arcsine are
 or
or
 . While any monotone
increasing transformation would increase the power, it is important to evaluate its
efficiency at controlling type I error.
. While any monotone
increasing transformation would increase the power, it is important to evaluate its
efficiency at controlling type I error.
We analyzed two data sets using MVT and compared the results to three existing univariate methods. Pathway analysis of genes detected by MVT are observed to be of high functional relevance to the experimental conditions, while keeping the number of genes detected small. All four testing procedures have shown consistency of results across window sizes ranging from 10 to 50. However, read counts for smaller window sizes are noisy. As seen in Study II, smaller window sizes could reduce consistency of the results. For optimal trade-off between window size and accuracy, we recommend using a 20–50 bp window size.
The MVT  is applicable only when there are at
least three biological replicates. However, many studies report only one or two replicates.
Univariate methods such as MeTDiff are capable of handling data sets with single replicate,
as the windows are treated as replicates. But the accuracy of such methods for single
replicate data sets has not been extensively validated. Lack of replicates can result in
erroneous results, due to biological and technical variability across samples. There is a
need to develop and assess tools for analyzing data sets with smaller number of replicates
using multivariate techniques.
is applicable only when there are at
least three biological replicates. However, many studies report only one or two replicates.
Univariate methods such as MeTDiff are capable of handling data sets with single replicate,
as the windows are treated as replicates. But the accuracy of such methods for single
replicate data sets has not been extensively validated. Lack of replicates can result in
erroneous results, due to biological and technical variability across samples. There is a
need to develop and assess tools for analyzing data sets with smaller number of replicates
using multivariate techniques.
7 Software availability
For calculating window based read-counts and testing differential methylation, we developed
dimer. dimer, standing for differential
methylation of RNA, is a Python-based package. The package uses other
bioinformatics tools such as bedtools [32] and
pybedtools [12] for faster calculations. Using
aligned sequence files in BAM format as input, dimer provides the
 test statistic and
 -value for each gene in the provided
annotation file. Additionally, the package also creates bedgraph files for visualization
using a genome browser. dimer gains an advantage in run-time (see
Supplementary Materials) compared to MeTDiff. The package is available from the GitHub
website: https://github.com/ouyang-lab/DIMER.
-value for each gene in the provided
annotation file. Additionally, the package also creates bedgraph files for visualization
using a genome browser. dimer gains an advantage in run-time (see
Supplementary Materials) compared to MeTDiff. The package is available from the GitHub
website: https://github.com/ouyang-lab/DIMER.
Key Points
 High-dimensional multivariate tests are more accurate for
detection of differentially methylated genes in RNA methylation studies.
High-dimensional multivariate tests are more accurate for
detection of differentially methylated genes in RNA methylation studies. The features detected by
  have high specificity and very
high functional relevance as compared to the other univariate test procedures.
have high specificity and very
high functional relevance as compared to the other univariate test procedures. The test procedure
  is robust
for window sizes 20–50 bp. Caution needs to be applied when using 10 bp window as
the results are prone to error.
is robust
for window sizes 20–50 bp. Caution needs to be applied when using 10 bp window as
the results are prone to error.
Supplementary Material
Acknowledgments
We thank Yufei Huang for technical assistance and Yuping Zhang for discussions.
The project was initiated when Deepak Nag Ayyala was a postdoctoral research associate in Zhengqing Ouyang’s group.
Deepak Nag Ayyala is an assistant professor of biostatistics and data science at the Medical College of Georgia, Augusta University. His research interests are primarily in high dimensional statistical inference, with applications in epigenomics and transcriptomics.
Jianan Lin is an assistant computational scientist at The Jackson Laboratory for Genomic Medicine. His research interests include analyzing the next generation sequencing data and developing computational methods to solve biological problems.
Zhengqing Ouyang is an associate professor of biostatistics at the University of Massachusetts, Amherst. His research interests are mainly in the development of statistical and computational methods for elucidating the structures and regulations of genomes and RNAs.
Contributor Information
Deepak Nag Ayyala, Division of Biostatistics and Data Science, Department of Population Health Sciences, Medical College of Georgia, Augusta University, Augusta, GA 30912, USA.
Jianan Lin, Department of Biostatistics and Epidemiology, School of Public Health and Health Sciences, University of Massachusetts, Amherst, MA 01003, USA.
Zhengqing Ouyang, The Jackson Laboratory for Genomic Medicine, Farmington CT, 06032, USA.
Funding
National Institutes of Health/National Institute of General Medical Sciences (R35 GM124998 to Z.O.).
References
- 1. Altham PME. Two generalizations of the binomial distribution. J R Stat Soc Ser C Appl Stat 1978; 27(2): 162–7. [Google Scholar]
- 2. Anders S, Huber W. Differential expression analysis for sequence count data. Genome Biol 2010; 11(10): R106. [DOI] [PMC free article] [PubMed] [Google Scholar]
- 3. Ayyala DN, Frankhouser DE, Ganbat J-O, et al. Statistical methods for detecting differentially methylated regions based on MethylCap-seq data. Brief Bioinform 2016; 17(6): 926–37. [DOI] [PMC free article] [PubMed] [Google Scholar]
- 4. Cantara WA, Crain PF, Rozenski J, et al. The RNA modification database, RNAMDB: 2011 update. Nucleic Acids Res 2011; 39:195–201. [DOI] [PMC free article] [PubMed] [Google Scholar]
- 5. Chen SX, Qin Y. A two-sample test for high-dimensional data with applications to gene-set testing. Ann Stat 2010; 38(2): 808–35. [Google Scholar]
- 6. Chen W, Feng P, Ding H, et al. iRNA-Methyl: identifying N6-methyladenosine sites using pseudo nucleotide composition. Anal Biochem 2015; 490:26–33. [DOI] [PubMed] [Google Scholar]
- 7. Chen W, Tran H, Liang Z, et al. Identification and analysis of the N6-methyladenosine in the Saccharomyces cerevisiae transcriptome. Sci Rep 2015; 5(13859). [DOI] [PMC free article] [PubMed] [Google Scholar]
- 8. Csepany T, Lin A, Baldick CJ, et al. Sequence specificity of mRNA N6-Adenosine methyltransferase. J Biol Chem 1990; 265(33): 20117–22. [PubMed] [Google Scholar]
- 9. Cui Q, Shi H, Ye P, et al. m6A RNA methylation regulates the self-renewal and tumorigenesis of glioblastoma stem cells. Cell Rep 2017; 18(11): 2622–34. [DOI] [PMC free article] [PubMed] [Google Scholar]
- 10. Cui X, Meng J, Rao MK, et al. HEPeak: an HMM-based exome peak-finding package for RNA epigenome sequencing data. BMC Genomics 2015; 16:S2. [DOI] [PMC free article] [PubMed] [Google Scholar]
- 11. Cui X, Lin Z, Meng J, et al. MeTDiff: a novel differential RNA methylation analysis for MeRIP-Seq data. IEEE/ACM Trans Comput Biol Bioinform 2015; 5963(c): 1–1. [DOI] [PubMed] [Google Scholar]
- 12. Dale RK, Pedersen BS, Quinlan AR. Pybedtools: a flexible Python library for manipulating genomic datasets and annotations. Bioinformatics 2011; 27(24): 3423–4. [DOI] [PMC free article] [PubMed] [Google Scholar]
- 13. Desrosiers R, Friderici K, Rottman F. Identification of methylated nucleosides in messenger RNA from Novikoff hepatoma cells. Proc Natl Acad Sci U S A 1974; 71(10): 3971–5. [DOI] [PMC free article] [PubMed] [Google Scholar]
- 14. Dominissini D, Moshitch-Moshkovitz S, Schwartz S, et al. Topology of the human and mouse m6A RNA methylomes revealed by m6A-seq. Nature 2012; 485(7397): 201–6. [DOI] [PubMed] [Google Scholar]
- 15. Fu Y, Dominissini D, Rechavi G, et al. Gene expression regulation mediated through reversible m6A RNA methylation. Nat Rev Genet 2014; 15(5): 293–306. [DOI] [PubMed] [Google Scholar]
- 16. Geula S, Moshitch-Moshkovitz S, Dominissini D, et al. m6A mRNA methylation facilitates resolution of naïve pluripotency toward differentiation. Science 2015; 347(6225): 1002–6. [DOI] [PubMed] [Google Scholar]
- 17. Harper JE, Miceli SM, Roberts RJ, et al. Sequence specificity of the human mRNA N6-adenosine methylase in vitro. Nucleic Acids Res 1990; 18(19): 5735–41. [DOI] [PMC free article] [PubMed] [Google Scholar]
- 18. Hastings MH. m6A mRNA methylation: a new circadian pacesetter. Cell 2013; 155(4): 740–1. [DOI] [PubMed] [Google Scholar]
- 19. Iwanami Y, Brown GM. Methylated bases of ribosomal ribonucleic acid from HeLa cells. Arch Biochem Biophys 1968; 126(1): 8–15. [DOI] [PubMed] [Google Scholar]
- 20. Krämer A, Green J, Pollard Jr J, et al. Causal analysis approaches in ingenuity pathway analysis. Bioinformatics 2014; 30(4): 523–30. [DOI] [PMC free article] [PubMed] [Google Scholar]
- 21. Lichinchi G, Zhao BS, Wu Y, et al. Dynamics of human and viral RNA methylation during Zika virus infection. Cell Host Microbe 2016; 20(5): 666–73. [DOI] [PMC free article] [PubMed] [Google Scholar]
- 22. Bastian Linder AV, Grozhik AO, Olarerin-George CM, et al. Single-nucleotide-resolution mapping of m6A and m6Am throughout the transcriptome. Nat Methods 2015; 12(8): 767–72. [DOI] [PMC free article] [PubMed] [Google Scholar]
- 23. Liu J, Yue Y, Han D, et al. A METTL3-METTL14 complex mediates mammalian nuclear RNA N6-adenosine methylation. Nat Chem Biol 2014; 10. [DOI] [PMC free article] [PubMed] [Google Scholar]
- 24. Liu L, Zhang S-W, Gao F, et al. DRME: count-based differential RNA methylation analysis at small sample size scenario. Anal Biochem 2016; 499:15–23. [DOI] [PubMed] [Google Scholar]
- 25. Lukacs E, Beer S. Characterization of the multivariate poisson distribution. J Multivar Anal 1977; 7(1): 1–12. [Google Scholar]
- 26. Lun ATL, Smyth GK. De novo detection of differentially bound regions for ChIP-seq data using peaks and windows: controlling error rates correctly. Nucleic Acids Res 2014; 42(11): e95. [DOI] [PMC free article] [PubMed] [Google Scholar]
- 27. Meng J, Cui X, Rao MK, et al. Exome-based analysis for RNA epigenome sequencing data. Bioinformatics 2013; 29(12): 1565–7. [DOI] [PMC free article] [PubMed] [Google Scholar]
- 28. Meyer KD, Saletore Y, Zumbo P, et al. Comprehensive analysis of mRNA methylation reveals enrichment in 3’ UTRs and near stop codons. Cell 2012; 149(7): 1635–46. [DOI] [PMC free article] [PubMed] [Google Scholar]
- 29. Mlakar J, Korva M, Tul N, et al. Zika virus associated with microcephaly. N Engl J Med 2016; 374(10): 951–8. [DOI] [PubMed] [Google Scholar]
- 30. Park J, Ayyala DN. A test for the mean vector in large dimension and small samples. J Stat Plan Inf 2013; 143(5): 929–43. [Google Scholar]
- 31. Ping X-L, Sun B-F, Wang L, et al. Mammalian WTAP is a regulatory subunit of the RNA N6-methyladenosine methyltransferase. Cell Res 2014; 24:177–89. [DOI] [PMC free article] [PubMed] [Google Scholar]
- 32. Quinlan AR, Hall IM. BEDTools: a flexible suite of utilities for comparing genomic features. Bioinformatics 2010; 26(6): 841–2. [DOI] [PMC free article] [PubMed] [Google Scholar]
- 33. Saneyoshi M, Harada F, Nishimura S. Isolation and characterization of N6-methyladenosine from Escherichia coli valine transfer RNA. Biochim Biophys Acta Nucleic Acids Protein Synth 1969; 190(2): 264–73. [DOI] [PubMed] [Google Scholar]
- 34. Srivastava MS, Katayama S, Kano Y. A two sample test in high dimensional data. J Multivar Anal 2013; 114:349–58. [Google Scholar]
- 35. Teugels JL. Some representations of the multivariate Bernoulli and binomial distributions. J Multivar Anal 1990; 32(2): 256–68. [Google Scholar]
- 36. Walters BJ, Mercaldo V, Gillon CJ, et al. The role of the RNA demethylase FTO (fat mass and obesity-associated) and mRNA methylation in hippocampal memory formation. Neuropsychopharmacology 2017; 42:1502–10. [DOI] [PMC free article] [PubMed] [Google Scholar]
- 37. Zhang Y, Liu T, Meyer CA, et al. Model-based analysis of ChIP-Seq (MACS). Genome Biol Sep 2008; 9(9): R137. [DOI] [PMC free article] [PubMed] [Google Scholar]
- 38. Zhong S, Li H, Bodi Z, et al. MTA is an Arabidopsis messenger RNA adenosine methylase and interacts with a homolog of a sex-specific splicing factor. Plant Cell Online 2008; 20(5): 1278–88. [DOI] [PMC free article] [PubMed] [Google Scholar]
- 39. Zhou Y, Zeng P, Li Y-H, et al. SRAMP: prediction of mammalian N6-methyladenosine (m6A) sites based on sequence-derived features. Nucleic Acids Res 2016; 44(10): e91. [DOI] [PMC free article] [PubMed] [Google Scholar]
Associated Data
This section collects any data citations, data availability statements, or supplementary materials included in this article.