

Abstract
Aging is a key risk factor in Alzheimer’s dementia (AD) development and progression. The primary dementia-protective benefits of angiotensin II subtype 1 receptor (AT1R) blockers are believed to arise from systemic effects on blood pressure. However, a brain-specific renin-angiotensin system (b-RAS) exists, which can be altered by AT1R blockers. Brain RAS acts mainly through 3 angiotensin receptors: AT1R, AT2R, and AT4R. Changes in these brain angiotensin receptors may accelerate the progression of AD. Using postmortem frontal cortex brain samples of age- and sex-matched cognitively normal individuals (n = 30) and AD patients (n = 30), we sought to dissect the b-RAS changes associated with AD and assess how these changes correlate with brain markers of oxidative stress, inflammation, and mitochondrial dysfunction as well as amyloid-β and paired helical filament tau pathologies. Our results show higher protein levels of the pro-inflammatory AT1R and phospho-ERK (pERK) in the brains of AD participants. Brain AT1R levels and pERK correlated with higher oxidative stress, lower cognitive performance, and higher tangle and amyloid-β scores. This study identifies molecular changes in b-RAS and offers insight into the role of b-RAS in AD-related brain pathology.
Keywords: Aging, Central nervous system, Inflammation, Oxidative stress, Renin-angiotensin system
Alzheimer’s dementia (AD) is a complex age-related neurodegenerative disease characterized by progressive neuronal losses and cognitive impairment. It is the most common form of dementia (1). Nearly 50 million people worldwide currently have dementia, and with the increase in the older population, this number is projected almost to double every 20 years (2). Alzheimer’s disease has significant socioeconomic implications. The cost of caring for patients with AD is over $1 trillion (2), with a substantial caregiver and family impact due to the associated physical, emotional, and financial challenges.
Although multiple molecular processes have been proposed to associate with AD, no clear aging-related mechanisms have emerged as most contributory. These processes include oxidative stress, mitochondrial dysfunction, and chronic inflammatory signaling. In addition, the brain renin-angiotensin system (RAS) dysregulation has been proposed as a potentially significant contributor to the development and progression of AD (3,4).
RAS was initially described as a component of the endocrine system, contributing to water and fluid balance and to the regulation of blood pressure. More recently, locally independent forms of RAS were described in the brain and other tissues (5–7). The identification of brain-specific RAS (b-RAS) is significant because some RAS key components such as angiotensin II may not cross the brain–blood barrier (8–10). Brain RAS acts mainly through 3 angiotensin receptors: AT1R, AT2R, and AT4R (7). Angiotensin II type 1 receptor (AT1R) promotes vasoconstriction, inflammation, oxidative stress, and mitochondrial dysfunction, which are believed to play significant roles in neurodegeneration (11). Angiotensin II type 2 receptor (AT2R) is known to oppose AT1R effects and promote anti-inflammation, vasodilation, and cell differentiation. The angiotensin subtype 4 receptors (AT4R) are linked through dopamine and acetylcholine release to memory consolidation, although their exact mechanism of action is not yet fully understood (12–14). The balance among different RAS receptors also appears to be essential for brain homeostasis due to the extensive cross talk, opposing effects, and complex interactions of the receptors with each other and with different components of the brain’s molecular and cellular pathways.
Epidemiological studies show a reduced AD prevalence and slower AD progression among participants receiving RAS-modulating drugs (eg, angiotensin receptor blockers [ARB], angiotensin-converting enzyme [ACE] inhibitors) (15–17). Given the wide clinical use of RAS-modifying medications, understanding fundamental molecular changes in brain RAS with AD is essential. It may provide important insights into indications and precautions of utilizing such drugs in AD patients (18).
In this study, we hypothesized that AD-related dysregulation in RAS homeostasis toward higher brain AT1R will be associated with higher brain inflammation, oxidative stress, tau and amyloid burden, and steeper cognitive decline. Using brain tissues from both AD and control participants, we investigated the relationship between the main components of the RAS, biomarkers of brain damage, and cognitive performance.
Method
To dissect changes in the b-RAS in postmortem frontal cortex brain samples of age- and sex-matched cognitively intact (CI) individuals (n = 30) and AD patients (n = 30), we measured brain levels of angiotensinogen (AGT), a precursor molecule for angiotensin (Ang) II and the substrate for renin and the parent of all angiotensin peptides. We also quantified gene expression levels of the main brain RAS enzymes (renin and ACE). We then quantified gene expression and protein level of the functional receptors AT1R, AT2R, and AT4R. To analyze RAS receptors’ cellular downstream activity, we measured phosphorylated extracellular signal-regulated kinases (pERK), a downstream signaling pathway of AT1R. While, pERK could be affected by other factors and hormonal systems, several studies reported the activation of mitogen-activated protein kinase/extracellular signal-regulated kinase (ERK1/2) by AT1R in various cell types (19–23). We measured eNOS (endothelial nitric oxide synthase) and nNOS (neuronal nitric oxide synthase) as downstream signaling pathways of AT2R. To determine the impact of RAS differences on molecular mechanisms linked to AD, we quantified and analyzed the association between RAS markers and brain protein carbonyl (PC) levels (as a measure of oxidative stress), as well as serum and brain cytokines (interleukin 6 [IL-6], interleukin 1 [IL-1], interferon-gamma [IFN-γ], and tumor necrosis factor α [TNF-α]). We examined mitochondrial health indicators including mitochondrial autophagy protein BCL-2 homology 3-containing protein NIP3-like X (NIX), mitochondrial biogenesis master regulator peroxisome proliferator-activated receptor-gamma coactivator 1 alpha (PGC1α), and brain mitochondrial numbers. We investigated the association between brain RAS components and different measures of AD pathologies (including average tangle density and amyloid-β scores). Finally, we analyzed the correlation of RAS molecular changes with markers of cognitive performance.
Human Brain Samples, cDNA Preparation, and Protein Extraction
Postmortem frontal cortex brain samples and serum samples of age- and sex-matched CI individuals and AD patients were obtained from the Rush Memory and Aging Project (MAP). MAP was approved by a Human Subjects Committee of Rush University Medical Center. All participants signed informed consent, Anatomic Gift Act, and a repository consent for resource sharing. MAP resources can be requested at https://www.radc.rush.edu. An expert neurologist made a clinical AD diagnosis based on reviewing all clinical data blinded to all neuroimaging and blood tests results and postmortem data. An exclusion criterion was the current or past use of ARB or ACE inhibitors. Under sterile conditions, 50 mg of gray matter from frontal cortices was excised and kept at −80°C till analyzed.
Twenty-five milligrams of the sample were utilized for RNA isolation and preparation of cDNA. TRIzol reagent (Invitrogen, Carlsbad, CA) and DNase (Roche Applied Science, Mannheim, Germany) were used to isolate RNA and remove genomic DNA. The RNA concentration and purity of the samples were assessed by UV-Vis spectrophotometers (NanoDrop, Wilmington, DE). The RNA absorbance ratio of A260/280 ≥ 1.8 was accepted as satisfactory. Samples were also examined for RNA integrity using gel electrophoresis. Only high-quality samples were used by detecting with these methods. RNA was stored at −80°C or below. cDNA was synthesized at 37°C for 60 minutes, and the reaction was stopped by heating the reaction mix to 94°C. Polymerase chain reaction (PCR) cycling parameters were 10 minutes at 95°C and 40 cycles of 15 seconds at 95°C and 60 seconds at 60°C. For protein extraction, 25 mg of the sample was homogenized in a lysis buffer (T-PER, Pierce Biotechnology, Waltham, MA) using Bullet Blender, a high-throughput homogenizer (Thomas Scientific, Swedesboro, NJ). Total protein content was quantified using BCA assay (Pierce).
AGT, Renin, ACE, AT1R, AT2R, AT4R, NIX, and PGC1α Gene Expression
Quantitative real-time PCR was employed as previously described. In brief, cDNA was synthesized from mRNA. PCR cycling parameters and all primers were optimized using an Mx3000P Real-Time PCR System instrument (Stratagene, La Jolla, CA). The TaqMan Universal PCR Master Mix (Applied Biosystems, Foster City, CA) was used according to instructions provided by the manufacturer. TaqMan assay primers were used for AGT (Hs01586213_m1), renin (Hs00982555_m1), ACE (Hs00174179_m1), AT4R (Hs00893646_m1), NIX (Hs01087963_m1), and PGC1α (Hs01016719_m1) gene expression. AT1R gene primer sequences were F-5′-CACAGTGTGCGCGTTTCATT-3′, R-5′-TGGTAAGGCCCAGCCCTAT-3′, and AT2R gene primer sequences were F-5′-CCCTAAAAAGGTGTCCAGCATT-3′, R-5′-AGAGAGGAAGGGTTGCCAAAA-3′. A combination of 2 endogenous controls, EIF4A2 (Hs00756996_g1) and CYC1 (Hs00357718_g1), was used as housekeeping controls for normalization as previously suggested (24). We used the ΔΔCt technique to calculate the cDNA content in each sample. Relative gene expression was calculated with the 2−ΔΔCT method.
Measurement of AT1R, AT2R, AT4R, nNOS, eNOS, pERK, and PGC1α Proteins
Proteins were measured by Western blot. Fifteen micrograms of extracted proteins were resolved by 4% to a 12% acrylamide gradient sodium dodecyl sulfate–polyacrylamide gel electrophoresis midi gel allowing for protein analysis of 24 patients at a time. Internal control was included with every gel for correction of exposure time differences. Samples were then transferred to a nitrocellulose membrane using standard conditions. Membranes were blocked with 5% skim milk in TBS-T at room temperature for 1 hour. Each membrane was then incubated overnight with one of the following rigorously validated, well-characterized primary antibodies at 4°C. The following antibodies were used: AT1R (sc-515884; Santa Cruz Biotechnology, Santa Cruz, CA) (25), AT2R (sc-9040; Santa Cruz, CA) (26,27), AT4R (HPA043642; Sigma-Aldrich, St Louis, MO) (28), nNOS (NB100-858; Novus Biologicals, Littleton, CO) (29), eNOS (NB300-500; Novus, CO) (30), phosphorylated and total ERK (9101 and 9102; Cell Signaling Technology, Beverly, MA) (31), and PGC1α (NBP1-04676; Novus, CO) (32). Specificity validation of AT1R and AT2R antibodies was made by previous studies studying Chinese hamster ovary cells and naïve HEK-293T cells lacking AT1R and AT2R (26,33,34). Membranes were then washed, incubated with horseradish peroxidase-conjugated secondary antibody. After adding a chemiluminescent substrate, the signal was visualized, digitized, and quantified using a Kodak Gel Logic 2200 image workstation with its associated software. Actin was used for normalization.
Brain Oxidative Stress Measurement
Brain PCs were measured by OxiSelect ELISA according to the manufacturer’s protocol (Cell Biolabs, San Diego, CA) (35).
Quantifying Total Mitochondrial Numbers
The mitochondrial DNA copy number was quantified by PCR analysis of the total DNA extracts from brain tissues. Mitochondrial DNA copies were estimated by ND6 (mitochondrial gene)/TK2 (nuclear gene) ratio (36). The analysis was conducted using the Plaffl method.
Brain and Serum IL-6, TNF-α, IFN-γ, and IL-1β Measurement
Pro-inflammatory cytokines were measured from the brain tissue and serum of patients using Mesoscale 4-Plex cytokine assays (K15052D; Mesoscale Diagnostic, Rockville, MD).
Brain Histopathology
After brain autopsies were performed as previously described (37), aggregated amyloid-β proteins and paired helical filaments of tau tangles in slices of brain regions were identified using 10D5 (dilution 1:300; courtesy of Elan Pharmaceuticals, South San Francisco, CA). Pathologic diagnoses of AD were made using NIA-Reagan and modified CERAD criteria. Staging of neurofibrillary pathology was made by Braak Staging in the Rush MAP (37). Amyloid-β and tangle scores were calculated using the average percent density in brain slices for 8 relevant brain regions, namely, the entorhinal cortex, calcarine cortex, cingulate cortex, inferior parietal gyrus, inferior temporal gyrus, hippocampus, middle frontal gyrus (MFG), and superior frontal cortex (SFC). Finally, overall amyloid-β and tangle scores for the entire brain were obtained using the mean of those from all brain regions. SFC, MFG, hippocampal, and overall scores were used for statistical analysis.
Cognitive Performance
The cognitive performance of participants was measured by administrating a Mini-Mental State Examination and 20 cognitive performance tests each year, 19 of which assessed 5 cognitive domains, including episodic memory, semantic memory, working memory, perceptual speed, and visuospatial ability, as previously described (38). Raw scores from each test were first standardized to z-scores and averaged to yield a participant’s global cognitive function (GCF) score. We then calculated the average rate of yearly cognitive decline of all participants based on the difference in GCF score between years.
Frailty and Physical Function
Gait speed, grip strength, and a composite measure of physical frailty were obtained from the Rush MAP data (37). Composite measure of physical frailty was calculated based on 4 frailty components: grip strength, timed walk, body mass index, and fatigue. Raw score from each of the 4 component was structured so that higher values indicate poorer performance and converted to z-score by use of the mean and SD values from all participants, as previously described (37).
Statistical Analysis
SPSS 23 was used for statistical analysis. Parametric values are expressed as a mean ± SD, while nonparametric values are expressed as a median (interquartile range [IQR]). A p value of ≤.05 was used as the threshold of statistical significance. An unpaired Student’s t test for normally distributed variables and Mann–Whitney U tests for non-normally distributed variables were performed to test for the significance of differences. A chi-square test was used to compare binary variables. Correlation analysis was performed with Spearman’s correlation test. Linear regression analysis was used to test multiple effects and correlation differences. Mediation analysis was done with the bootstrapping method using the PROCESS macro for SPSS (39).
Results
Patient characteristics are shown in Table 1. Age, sex, body mass index, and education level were not significantly different between the groups. Physical performance indicators, such as gait speed, grip strength, and frailty score, were not different between the groups. Although the diagnosis of hypertension was slightly higher in the AD group (p = .01) than in the CI group, office-visit blood pressure measurements were not statistically different.
Table 1.
Group Characteristics
| CI (n = 30) | AD (n = 30) | p Value | |
|---|---|---|---|
| Age, mean (SD) | 90.2 (5.1) | 90.11 (5.7) | NA |
| Sex, male, n (%) | 5 (17) | 5 (17) | NA |
| Education, years, median (IQR) | 18 (21–16) | 18 (21–18) | .73 |
| BMI, median (IQR) | 24.0 (25.2–22.6) | 24.8 (29–23.4) | .29 |
| Walking speed, m/s, mean (SD) | 0.63 (0.24) | 0.56 (0.19) | .34 |
| Grip strength, kg, mean (SD) | 33.5 (15.1) | 30.1 (10.4) | .50 |
| Frailty score, median (IQR) | 0.45 (1.57–0.01) | 0.55 (1.02–0.12) | .68 |
| GCF score, mean (SD) | 0.13 (0.48) | −2.04 (1.12) | <.001* |
| GCF score decline per year, mean (SD) | 0.03 (0.09) | 0.18 (0.11) | <.001* |
| MMSE, median (IQR) | 28 (28–30) | 14 (3–21) | <.001* |
| Coronary artery disease, n (%) | 7 (23.3) | 7 (23.3) | 1 |
| Stroke, n (%) | 6 (20) | 6 (20) | 1 |
| Cancer, n (%) | 12 (40) | 9 (30) | .42 |
| Hypertension, n (%) | 16 (53.3) | 25 (83.3) | .01* |
| Thyroid disease, n (%) | 5 (16.7) | 11 (36.7) | .08 |
| Claudication, n (%) | 5 (16.7) | 11 (36.7) | .08 |
| Diabetes, n (%) | 3 (10) | 7 (23.3) | .17 |
| Systolic BP mean (SD) | 123.85 (19.22) | 133.69 (15.78) | .06 |
| Diastolic BP mean (SD) | 67.45 (9.74) | 72.04 (11.59) | .19 |
| PMI, hours, median (IQR) | 5.63 (15.33–4.27) | 6.93 (10.58–4.25) | .98 |
| Overall amyloid-β score, median (IQR) | 3.16 (1.12–5.7) | 6.19 (1.8–8.53) | .04* |
| Hippocampal amyloid-β score, median (IQR) | 1.15 (0–2.04) | 2.39 (0.56–3.86) | .01* |
| Superior frontal amyloid-β score, median (IQR) | 3.14 (0.75–10.03) | 5.49 (2.09–9.38) | .88 |
| Midfrontal gyrus amyloid-β score, median (IQR) | 4.96 (0.61–11.57) | 7.69 (3.20–12.07) | .04* |
| Overall tangle score, median (IQR) | 1.47 (0.57–4.70) | 6.44 (4.85–16.97) | <.001* |
| Hippocampal tangle score, median (IQR) | 4.18 (2.20–16.46) | 30.64 (14.76–38.67) | <.001* |
| Superior frontal tangle score, median (IQR) | 0.01 (0–0.16) | 1.02 (0.01–6.92) | .006* |
| Midfrontal gyrus tangle score, median (IQR) | 0.001 (0–0.1) | 0.27 (0.01–6.35) | .001* |
Notes: AD = Alzheimer’s dementia; BMI = body mass index; BP = blood pressure; CI = cognitively intact; GCF = global cognitive function; IQR = interquartile range; MMSE = Mini-Mental State Examination; PMI = postmortem interval; SD = standard deviation; NA = not applicable.
*p ≤ .05.
There Is No Difference in Brain RAS Parent Peptide (AGT) and Catalytic Enzymes (Renin and ACE) in AD Compared to CI
The RAS consists mainly of a 2-step enzymatic cascade catalyzed by renin and ACE. Renin converts the parent peptide AGT to Ang I, which is processed to Ang II by ACE. We quantified gene expression levels of brain AGT, renin, and ACE in participants with AD compared to CI participants. AGT gene expression was not different between AD and CI (p = .33; Supplementary Figure 1A). Similarly, no difference in renin gene expression (p = .07) levels was observed (Supplementary Figure 1B). Finally, there was no significant difference in ACE gene expression levels between the groups (p = .66; Supplementary Figure 1C). Given the absence of differences in the parent peptide and catalytic enzymes with AD, we next analyzed whether there were changes in the functional angiotensin receptors (AT1R, AT2R, and AT4R) in AD compared to CI brains.
Higher AT1R Protein and pERK Level in AD
The octapeptide Ang II is the main vasoactive peptide of the angiotensin system. Ang II binds with equal affinity to angiotensin receptors AT1R and AT2R, both of which are G-protein-coupled receptors (40). The functional consequences of Ang II binding are governed by receptor subtype expression and availability; that is, higher AT1R levels will trigger a more predominant AT1R response. We compared AT1R gene expression, protein levels, and phosphorylated ERK. Our results show that participants with AD have lower AT1R mRNA level (0.40-fold change [FC], p = .01; Figure 1A) and higher AT1R protein level (median [IQR] 0.59 [0.76–0.45] vs 0.47 [0.63–0.19], AD vs CI, p = .03; Figure 1B). Similarly, in the AD group we observed higher phosphorylation of the ERK (median [IQR] 0.35 [1.4–0.06] vs 0.04 [0.3–0.01], AD vs CI, p = .004; Figure 1C).
Figure 1.
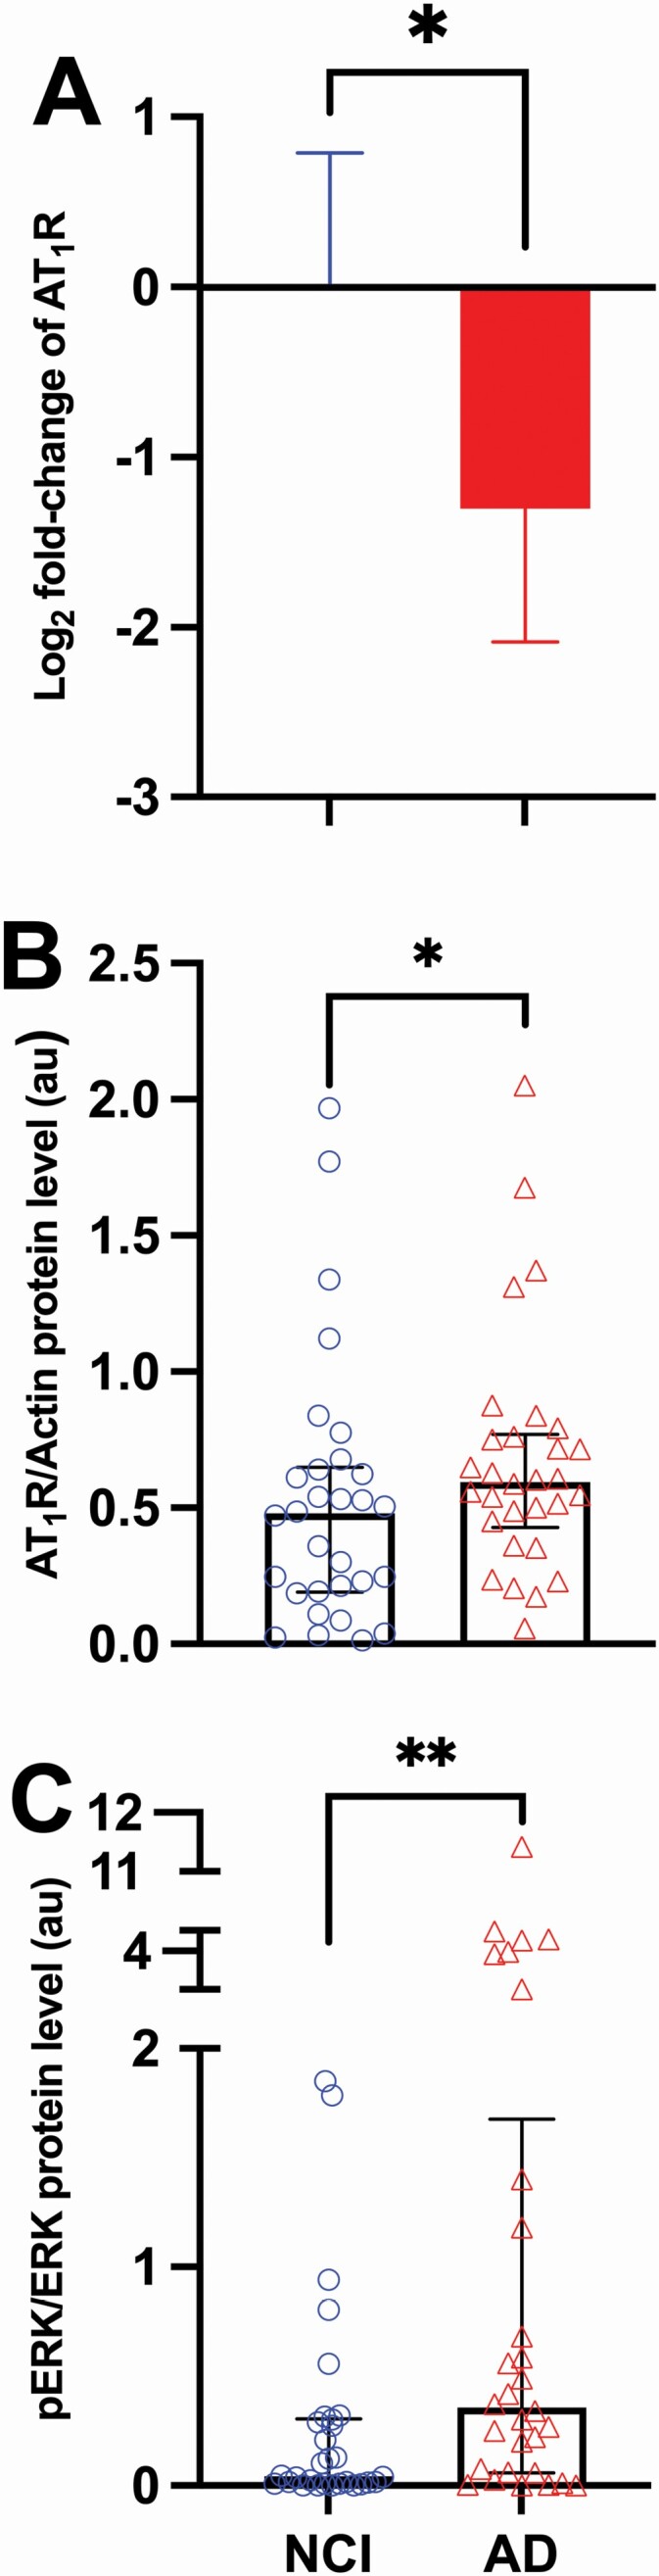
Angiotensin II type 1 receptor gene, protein, and signaling (pERK) levels in cognitively intact and Alzheimer’s dementia groups. (A) Relative gene expression of AT1R in Alzheimer’s disease (AD; n = 30) group compared to not cognitively impaired (NCI; n = 29) participants. A combination of 2 endogenous controls (CYC1 and EIF4A2) were used as housekeeping controls for normalization. Fold change was calculated with 2−ddCT method and presented as log2 in the figure. Data are presented as mean and confidence interval (CI). (B) Levels of AT1R protein in NCI (n = 30) and AD (n = 30) participants. Data are presented as median and interquartile range. (C) Levels of pERK in NCI (n = 30) and AD (n = 30) participants. Data are presented with median and interquartile range. Comparisons were conducted using Mann–Whitney U test (*p ≤ .05; **p ≤ .01). AT1R = angiotensin II type 1 receptor; AU = arbitrary unit; pERK = phosphorylated extracellular signal-regulated kinases.
In contrast, our data show that persons with AD had lower AT2R gene expression (0.38-FC, p = .01), but no difference in protein levels (p = .86; Supplementary Figure 2A and B) was observed between the groups. Given that AT2R functions through nitric oxide release, we quantified eNOS and nNOS. Our data showed no differences in nNOS or eNOS protein levels (p = .22, p = .94; Supplementary Figure 3A and B) in the brains of AD participants compared to CI participants. Nevertheless, protein levels of brain AT2R positively correlated with eNOS in both CI (r = 0.355, p = .03) and AD (r = 0.306, p = .05) groups.
Finally, the angiotensin type 4 receptor is one of the newest members of the functional RAS receptors, whose functions are directly linked to memory and cognition. No differences were seen at the mRNA level of AT4R between the groups (p = .88). AT4R protein levels were not significantly different in AD (median [IQR] 0.13 [0.51–0.03]) versus the CI group (0.17 [0.76–0.01]), p = .95 (Supplementary Figure 2C and D).
Taken together, we observed higher levels of the angiotensin II subtype 1 receptor in AD brains but with no corresponding changes in subtype 2 and subtype 4 receptors (Figure 2). The log ratio of normalized AT2R to AT1R protein levels was lower in AD compared to CI (mean [± SD], −0.02 [± 0.28] vs 0.24 [± 0.62], p = .04). To study whether that higher AT1R protein and pERK correlated with specific AT1R known effects, we next examined the association of these angiotensin receptors with mitochondrial markers, oxidative stress, and inflammation.
Figure 2.

Summary of identified brain RAS differences in Alzheimer’s dementia. ACE = angiotensin-converting enzyme; Ang = angiotensin; AP-A = aminopeptidase A; AP-N = aminopeptidase N; AT1R = angiotensin II type 1 receptor; AT2R = angiotensin II type 2 receptor; AT4R = angiotensin IV receptor; eNOS = endothelial nitric oxide synthase; nNOS = neuronal nitric oxide synthase; pERK = phosphorylated extracellular signal-regulated kinases.
AD brains have lower mitochondrial autophagy receptors (NIX) and lower total mitochondrial numbers
Age-related decline in mitochondrial energetics is a primary theory of aging and has been implicated in AD development. A biological link exists between angiotensin system dysregulation and mitochondrial dysfunction (6). Therefore, we examined differences in the mitochondrial autophagy receptor Nip3-like protein X (NIX), mitochondrial biogenesis master regulator PGC1α, and mitochondrial numbers between groups. We examined the association of these mitochondrial markers with RAS components. Gene expression levels of the mitochondrial autophagy receptor, NIX, were significantly lower in the brains of AD participants (0.61-FC, p = .04). However, there were no differences in PGC1α gene expression and protein levels between AD and CI (p = .31, p = .72, respectively). Our data show significantly lower total mitochondrial numbers in AD brains, with a median value of 0.865 (IQR 3.61–0.55) in AD brains versus 2.785 (IQR 9.03–0.79) in CI brains (p = .047; Supplementary Figure 4A).
Gene expression level of NIX positively correlated with levels of AT1R, AT2R, and AT4R genes expression in both AD (AT1R gene r = 0.387, p = .03; AT2R gene r = 0.562, p = .001; AT4R gene r = 0.570, p = .001) and CI (AT1R gene r = 0.388, p = .04, AT2R gene r = 0.514, p = .04; AT4R gene in r = 0.421, p = .02). Among the RAS receptors, protein levels of AT2R were positively correlated with PGC1α mRNA levels (r = 0.349, p = .03) only in CI brains.
Higher brain AT1R protein level was associated with higher oxidative stress marker PC levels in AD and CI (r = 0.337, p = .03, r = 0.362, p = .02, respectively; Figure 3A and B). In contrast, brain AT4R levels were negatively correlated with PC in CI (r = −0.363, p = .02; Figure 3C).
Figure 3.

Associations of oxidative stress with angiotensin II type 1 receptor (AT1R) and angiotensin type 4 receptors (AT4R). Scatter plot showing the correlation (and 95% confidence interval of the regression line) between protein carbonyl levels and (A) AT1R protein levels in not cognitively impaired (NCI) group (n = 30; r = 0.362, p ≤ .05); (B) in Alzheimer’s disease (AD) group (n = 30; r = 0.337, p ≤ .05); (C) AT4R protein levels in NCI group (n = 30; r = −0.363, p ≤ .05); (D) in AD group (n = 30; p > 0.05, ns). Spearman’s correlation was used for statistical analysis.
Inflammation has been suggested to play a role in the neuropathogenesis of AD. It remains controversial whether there is a correlation between serum and brain levels of inflammatory cytokines. Our data did not show a correlation between serum and brain cytokine levels in this relatively small sample set. Furthermore, we did not observe a difference in the brain (Supplementary Figure 5) and serum (Supplementary Figure 6) cytokine levels between AD and CI or a correlation between RAS components and cytokine levels.
AT1R protein and pERK correlated with AD brain pathology
We next analyzed the relationship between brain pathology and brain RAS differences. Tangle and amyloid-β scores of all regions were given in Table 1 for each group. As expected, both the overall tangle and amyloid-β scores were higher in AD compared to CI, with p < .001 and p = .04, respectively (Table 1). Neither amyloid-β nor tangle scores were correlated with AGT, renin, or ACE. AT1R protein was positively correlated with higher frontal cortex amyloid-β score (r = 0.245, p = .04) in overall sample (Figure 4A). In AD, pERK levels correlated with SFC amyloid-β (r = 0.416, p = .02) as well as SFC (r = 0.492, p = .01) tangle score, MFG (r = 0.459, p = .01) and overall tangle score (r = 0.459, p = .01; Supplementary Figure 7). There was no correlation between AT2R protein levels and brain pathologies. Finally, AT4R protein was negatively correlated with overall and hippocampal tangle scores (r = −0.349, p = .03, r = −0.356, p = .03, respectively) in AD (Supplementary Figure 8).
Figure 4.

Associations of AT1R protein with superior frontal cortex amyloid-β score and global cognitive function score. (A) Scatter plot showing the correlation (and 95% confidence interval of the regression line) between AT1R protein level and superior frontal cortex amyloid-β score in overall study group (n = 52; r = −0.245, p ≤ .05). (B) Scatter plot showing the correlation (and 95% confidence interval of the regression line) between AT1R protein level and global cognitive function score in overall study group (n = 60; r = −0.258, p ≤ .05). Spearman’s correlation analysis was used for analysis.
The impact of AT1R proteins on brain tangle formation is mediated through oxidative stress
We hypothesized that brain oxidative stress mediates the relationship between AT1R and AD pathologies. We constructed a mediation model using standardized independent variables and mediators with a bootstrap (n = 1 000) for testing indirect effects between AT1R protein and an AD pathology through oxidative stress. Consistent with our hypothesis, the bootstrapped path analysis of the model with AT1R and tangle formation found a significant indirect path (beta = 0.2372, 95% confidence interval [0.0487, 0.4318]) between these variables through oxidative stress. This mediated effect is partial and accounts for 35.7% of the total effect (Supplementary Figure 9). In contrast, such a significant indirect effect did not exist between AT1R and the amyloid-β.
Higher AT1R protein and pERK levels correlated with worse cognitive performance
Next, we investigated the impact of brain RAS changes on cognitive performance. Cognitive function scores of all participants were given in Table 1 for each group. As expected, GCF scores were lower in AD, with p < .001 (Table 1). No correlation between AGT, renin, or ACE levels with cognitive performance score. However, ACE levels were correlated with GCF score decline rate (r = 0.397, p = .04) but only in CI. GCF scores were negatively correlated with AT1R protein and downstream signaling pERK activity (r = −0.258, p = .02, r = −0.376, p = .002, respectively) when all samples were considered together (Figure 4B). AT1R protein levels also correlated with higher GCF score decline rates (r = 0.223, p = .04) of all participants. Interestingly, while AT2R protein levels had no correlation with cognitive score or decline, we observed that higher AT4R protein levels correlated with lower cognitive decline rates (r = −0.326, p = .04) in CI (Supplementary Figure 10).
Discussion
In this study, we show an increase in protein level of AT1R and pERK in AD compared to CI individuals. We also showed that the AT1R protein and pERK levels correlated with brain pathology and with the level of cognitive impairment. While no significant impact for AT2R, we saw some hints of a protective role for AT4R against oxidative stress, tangle formation, and cognitive decline.
Interestingly, our data show significantly lower AT1R mRNA level coupled to higher AT1R protein level, such discordant relationship may have resulted from a negative feedback loop. Prior studies have suggested that higher protein levels may downregulate the mRNA expression level to protect against overproduction of the target protein (41). Another reason for this mRNA:Protein discordance may be higher stability and longer half-lives of proteins compared to mRNA (42,43).
While prior studies have demonstrated the benefits of blocking AT1R in AD both in human (16,44) and animal (45,46) models, to the best of our knowledge only a few studies comprehensively studied RAS changes in AD brains. Our results demonstrating higher levels of AT1R in AD brains are in agreement with prior study in human brains (47).
Interestingly, prior animal studies show that upregulation of AT1R triggers a compensatory upregulation of AT2R, in young (48,49) but not in aged animals (48,50). Similarly in our study we observed that the higher levels of AT1R in our aged population did not associate with differences in brain AT2R.
The association of AT1R with oxidative stress and AD pathologies agrees with previous work assessing the deleterious impact of AT1R in animals (33,45,51–53). In particular, our data suggest that AT1R has an association with AD pathologies both directly and indirectly through oxidative stress. Higher AT1R levels are also linked to worse cognitive function prior to death. While we expected similar association between AT1R levels and brain cytokines, several factors may have contributed to this negative results including stability of cytokines in postmortem studies (54,55).
Finally, we identified that higher ACE and AT1R levels are associated with greater cognitive decline monitored over a median follow-up of 9 years. This association between ACE and the change in cognitive function is in agreement with a recent pilot study (56). Other studies demonstrated greater frontal cortex ACE activity in AD brain (57). Consistent with our finding of increased activation of the AT1R axis, another study showed increased staining intensity of ACE, angiotensin II, and AT1R in the parietal cortex of AD patients based on immunochemical alterations (47). In contrast, a study assessing AT1R and AT2R in patients with neurodegenerative diseases found no difference in receptor levels in the frontal cortex of AD compared to controls (58). Population differences and disease burden confounders may have contributed to these apparently contradicting results.
The angiotensin type 4 receptor is the newest member in the angiotensin receptor family with direct links to memory and cognitive function. While we observed no difference in AT4R levels with AD, we noted a negative correlation between brain AT4R levels and tangles formation as well as cognitive decline rates. These results are buttressed by a recent study that reported that dysregulation of the Ang-III/Ang-IV/AT4R pathway was associated with tangle formation (59).
There are several limitations to our study, including the small number of brain samples and variations in postmortem timing. Although previous studies showed that the measurement of ACE and Ang II levels was not affected by postmortem delay (59,60). In addition, given small sample size and incomplete treatment data (other treatments that may indirectly affect the angiotensin system), we could not adjust for potential confounding factors such as disease burden. Those factors may be contributed to some of our results such as pERK, oxidative stress, and mitochondrial number (61). Another limitation to our study is the low/lack of specificity of commercially available antibodies against AT1R and AT2R (62–64). Currently, Western blot techniques using validated antibodies remain the cornerstone for measuring angiotensin receptors, until the development of better and more sensitive technology. Last, we were not able to break down our findings to determine expression in different cell types since we used bulk tissue in our study. Prior research documented that frontal cortex tissue includes 63% neurons, 26% oligodendrocytes, 5% astrocytes, 4% oligodendrocyte progenitors, 3% microglia, 0.2% pericytes, and 0.2% endothelial cells (65).
Many epidemiological studies have shown potential cognitive protection benefits for RAS-modulating drugs (16,44,66). Our study dissecting brain RAS changes with AD may shed some light and may potentially offer a biologically plausible explanation for the observed protective effects of these drugs against cognitive decline.
Supplementary Material
Acknowledgments
Figures 2 and Supplementary Figure 9 were created with BioRender.com.
Funding
This work was supported by the BrightFocus Foundation Research Award (P.M.A.); and the Johns Hopkins University Claude D. Pepper Older Americans Independence Center, which is funded by the National Institute on Aging of the National Institutes of Health under award numbers P30AG021334 and NIH grants R01AG046441 and K23 AG035005 (P.M.A.); and the Nathan W. and Margaret T. Shock Aging Research Foundation, Nathan Shock Scholar in Aging (P.M.A.). This research was supported in part by the Intramural Research Program at the National Institute on Aging. Its contents are solely the authors’ responsibility and do not necessarily represent the official view of the NIH.
Conflict of Interest
None declared.
References
- 1. Almeida-Santos AF, Kangussu LM, Campagnole-Santos MJ. The renin-angiotensin system and the neurodegenerative diseases: a brief review. Protein Pept Lett. 2017;24(9):841–853. doi:10.2174/0929866524666170822120258 [DOI] [PubMed] [Google Scholar]
- 2. Dementia Statistics | Alzheimer’s Disease International. https://www.alz.co.uk/research/statistics. Published February 22, 2020. Accessed October 20, 2020.
- 3. Kehoe PG. The coming of age of the angiotensin hypothesis in Alzheimer’s disease: progress toward disease prevention and treatment? J Alzheimers Dis. 2018;62(3):1443–1466. doi:10.3233/JAD-171119 [DOI] [PMC free article] [PubMed] [Google Scholar]
- 4. Wright JW, Harding JW. Contributions by the brain renin-angiotensin system to memory, cognition, and Alzheimer’s disease. J Alzheimers Dis. 2019;67(2):469–480. doi:10.3233/JAD-181035 [DOI] [PubMed] [Google Scholar]
- 5. Ganten D, Boucher R, Genest J. Renin activity in brain tissue of puppies and adult dogs. Brain Res. 1971;33(2):557–559. doi:10.1016/0006-8993(71)90137-5 [DOI] [PubMed] [Google Scholar]
- 6. Vajapey R, Rini D, Walston J, Abadir P. The impact of age-related dysregulation of the angiotensin system on mitochondrial redox balance. Front Physiol. 2014;5:439. doi:10.3389/fphys.2014.00439 [DOI] [PMC free article] [PubMed] [Google Scholar]
- 7. Jackson L, Eldahshan W, Fagan S, Ergul A. Within the brain: the renin angiotensin system. Int J Mol Sci. 2018;19(3):876. doi:10.3390/ijms19030876 [DOI] [PMC free article] [PubMed] [Google Scholar]
- 8. Schelling P, Hutchinson JS, Ganten U, Sponer G, Ganten D. Impermeability of the blood—cerebrospinal fluid barrier for angiotensin II in rats. Clin Sci Mol Med. 1976;51(s3):399s–402s. doi:10.1042/cs051399s [DOI] [PubMed] [Google Scholar]
- 9. Wright JW, Harding JW. The brain renin–angiotensin system: a diversity of functions and implications for CNS diseases. Pflüg Arch—Eur J Physiol. 2013;465(1):133–151. doi:10.1007/s00424-012-1102-2 [DOI] [PubMed] [Google Scholar]
- 10. Biancardi VC, Son SJ, Ahmadi S, Filosa JA, Stern JE. Circulating angiotensin II gains access to the hypothalamus and brain stem during hypertension via breakdown of the blood–brain barrier. Hypertension. 2014;63(3):572–579. doi:10.1161/HYPERTENSIONAHA.113.01743 [DOI] [PMC free article] [PubMed] [Google Scholar]
- 11. Mecocci P, Boccardi V, Cecchetti R, et al. A long journey into aging, brain aging, and Alzheimer’s disease following the oxidative stress tracks. J Alzheimers Dis. 2018;62(3):1319–1335. doi:10.3233/JAD-170732 [DOI] [PMC free article] [PubMed] [Google Scholar]
- 12. Wright JW, Kawas LH, Harding JW. The development of small molecule angiotensin IV analogs to treat Alzheimer’s and Parkinson’s diseases. Prog Neurobiol. 2015;125:26–46. doi:10.1016/j.pneurobio.2014.11.004 [DOI] [PubMed] [Google Scholar]
- 13. Royea J, Zhang L, Tong XK, Hamel E. Angiotensin IV receptors mediate the cognitive and cerebrovascular benefits of Losartan in a mouse model of Alzheimer’s disease. J Neurosci. 2017;37(22):5562–5573. doi:10.1523/JNEUROSCI.0329-17.2017 [DOI] [PMC free article] [PubMed] [Google Scholar]
- 14. Cosarderelioglu C, Nidadavolu LS, George CJ, et al. Brain renin-angiotensin system at the intersect of physical and cognitive frailty. Front Neurosci. 2020;14:586314. doi:10.3389/fnins.2020.586314 [DOI] [PMC free article] [PubMed] [Google Scholar]
- 15. Li NC, Lee A, Whitmer RA, et al. Use of angiotensin receptor blockers and risk of dementia in a predominantly male population: prospective cohort analysis. BMJ. 2010;340:b5465. doi:10.1136/bmj.b5465 [DOI] [PMC free article] [PubMed] [Google Scholar]
- 16. Yasar S, Xia J, Yao W, et al. ; Ginkgo Evaluation of Memory (GEM) Study Investigators . Antihypertensive drugs decrease risk of Alzheimer disease: Ginkgo Evaluation of Memory Study. Neurology. 2013;81(10):896–903. doi:10.1212/WNL.0b013e3182a35228 [DOI] [PMC free article] [PubMed] [Google Scholar]
- 17. Ho JK, Nation DA; Alzheimer’s Disease Neuroimaging Initiative . Memory is preserved in older adults taking AT1 receptor blockers. Alzheimers Res Ther. 2017;9(1):33. doi:10.1186/s13195-017-0255-9 [DOI] [PMC free article] [PubMed] [Google Scholar]
- 18. Corbett A, Pickett J, Burns A, et al. Drug repositioning for Alzheimer’s disease. Nat Rev Drug Discov. 2012;11(11):833–846. doi:10.1038/nrd3869 [DOI] [PubMed] [Google Scholar]
- 19. Matrougui K, Eskildsen-Helmond YE, Fiebeler A, et al. Angiotensin II stimulates extracellular signal-regulated kinase activity in intact pressurized rat mesenteric resistance arteries. Hypertension. 2000;36(4):617–621. doi:10.1161/01.hyp.36.4.617 [DOI] [PubMed] [Google Scholar]
- 20. Mehta PK, Griendling KK. Angiotensin II cell signaling: physiological and pathological effects in the cardiovascular system. Am J Physiol Cell Physiol. 2007;292(1):C82–C97. doi:10.1152/ajpcell.00287.2006 [DOI] [PubMed] [Google Scholar]
- 21. Kawai T, Forrester SJ, O’Brien S, Baggett A, Rizzo V, Eguchi S. AT1 receptor signaling pathways in the cardiovascular system. Pharmacol Res. 2017;125(Pt A):4–13. doi:10.1016/j.phrs.2017.05.008 [DOI] [PMC free article] [PubMed] [Google Scholar]
- 22. Eguchi S, Kawai T, Scalia R, Rizzo V. Understanding angiotensin II type 1 receptor signaling in vascular pathophysiology. Hypertension. 2018;71(5):804–810. doi:10.1161/HYPERTENSIONAHA.118.10266 [DOI] [PMC free article] [PubMed] [Google Scholar]
- 23. Forrester SJ, Booz GW, Sigmund CD, et al. Angiotensin II signal transduction: an update on mechanisms of physiology and pathophysiology. Physiol Rev. 2018;98(3):1627–1738. doi:10.1152/physrev.00038.2017 [DOI] [PMC free article] [PubMed] [Google Scholar]
- 24. Penna I, Vella S, Gigoni A, Russo C, Cancedda R, Pagano A. Selection of candidate housekeeping genes for normalization in human postmortem brain samples. Int J Mol Sci. 2011;12(9):5461–5470. doi:10.3390/ijms12095461 [DOI] [PMC free article] [PubMed] [Google Scholar]
- 25. Diaz-Ruiz C, Villar-Cheda B, Dominguez-Meijide A, Garrido-Gil P, Guerra MJ, Labandeira-Garcia JL. Aging-related overactivity of the angiotensin/AT1 axis decreases sirtuin 3 levels in the substantia nigra, which induces vulnerability to oxidative stress and neurodegeneration. J Gerontol A Biol Sci Med Sci. 2020;75(3):416–424. doi:10.1093/gerona/gly259 [DOI] [PubMed] [Google Scholar]
- 26. Abadir PM, Foster DB, Crow M, et al. Identification and characterization of a functional mitochondrial angiotensin system. Proc Natl Acad Sci USA. 2011;108(36):14849–14854. doi:10.1073/pnas.1101507108 [DOI] [PMC free article] [PubMed] [Google Scholar]
- 27. Garcia-Garrote M, Perez-Villalba A, Garrido-Gil P, et al. Interaction between angiotensin type 1, type 2, and Mas receptors to regulate adult neurogenesis in the brain ventricular–subventricular zone. Cells. 2019;8(12):1551. doi:10.3390/cells8121551. [DOI] [PMC free article] [PubMed] [Google Scholar]
- 28. Drobin K, Assadi G, Hong MG, et al. Targeted analysis of serum proteins encoded at known inflammatory bowel disease risk loci. Inflamm Bowel Dis. 2019;25(2):306–316. doi:10.1093/ibd/izy326 [DOI] [PMC free article] [PubMed] [Google Scholar]
- 29. Auta J, Gatta E, Davis JM, Zhang H, Pandey SC, Guidotti A. Essential role for neuronal nitric oxide synthase in acute ethanol-induced motor impairment. Nitric Oxide. 2020;100–101:50–56. doi:10.1016/j.niox.2020.04.003 [DOI] [PMC free article] [PubMed] [Google Scholar]
- 30. Nelson RK, Ya-Ping J, Gadbery J, et al. Phospholipase D2 loss results in increased blood pressure via inhibition of the endothelial nitric oxide synthase pathway. Sci Rep. 2017;7(1):9112. doi:10.1038/s41598-017-09852-4 [DOI] [PMC free article] [PubMed] [Google Scholar]
- 31. Cortese GP, Barrientos RM, Maier SF, Patterson SL. Aging and a peripheral immune challenge interact to reduce mature brain-derived neurotrophic factor and activation of TrkB, PLCgamma1, and ERK in hippocampal synaptoneurosomes. J Neurosci. 2011;31(11):4274–4279. doi:10.1523/JNEUROSCI.5818-10.2011 [DOI] [PMC free article] [PubMed] [Google Scholar]
- 32. Kumar M, Acevedo-Cintrón J, Jhaldiyal A, et al. Defects in mitochondrial biogenesis drive mitochondrial alterations in PARKIN-deficient human dopamine neurons. Stem Cell Reports. 2020;15(3):629–645. doi:10.1016/j.stemcr.2020.07.013 [DOI] [PMC free article] [PubMed] [Google Scholar]
- 33. Valenzuela R, Costa-Besada MA, Iglesias-Gonzalez J, et al. Mitochondrial angiotensin receptors in dopaminergic neurons. Role in cell protection and aging-related vulnerability to neurodegeneration. Cell Death Dis. 2016;7(10):e2427. doi:10.1038/cddis.2016.327 [DOI] [PMC free article] [PubMed] [Google Scholar]
- 34. Franco R, Lillo A, Rivas-Santisteban R, et al. Functional complexes of angiotensin-converting enzyme 2 and renin-angiotensin system receptors: expression in adult but not fetal lung tissue. Int J Mol Sci. 2020;21(24):E9602. doi:10.3390/ijms21249602 [DOI] [PMC free article] [PubMed] [Google Scholar]
- 35. Maity-Kumar G, Thal DR, Baumann B, Scharffetter-Kochanek K, Wirth T. Neuronal redox imbalance results in altered energy homeostasis and early postnatal lethality. FASEB J. 2015;29(7):2843–2858. doi:10.1096/fj.14-265157 [DOI] [PubMed] [Google Scholar]
- 36. Gu F, Chauhan V, Kaur K, et al. Alterations in mitochondrial DNA copy number and the activities of electron transport chain complexes and pyruvate dehydrogenase in the frontal cortex from subjects with autism. Transl Psychiatry. 2013;3:e299. doi:10.1038/tp.2013.68 [DOI] [PMC free article] [PubMed] [Google Scholar]
- 37. Bennett DA, Schneider JA, Buchman AS, Barnes LL, Boyle PA, Wilson RS. Overview and findings from the rush Memory and Aging Project. Curr Alzheimer Res. 2012;9(6):646–663. doi:10.2174/156720512801322663 [DOI] [PMC free article] [PubMed] [Google Scholar]
- 38. Wilson RS, Boyle PA, Yu L, et al. Temporal course and pathologic basis of unawareness of memory loss in dementia. Neurology. 2015;85(11):984–991. doi:10.1212/WNL.0000000000001935 [DOI] [PMC free article] [PubMed] [Google Scholar]
- 39. Preacher KJ, Hayes AF. SPSS and SAS procedures for estimating indirect effects in simple mediation models. Behav Res Methods Instrum Comput. 2004;36(4):717–731. doi:10.3758/bf03206553 [DOI] [PubMed] [Google Scholar]
- 40. Chow BSM, Allen TJ. Angiotensin II type 2 receptor (AT2R) in renal and cardiovascular disease. Clin Sci (Lond Engl 1979). 2016;130(15):1307–1326. doi:10.1042/CS20160243 [DOI] [PubMed] [Google Scholar]
- 41. Chen G, Gharib TG, Huang CC, et al. Discordant protein and mRNA expression in lung adenocarcinomas. Mol Cell Proteomics. 2002;1(4):304–313. doi:10.1074/mcp.m200008-mcp200 [DOI] [PubMed] [Google Scholar]
- 42. Greenbaum D, Colangelo C, Williams K, Gerstein M. Comparing protein abundance and mRNA expression levels on a genomic scale. Genome Biol. 2003;4(9):117. doi:10.1186/gb-2003-4-9-117 [DOI] [PMC free article] [PubMed] [Google Scholar]
- 43. Buccitelli C, Selbach M. mRNAs, proteins and the emerging principles of gene expression control. Nat Rev Genet. 2020;21(10):630–644. doi:10.1038/s41576-020-0258-4 [DOI] [PubMed] [Google Scholar]
- 44. Zhuang S, Wang HF, Wang X, Li J, Xing CM. The association of renin-angiotensin system blockade use with the risks of cognitive impairment of aging and Alzheimer’s disease: a meta-analysis. J Clin Neurosci. 2016;33:32–38. doi:10.1016/j.jocn.2016.02.036 [DOI] [PubMed] [Google Scholar]
- 45. Danielyan L, Klein R, Hanson LR, et al. Protective effects of intranasal losartan in the APP/PS1 transgenic mouse model of Alzheimer disease. Rejuvenation Res. 2010;13(2–3):195–201. doi:10.1089/rej.2009.0944 [DOI] [PubMed] [Google Scholar]
- 46. Tian M, Zhu D, Xie W, Shi J. Central angiotensin II-induced Alzheimer-like tau phosphorylation in normal rat brains. FEBS Lett. 2012;586(20):3737–3745. doi:10.1016/j.febslet.2012.09.004 [DOI] [PubMed] [Google Scholar]
- 47. Savaskan E, Hock C, Olivieri G, et al. Cortical alterations of angiotensin converting enzyme, angiotensin II and AT1 receptor in Alzheimer’s dementia. Neurobiol Aging. 2001;22(4):541–546. doi:10.1016/s0197-4580(00)00259-1 [DOI] [PubMed] [Google Scholar]
- 48. Villar-Cheda B, Rodríguez-Pallares J, Valenzuela R, et al. Nigral and striatal regulation of angiotensin receptor expression by dopamine and angiotensin in rodents: implications for progression of Parkinson’s disease. Eur J Neurosci. 2010;32(10):1695–1706. doi:10.1111/j.1460-9568.2010.07448.x [DOI] [PubMed] [Google Scholar]
- 49. Villar-Cheda B, Costa-Besada MA, Valenzuela R, Perez-Costas E, Melendez-Ferro M, Labandeira-Garcia JL. The intracellular angiotensin system buffers deleterious effects of the extracellular paracrine system. Cell Death Dis. 2017;8(9):e3044. doi:10.1038/cddis.2017.439 [DOI] [PMC free article] [PubMed] [Google Scholar]
- 50. Villar-Cheda B, Valenzuela R, Rodriguez-Perez AI, Guerra MJ, Labandeira-Garcia JL. Aging-related changes in the nigral angiotensin system enhances proinflammatory and pro-oxidative markers and 6-OHDA-induced dopaminergic degeneration. Neurobiol Aging. 2012;33(1):204.e1–204.e11. doi:10.1016/j.neurobiolaging.2010.08.006 [DOI] [PubMed] [Google Scholar]
- 51. Chan Samuel HH, Kuei-Sen H, Chiung-Chun H, Ling-Lin W, Chen-Chun O, Chan Julie YH. NADPH oxidase-derived superoxide anion mediates angiotensin II-induced pressor effect via activation of p38 mitogen-activated protein kinase in the rostral ventrolateral medulla. Circ Res. 2005;97(8):772–780. doi:10.1161/01.RES.0000185804.79157.C0. [DOI] [PubMed] [Google Scholar]
- 52. Gebre AK, Altaye BM, Atey TM, Tuem KB, Berhe DF. Targeting renin-angiotensin system against Alzheimer’s disease. Front Pharmacol. 2018;9:440. doi:10.3389/fphar.2018.00440 [DOI] [PMC free article] [PubMed] [Google Scholar]
- 53. Tian M, Lin X, Wu L, Lu J, Zhang Y, Shi J. Angiotensin II triggers autophagy and apoptosis in PC12 cell line: an in vitro Alzheimer’s disease model. Brain Res. 2019;1718:46–52. doi:10.1016/j.brainres.2019.05.002 [DOI] [PubMed] [Google Scholar]
- 54. Saper CB, Breder CD. Chapter 28—endogenous pyrogens in the CNS: role in the febrile response. In: Swaab DF, Hofman MA, Mirmiran M, Ravid R, Van Leeuwen FW, eds. Progress in Brain Research. Vol. 93. The Human Hypothalamus in Health and Disease. Elsevier; 1992:419–429. doi:10.1016/S0079-6123(08)64587-2 [DOI] [PubMed] [Google Scholar]
- 55. Tweedie D, Karnati HK, Mullins R, et al. Time-dependent cytokine and chemokine changes in mouse cerebral cortex following a mild traumatic brain injury. eLife. 2020;9:e55827. doi:10.7554/eLife.55827 [DOI] [PMC free article] [PubMed] [Google Scholar]
- 56. Yasar S, Varma VR, Harris GC, Carlson MC. Associations of angiotensin converting enzyme-1 and angiotensin II blood levels and cognitive function. J Alzheimers Dis. 2018;63(2):655–664. doi:10.3233/JAD-170944 [DOI] [PMC free article] [PubMed] [Google Scholar]
- 57. Arregui A, Perry EK, Rossor M, Tomlinson BE. Angiotensin converting enzyme in Alzheimer’s disease increased activity in caudate nucleus and cortical areas. J Neurochem. 1982;38(5):1490–1492. doi:10.1111/j.1471-4159.1982.tb07930.x [DOI] [PubMed] [Google Scholar]
- 58. Ge J, Barnes NM. Alterations in angiotensin AT1 and AT2 receptor subtype levels in brain regions from patients with neurodegenerative disorders. Eur J Pharmacol. 1996;297(3):299–306. doi:10.1016/0014-2999(95)00762-8 [DOI] [PubMed] [Google Scholar]
- 59. Kehoe PG, Hibbs E, Palmer LE, Miners JS. Angiotensin-III is increased in Alzheimer’s disease in association with amyloid-β and tau pathology. J Alzheimers Dis. 2017;58(1):203–214. doi:10.3233/JAD-161265 [DOI] [PubMed] [Google Scholar]
- 60. Barnes NM, Cheng CH, Costall B, Naylor RJ, Williams TJ, Wischik CM. Angiotensin converting enzyme density is increased in temporal cortex from patients with Alzheimer’s disease. Eur J Pharmacol. 1991;200(2–3):289–292. doi:10.1016/0014-2999(91)90584-d [DOI] [PubMed] [Google Scholar]
- 61. Dhillon AS, Hagan S, Rath O, Kolch W. MAP kinase signalling pathways in cancer. Oncogene. 2007;26(22):3279–3290. doi:10.1038/sj.onc.1210421 [DOI] [PubMed] [Google Scholar]
- 62. Benicky J, Hafko R, Sanchez-Lemus E, Aguilera G, Saavedra JM. Six commercially available angiotensin II AT1 receptor antibodies are non-specific. Cell Mol Neurobiol. 2012;32(8):1353–1365. doi:10.1007/s10571-012-9862-y [DOI] [PMC free article] [PubMed] [Google Scholar]
- 63. Herrera M, Sparks MA, Alfonso-Pecchio AR, Harrison-Bernard LM, Coffman TM. Lack of specificity of commercial antibodies leads to misidentification of angiotensin type 1 receptor protein. Hypertension. 2013;61(1):253–258. doi:10.1161/HYPERTENSIONAHA.112.203679 [DOI] [PMC free article] [PubMed] [Google Scholar]
- 64. Hafko R, Villapol S, Nostramo R, et al. Commercially available angiotensin II At₂ receptor antibodies are nonspecific. PLoS One. 2013;8(7):e69234. doi:10.1371/journal.pone.0069234 [DOI] [PMC free article] [PubMed] [Google Scholar]
- 65. Mathys H, Davila-Velderrain J, Peng Z, et al. Single-cell transcriptomic analysis of Alzheimer’s disease. Nature. 2019;570(7761):332–337. doi:10.1038/s41586-019-1195-2 [DOI] [PMC free article] [PubMed] [Google Scholar]
- 66. Barthold D, Joyce G, Diaz Brinton R, Wharton W, Kehoe PG, Zissimopoulos J. Association of combination statin and antihypertensive therapy with reduced Alzheimer’s disease and related dementia risk. PLoS One. 2020;15(3):e0229541. doi:10.1371/journal.pone.0229541 [DOI] [PMC free article] [PubMed] [Google Scholar]
Associated Data
This section collects any data citations, data availability statements, or supplementary materials included in this article.