

Abstract
The U.S. Internal Revenue Service (IRS) makes publicly and freely available period migration data at the state and county levels. Among their uses, these data inform estimates of net-migration as part of the U.S. Census Bureau’s Population Estimates Program, which, in turn, are used for producing other annual statistics, survey design, business and community planning, and federal funding allocations. Building on and extending prior research, we devote this Research Brief to documenting from multiple new angles a highly concerning and apparently systemic problem with the IRS migration data since the IRS took over responsibilities for preparing these data from the U.S. Census Bureau in 2011. As we then discuss, despite the fact that the IRS provides documentation detailing changes that it made to how it prepares these data relative to how the U.S. Census Bureau prepared them, it is not clear why or how these changes would result in the problem detailed in our analysis. Given that this problem appears to be an internal one within the IRS, we conclude by suggesting that the post 2011-12 IRS migration data not be used until this problem is resolved, and we encourage the IRS to do so quickly, transparently, and collaboratively.
Keywords: Migration, Internal migration, Migration data, Internal Revenue Service, U.S. Census Bureau
Introduction and Background
The Statistics of Income program in the U.S. Internal Revenue Service (IRS) makes publicly and freely available period migration data at the state and county levels (Gross 2005; Pierce 2015).1 The IRS migration data are derived from address information contained in consecutive (i.e., year-to-year) tax returns and are estimated to cover about 87 percent of all U.S. households (Molloy et al. 2011). Against the backdrop of the discontinuation of the census long form and the weaknesses of other publicly available sources of U.S. migration data, the IRS migration data are unique and valuable given their temporal and geographic specificity insofar as they provide period estimates of state and county out- and in-migration, as well as state-to-state and county-to-county migration (DeWaard et al. 2019; Hauer and Byars 2019; Engels and Healy 1981; Isserman et al. 1982; Molloy et al. 2011).
The principal use of the IRS migration data by the U.S. Census Bureau is to generate state and county estimates of net-migration as part of its Population Estimates Program (Toukabri 2017). Net-migration is an input into the demographic balancing equation and is used to generate intercensal population estimates, which have been shown to be highly accurate (U.S. Census Bureau 2020). These population estimates are subsequently used for many purposes, including producing other annual statistics, survey design, business and community planning, and federal funding allocations.
Scholarly researchers also use the IRS migration data in many applications. Early research using these data focused on describing and analyzing the U.S. migration system (McHugh and Gober 1992; Plane 1987). These efforts were later expanded to examine similarities and differences in migration across U.S. regions and the rural-urban continuum (Ambinakudige and Parisi 2017; DeWaard et al. 2020; Henrie and Plane 2008; Molloy et al. 2011; Plane, Henrie, and Perry 2005; Shumway and Otterstrom 2010, 2015). For example, in a paper recently published in Population Research and Policy Review, Golding and Winkler (2020) used the IRS migration data to document heterogeneity in place-based migration patterns along a modified rural-urban continuum classification system that they developed and termed the Rural-Urban Gradient (RUG). The IRS migration data have also been used to study the impacts of economic shocks and incentives on migration (Coomes and Hoyt 2008; Vias 2010). Finally, the IRS migration data have been used to study the relationship between climate and environmental change, including extreme weather events like hurricanes and other hazards such as sea level rise, and migration from and to affected states and counties (Curtis et al. 2015, 2020; DeWaard et al. 2016; Fussell et al. 2014; Hauer 2017; Shumway et al. 2014; Strobl 2011; Winkler and Rouleau 2020).
The IRS migration data are produced as follows (Gross 2005; Pierce 2015). First, taxpayer identification numbers (TINs) are used to match tax returns in consecutive years, the tax year and the tax-filing year.2 Second, among matched tax returns, migrant returns are defined as those with non-matching states or counties of residence in consecutive years. Non-migrant returns are likewise defined as those with matching states or counties of residence. Third, total counts of tax returns and tax exemptions, roughly equivalent to households and individuals, respectively, and the total adjusted gross income (AGI) contained in these migrant and non-migrant returns are then tallied up at the state and county levels and subsequently disseminated.
There are three main limitations of the IRS migration data (DeWaard et al 2019, 2020; Hauer and Byars 2019). First, because these data are generated from tax returns, they exclude those who do not file a tax return. This means that groups that do not have earned income and therefore do not file a tax return (e.g., retirees and the poor) are underrepresented in these data. Second, these data provide limited information. The public use dataset includes only three variables: total counts of migrant and non-migrant returns (i.e., households), exemptions (i.e. individuals), and AGI at the state and county levels.
The third limitation of the IRS migration data, which is the jumping off point for this this Research Brief, is that the most recent data “are not directly comparable” with the data from prior years (Pierce 2015:2; see also DeWaard et al. 2020; Golding and Winkler 2020; Stone 2016). Prior to 2011-12, the IRS migration data were prepared by the U.S. Census Bureau, which, due to internal constraints and deadlines, excluded tax returns filed after the end of September each calendar year (Gross 2005). Starting in 2011-12, the IRS assumed responsibility for preparing these data and expanded the set of tax returns to include those filed by the end of December of each of calendar year (Pierce 2015). The IRS also used additional TINs—specifically, those of primary, secondary, and dependent filers—to increase match rates of tax returns in consecutive years by nearly five percent. Finally, in 2015, the IRS implemented additional changes to their processes and procedures in an effort to combat identify theft and exclude potentially fraudulent tax returns.3
The above sorts of comparability issues can be and frequently are successfully managed by migration researchers when the source(s) of discontinuities are understood. However, as first documented by Stone (2016) and later by DeWaard et al. (2020) and Golding and Winkler (2020), starting in 2011-12 when the IRS took over responsibility for preparing the IRS migration data from the U.S. Census Bureau, the rate of gross migration at both the state and county levels began to fluctuate wildly—including the steepest decline on record in 2014-15—relative to previous estimates going back to the early 1990s. Stone (2016) also showed that estimates of net-migration during and after 2011-12 were affected, but that these changes were more muted than changes in gross migration. Importantly and unfortunately, Stone (2016) observed, these fluctuations are not readily explained by the IRS’s own account of changes that it made to how it prepares these data relative to how the U.S. Census Bureau prepared them (Pierce 2015).
Given the importance of the IRS migration data in both scholarly and applied settings, we build on and extend the work described above by devoting the entirety of this Research Brief to further documenting this problem with the IRS migration data from multiple new angles. Specifically, we begin by providing a view of this problem from the vantage points of selected U.S. counties. We then document this problem for the United States as a whole. This followed by further sub-setting our estimates of out-, in-, and net-migration by pertinent county-level characteristics. In doing so, we hope to bring greater public awareness to this problem with the IRS migration data and the need to resolve it quickly, transparently, and collaboratively.
Approach and Results
In this section, we start by detailing our observation of the aforementioned problem in the course of a current strand of research by most of the authors of this Research Brief that uses the IRS migration data to study migration from U.S. counties impacted by extreme weather disasters (Curtis et al. 2015, 2020; DeWaard et al. 2016; Fussell et al. 2014; Hauer 2017). In Figure 1, we display period probabilities of household migration from four disaster-affected counties. We also display differences, expressed in standard deviation units, for each period in the probability of migration from the average level of migration between 1990-91 and 2017-18.4 Orleans Parish, LA, and Plaquemines Parish, LA, were impacted by Hurricane Katrina in 2005 and were among the counties that experienced the greatest property losses and property losses per capita, respectively (CEMHS 2019). Jasper County, MO, was impacted by the Joplin Tornado in 2011 and experienced the greatest property losses and property losses per capita among all affected counties. Finally, the 2018 Camp Fire was largely concentrated in Paradise, CA, which is located in Butte County, CA.
Figure 1. Probability of household migration at county level and difference from time series mean: 1990-91 to 2017-18.

Note: Vertical grey bar corresponds to disaster period. For ease of display, the scales of y-axes are not common across graphs.
As is evident, migration from these four counties increased during the period in which the extreme weather disaster occurred. While the levels of and changes in migration clearly differ across these counties, and the volatility in some of these time series might make it difficult in some cases (e.g., Jasper County) to identify the impact of a given disaster, it is striking that a curious pattern emerges after 2011-12 when the IRS took over responsibility for preparing the IRS migration data from the U.S. Census Bureau (Pierce 2015). Specifically, in each county, migration fell precipitously between 2012-13 and 2014-15. Migration then increased dramatically through 2016-17. Migration then sharply decreased or, in the case of Butte County, CA, increased thereafter. At least three features of this pattern are particularly noteworthy relative to earlier levels of and changes in migration in the IRS time series: the extreme levels of migration in 2014-15 and 2016-17, the abruptness of changes in migration between 2012-13 and 2017-18, and the highly linear nature of these changes. What is more, to our knowledge, there is no obvious substantive explanation that can account for this extreme volatility in the IRS migration data after 2011-12.
Going beyond individual counties, in Figure 2, we display period rates of household out-, in-, and net-migration averaged across all U.S. counties, as well as corresponding differences, again expressed in standard deviation units, for each period rate of migration from the average rate of migration between 1990-91 and 2017-18. Similar to in Figure 1, the rates of out- and in-migration exhibit considerable volatility after 2011-12. Interestingly, not only did the rates of out- and in-migration fall sharply between 2012-13 and 2014-15, they apparently reached levels that were not even reached during the 2007-2009 Great Recession, which is part of a decades’ long “Great American Migration Slowdown” (Frey 2009:1; see also DeWaard et al. 2020; Johnson 2017). The rates of out- and in-migration then increased dramatically through 2016-17 and to the highest levels on record, at least since 1990-91, before declining sharply thereafter.
Figure 2.

Rate of household migration at county level and difference from time series mean: 1990-91 to 2017-18
Recalling our earlier point that one of the principal uses of the IRS migration data is by the U.S. Census Bureau to generate estimates of net-migration as part of its Population Estimates Program (Toukabri 2017), the rate of net-migration in Figure 2 exhibits considerably less volatility than the rates of out- and in-migration, which are largely offsetting. As a result, there is perhaps less reason to be concerned about estimates of net-migration after 2011-12 (Johnson 2017). That said, as we noted at the beginning of this section, some research questions (e.g., those concerning migration from U.S. counties impacted by extreme weather disasters) require separate data on out- and in-migration. Based on our analysis thus far, there seem to be good reasons to be concerned about the post 2011-12 IRS data on out- and in-migration.
The remainder of our analysis in this section is devoted to breaking down the rates of out-, in-, and net-migration displayed in Figure 2 to see if the observed volatility in the post 2011-12 IRS migration data varies by pertinent county characteristics. In Figure 3, we start by displaying rates of out-, in-, and net-migration, as well as corresponding differences, by U.S. region. We observe the same highly volatile patterns of out- and in-migration in each region after 2011-12, with the magnitudes of these swings on the order of ± 2-4 standard deviations from the means of their respective time series. Similar to Figure 2, because the rates of out- and in-migration in each region closely parallel one another, the corresponding rates of net-migration exhibit relatively less volatility. That said, recalling our earlier point that the U.S. Census Bureau uses the IRS migration data to generate estimates of net-migration as part of its Population Estimates Program (Toukabri 2017), it is worth pointing out the increases in net-migration in the Midwest in 2011-12 and in the South and West in 2016-17.
Figure 3.
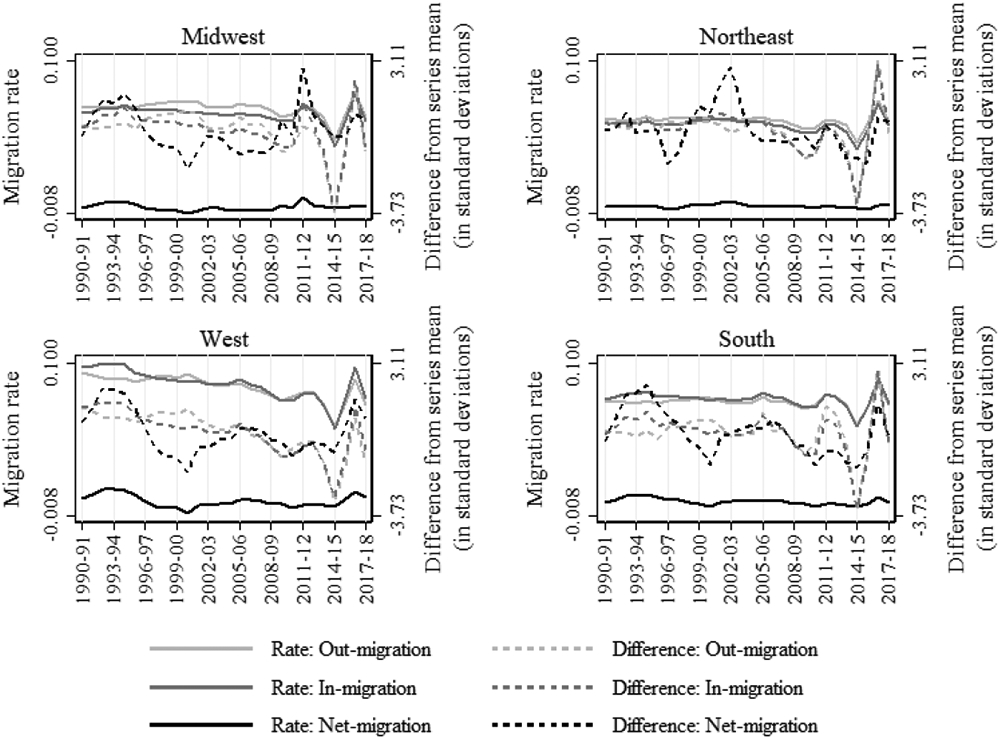
Rate of household migration at county level and difference from time series mean by region: 1990-91 to 2017-18
To further examine whether the observed volatility in the post 2011-12 IRS migration data varies (or not) across counties, we look across the rural-urban continuum. To do this, we merged county-level census data on the population living in urban versus rural areas provided by IPUMS-NHGIS to the IRS migration data (Manson et al. 2020). For each period, we then calculated the percent of the population in each county living in urban areas and subsequently grouped counties into quartiles. In Figure 4, we display rates of out-, in-, and net-migration, as well as corresponding differences from the means of their respective time series, by percent urban quartile. As is evident, in each quartile, we continue to observe the same highly volatile pattern of out- and in-migration in the post 2011-12 IRS migration data defined by a sharp decrease, increase, and then decrease in migration between 2011-12 and 2017-18, with the magnitudes of these changes comparable to those observed in Figures 2 and 3. Given the offsetting nature of changes in out- and in-migration, corresponding changes in net-migration are again relatively muted with the exceptions of 2011-12 and 2016-17 in the first quartile and 2016-17 in the second quartile.
Figure 4.

Rate of household migration at county level and difference from time series mean by county percent urban: 1990-91 to 2017-18
As a third and final step, we broke down the rates of out-, in-, and net-migration by income quartile using data on county median income from IPUMS-NHGIS (Manson et al. 2020). In doing so, our thinking here, which we revisit in the next section of this Research Brief, is that perhaps those living in higher income counties have more complicated tax returns and, as a result, take longer to file their tax returns. If so, then we might see variation across county median income quartiles in the rates of out-, in-, and net-migration given that the IRS included tax returns filed by the end of December of each calendar year when it took over responsibility for preparing the IRS migration data from the U.S. Census Bureau 2011 (Pierce 2015). In Figure 5, we display rates of out-, in-, and net-migration, as well as corresponding differences from the means of their respective time series, by county median income quartile. As with our previous results in Figures 2-4, we observe no obvious variation across quartiles in the highly volatile patterns of out- and in-migration after 2011-12. And, with few exceptions, changes in net-migration are again relatively muted.
Figure 5.
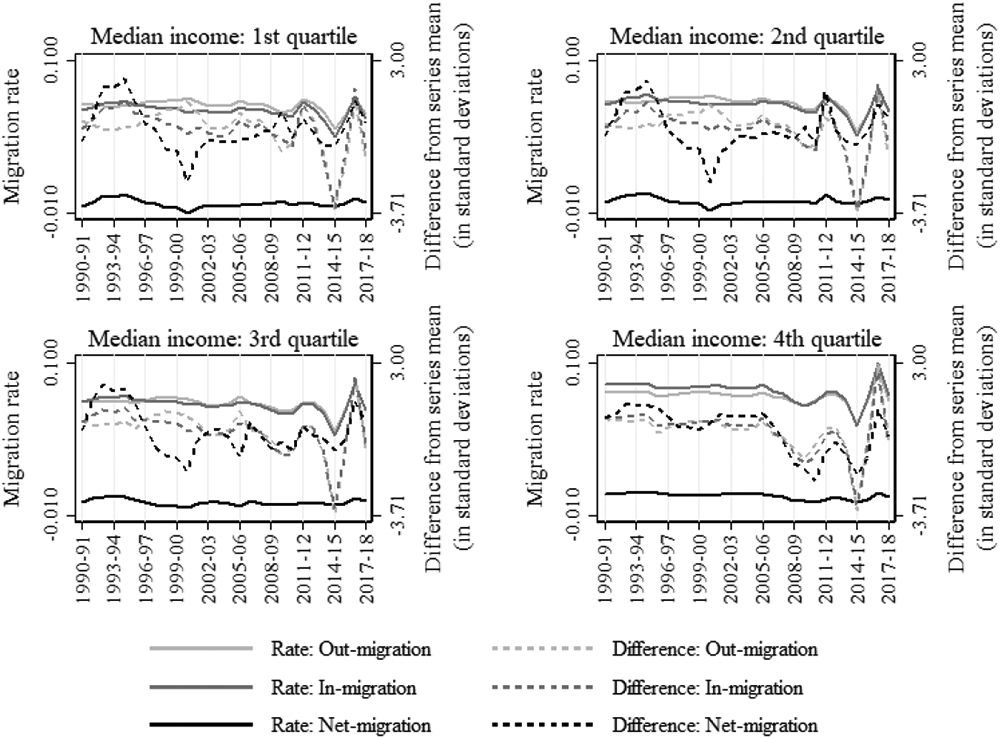
Rate of household migration at county level and difference from time series mean by county median income: 1990-91 to 2017-18
Discussion and Conclusion
Informed by observations in prior research (DeWaard et al. 2020; Golding and Winkler 2020; Stone 2016), we devoted this Research Brief to documenting a highly concerning and apparently systemic problem with the IRS migration data from multiple angles that, unfortunately, cannot be explained by the IRS’s own account of the changes that it made to how it prepares these data relative to how the U.S. Census Bureau prepared them (Pierce 2015). The results presented in the previous section raise at least one major question about the IRS migration data after 2011-12, when the IRS took over the processing of these data from the U.S. Census Bureau: What is the reason for the apparently systemic problem with these data?
As our results suggest, this problem seems to be an internal one within the IRS. As we noted earlier, the IRS provides documentation detailing three major changes that it made to how it prepares these data relative to how the U.S. Census Bureau prepared them (Pierce 2015). These changes include: (1) the inclusion of additional tax returns through the end of the calendar year, (2) the use of additional TINs to increase the match rates of tax returns in consecutive years, and (3) other internal IRS processes and procedures (e.g., [changes to] the processes and procedures used to combat identify theft and exclude potentially fraudulent tax returns). However, without more information and transparency from the IRS about their internal processes and procedures, it is not clear exactly why or how any or all of these reasons would result in such highly volatile patterns of out- and in-migration. Consequently, researchers are forced to guess, as we did at the end of the previous section, the reason(s) for the apparently systemic problem with the IRS migration data and, in the absence of resolving this problem, to either use these data as is or develop their own ad-hoc adjustments (Golding and Winkler 2020; Hauer 2017; Johnson et al. 2017; Winkler and Rouleau 2020), neither of which is a satisfactory option.
We think it important to raise this question publicly because the IRS migration data are routinely used in both scholarly and applied settings with the strong potential to affect individuals, groups and organizations, and communities in concrete ways (Toukabri 2017; U.S. Census Bureau 2020). Given the discontinuation of the census long form and the weaknesses of other publicly available sources of U.S. migration data (DeWaard et al. 2019), compromised IRS migration data would also put the United States at a comparative disadvantage relative to other developed countries, which have much better data on internal migration. With so much on the line, until more is known about the reasons for this apparently systemic problem, we conclude that the post 2011-12 IRS migration data not be used until this problem is resolved, and we encourage the IRS to do so quickly, transparently, and collaboratively.
Acknowledgements
This work is part of the projects, “Extreme Weather Disasters, Economic Losses via Migration, and Widening Spatial Inequality” and “Demographic Responses to Natural Resource Changes,” funded by the National Science Foundation (Award #1850871) and the Eunice Kennedy Shriver National Institute of Child Health and Human Development at the National Institutes of Health (Award 5R03HD095014-02), respectively. This work is also supported by center grant #P2C HD041023 awarded to the Minnesota Population Center at the University of Minnesota, center grant # P2C HD041020 awarded to the Population Studies and Training Center at Brown University, and center grant # P2C HD047873 awarded to the Center for Demography and Ecology at the University of Wisconsin-Madison by the Eunice Kennedy Shriver National Institute of Child Health and Human Development at the National Institutes of Health. The authors wish to thank the Editor, two anonymous reviewers, and Michael Mazerov for their helpful comments and suggestions.
Footnotes
On the IRS migration data website (see Footnote 1), data files are named and organized by consecutive years (e.g., 2011-2012). We adopt this convention in this Research Brief.
See the IRS migration data user guides (e.g., https://www.irs.gov/pub/irs-soi/1718inpublicmigdoc.pdf).
Differences for each period p are calculated as: .
References
- Ambinakudige S & Parisi D (2017). A spatiotemporal analysis of inter-county migration patterns in the United States. Applied Spatial Analysis and Policy, 10, 121–137. [Google Scholar]
- CEMHS. (2019). Spatial Hazard Events and Losses Database for the United States, Version 18.0. Phoenix, AZ: Center for Emergency Management and Homeland Security, Arizona State University. [Google Scholar]
- Coomes PA & Hoyt WH (2008). Income taxes and the destination of movers to multistate MSAs. Journal of Urban Economics, 63, 920–937. [Google Scholar]
- Curtis KJ, DeWaard J, Fussell E, & Rosenfeld RA (2020). Differential recovery migration across the rural-urban gradient: Minimal and short-term population gains for rural disaster-affected Gulf Coast counties. Rural Sociology, 85, 856–898. [DOI] [PMC free article] [PubMed] [Google Scholar]
- Curtis KJ, Fussell E, & DeWaard J (2015). Recovery migration after Hurricanes Katrina and Rita: Spatial concentration and intensification in the migration system. Demography, 52, 1269–1293 [DOI] [PMC free article] [PubMed] [Google Scholar]
- DeWaard J, Curtis KJ, & Fussell E (2016). Population recovery in New Orleans after Hurricane Katrina: Exploring the potential role of stage migration in migration systems. Population and Environment, 37, 449–463. [DOI] [PMC free article] [PubMed] [Google Scholar]
- DeWaard J, Fussell E, Curtis KJ, & Ha JT (2020). Changing spatial interconnectivity during the “Great American Migration Slowdown”: A decomposition of intercounty migration rates, 1990-2010. Population, Space and Place, 26, e2274. [DOI] [PMC free article] [PubMed] [Google Scholar]
- DeWaard J, Johnson JE, & Whitaker SD (2019). Internal migration in the United States: A comprehensive comparative assessment of the Consumer Credit Panel. Demographic Research, 41, 953–1006. [DOI] [PMC free article] [PubMed] [Google Scholar]
- Engels RA & Healy MK (1981). Measuring interstate migration flows: An origin-destination network based on Internal Revenue Service records. Environmental Planning A, 13, 1345–1360. [PubMed] [Google Scholar]
- Frey WH (2009). The Great American Migration Slowdown: Regional and Metro Dimensions. Washington D.C.: The Brookings Institution. [Google Scholar]
- Fussell E, Curtis KJ, & DeWaard J (2014). Recovery migration to the City of New Orleans after Hurricane Katrina: A migration systems approach. Population and Environment, 35, 305–322. [DOI] [PMC free article] [PubMed] [Google Scholar]
- Golding SA & Winkler RL (2020). Tracking urbanization and exurbs: Migration across the rural-urban continuum, 1990-2016. Population Research and Policy Review, [DOI] [PMC free article] [PubMed] [Google Scholar]
- Gross E (2005). Internal Revenue Service Area-to-Area Migration Data: Strengths, Limitations, and Current Trends. Washington D.C: Statistics of Income Division, Internal Revenue Service. [Google Scholar]
- Hauer M (2017). Migration induced sea-level rise could reshape the U.S. population landscape. Nature Climate Change, 7, 321–325. [Google Scholar]
- Hauer M & Byars J (2019). IRS county-to-county migration data, 1990-2010. Demographic Research, 40, 1153–1166. [Google Scholar]
- Hauer M, Holloway SR, & Oda T (2019). Evacuees and migrants exhibit different migration systems after the Great East Japan Earthquake and Tsunami. Unpublished manuscript. [DOI] [PubMed] [Google Scholar]
- Henrie CJ & Plane DA (2007). Exodus from the California core: Using demographic effectiveness and migration impact measures to examine population redistribution within the western United States. Population Research and Policy Review, 27, 43–64. [Google Scholar]
- Isserman AM, Plane DA, & McMillen DB (1982). Internal migration in the United States: An evaluation of federal data. Review of Public Data Use, 10, 285–311. [Google Scholar]
- Johnson KM, Curtis KJ, & Egan-Robertson D (2017). Frozen in place: Net-migration in sug-national areas of the United States in the era of the Great Recession. Population and Development Review, 43, 599–623. [DOI] [PMC free article] [PubMed] [Google Scholar]
- Manson S, Schroeder J, Van Riper D, Kugler T, & Ruggles S (2020). IPUMS National Historical Geographic Information System: Version 15.0. [dataset]. Minneapolis, MN. [Google Scholar]
- McHugh KE & Gober P (1992). Short-term dynamices of the U.S. interstate migration system: 1980-1988. Growth and Change, 23, 428–445. [DOI] [PubMed] [Google Scholar]
- Molloy R, Smith CL, & Wozniak A (2011). Internal migration in the United States. Journal of Economic Perspectives, 25, 173–196. [Google Scholar]
- Pierce K (2015). SOI Migration Data, A New Approach: Methodological Improvements for SOIC’s United States Population Migration Data, Calendar Years 2011-2012. Washington D.C: Statistics of Income Division, Internal Revenue Service. [Google Scholar]
- Plane DA (1987). The geographic components of change in a migration system. Geographical Analysis, 19, 283–299. [Google Scholar]
- Plane DA, Henrie CJ, Perry MJ (2005). Migration up and down the urban hierarchy and across the life course. Proceedings of the National Academy of Sciences of the United States of America, 43, 15313–15318. [DOI] [PMC free article] [PubMed] [Google Scholar]
- Shumway JM & Otterstrom S (2010). U.S. regional income change and migration: 1995-2004. Population, Space and Place, 16, 483–497. [Google Scholar]
- Shumway JM & Otterstrom S (2015). Income migration and income convergence across U.S. states, 1995-2010. Growth and Change, 46, 593–610. [Google Scholar]
- Shumway JM Otterstrom S, & Glava S (2014). Environmental hazards as disamenities: Selective migration and income change in the United States from 2000-2010. Annals of the Association of American Geographers, 104, 280–291. [Google Scholar]
- Stone L (2016). What happened to migration 2015? IRS Statistics of Income edition. Medium. October 24. [Google Scholar]
- Strobl E (2011). The economic growth impacts of hurricanes: Evidence from U.S. coastal counties. The Review of Economics and Statistics, 93, 575–589. [Google Scholar]
- Toukabri A (2017). Net Migration and Population Estimates: A High Level Overview. Washington, D.C.: U.S. Census Bureau. [Google Scholar]
- U.S. Census Bureau. 2020. Methodology for the United States Population Estimates: Vintage 2019. Washington, D.C.: U.S. Census Bureau. [Google Scholar]
- Vias AC (2010). The influence of booms and busts in the U.S. economy on the interstate migration system. Growth and Change, 41, 115–135. [Google Scholar]
- Winkler RL & Rouleau MD (2020). Amenities or disamenities? Estimating the impacts of extreme heat and wildfire on domestic US migration. Population and Environment. [Google Scholar]