Abstract
Quantitative evidence for the risk of zoonoses and the spread of antimicrobial resistance remains lacking. Here, as part of the UrbanZoo project, we sampled Escherichia coli from humans, livestock and peri-domestic wildlife in 99 households across Nairobi, Kenya, to investigate its distribution among host species in this rapidly developing urban landscape. We performed whole-genome sequencing of 1,338 E. coli isolates and found that the diversity and sharing patterns of E. coli were heavily structured by household and strongly shaped by host type. We also found evidence for inter-household and inter-host sharing and, importantly, between humans and animals, although this occurs much less frequently. Resistome similarity was differently distributed across host and household, consistent with being driven by shared exposure to antimicrobials. Our results indicate that a large, epidemiologically structured sampling framework combined with WGS is needed to uncover strain-sharing events among different host populations in complex environments and the major contributing pathways that could ultimately drive the emergence of zoonoses and the spread of antimicrobial resistance.
Subject terms: Infectious-disease epidemiology, Bacterial genomics
Phylogeography and phylogenomic analyses of E. coli isolates collected from humans and domesticated and wild animals across 99 households in Nairobi reveal strong intra-household, and lower but detectable inter-household and inter-host, strain-sharing patterns.
Main
The spread of bacterial pathogens and antimicrobial resistance (AMR) across human and animal populations presents a substantial and growing threat to global health and economic development. Identifying risk factors for emergence and spread is one of epidemiology’s most important challenges. Many recent pandemics and newly emergent infectious diseases have animal origins1,2 and are associated with rapidly urbanizing environments3,4. The dynamic interfaces among humans, domestic livestock and wild animals act as conduits by which humans can be exposed to zoonotic pathogens and AMR in an environment with inadequate sanitation infrastructure, limited access to appropriate and effective drugs and unregulated antimicrobial usage5–8.
The importance of livestock to the transmission of bacteria and AMR remains unclear9. The practice of keeping livestock, particularly in urban settings, has been described as a risk factor for the emergence and spread of zoonoses10,11. Antimicrobial agents used in human medicine are also used for growth promotion, disease prevention and disease treatment in livestock, enhancing selection pressures on bacterial pathogens for AMR emergence and spread.
Wild birds and mammals have also been documented to carry and exchange drug-resistant bacteria with livestock and humans6,12,13. The rapid expansion of urban environments into previously pristine or sparsely populated natural landscapes also increases the potential for greater contact among wildlife, humans and livestock, which can provide conduits for microbiome sharing14.
Fundamental to whole-genome sequencing (WGS) studies is the availability of systematically sampled bacterial isolates obtained from humans, livestock and wildlife across overlapping geographical regions and time frames, yet data are lacking15. In this study, we sampled the bacterium Escherichia coli from humans, livestock and peri-domestic wildlife in 99 households and their environs across 33 sublocations in Nairobi, Kenya, in an epidemiologically structured study. The rapid development of Nairobi’s urban landscape is similar to that of many other cities in the developing world, making it an ideal system in which to explore how people’s interactions and co-existence with animals influences pathogen transmission across species16,17.
This ‘99 households’ study was part of a broader study (‘Epidemiology, Ecology and Socio-Economics of Disease Emergence in Nairobi’, or ‘UrbanZoo’ for short) and focused on mechanisms for zoonotic pathogen emergence in urban environments. The broader study included mapping agriculture-sector value chains to understand the flow of animal source food products into the city of Nairobi18–26 as well as the aetiology of childhood diarrhoea in low-income settlements, studies quantifying antibiotic drug resistance carriage in multiple hosts6,12 and the roles of different hosts in disseminating clinically important resistance profiles27,28. It also included work to explicitly analyse the interplay among urbanization, food supply and pathogen risk29. The data presented here explore the phylogeography of bacterial isolates across an urban landscape.
As a common commensal and pathogen in vertebrates, as well as its ease of isolation and culture and its wealth of available genetic information, E. coli is an ideal exemplar bacterium to study the more general phenomenon of dispersal of pathogens across host populations. Here we report a genomic investigation of 1,338 E. coli isolates sourced from humans, livestock and wildlife across Nairobi to elucidate patterns of bacterial strain sharing as a proxy for transmission potential. We test the hypothesis that the distributions of bacterial strains and their genetic pools are limited to particular defined ecological niches (households and hosts) versus an alternative that they display a cosmopolitan distribution—in essence, recapitulating the famous tenet, “Everything is everywhere, but the environment selects”30. By considering both household and host factors, our study captures both neutral (dispersal limitation) and niche (environmental selection) processes in driving bacterial distribution31. Our study aims to identify risk factors to help inform surveillance strategies that target potential hotspots for strain sharing and AMR transmission among populations in an urban setting and, more broadly, to understand risks associated with transmission of multi-host pathogens in urban settings.
Results
E. coli in Nairobi are from both global and local lineages
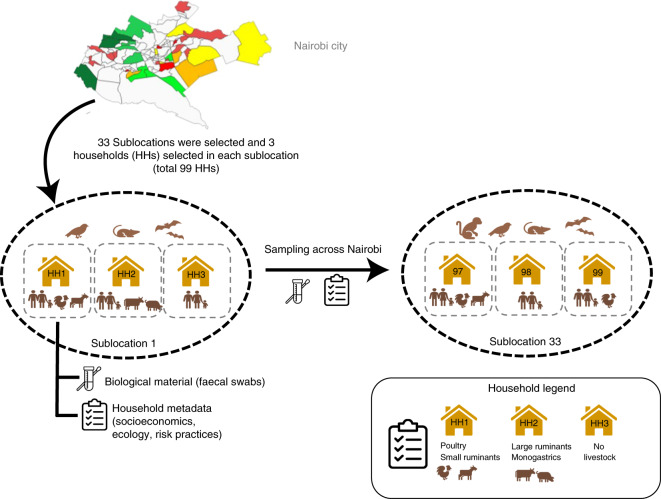
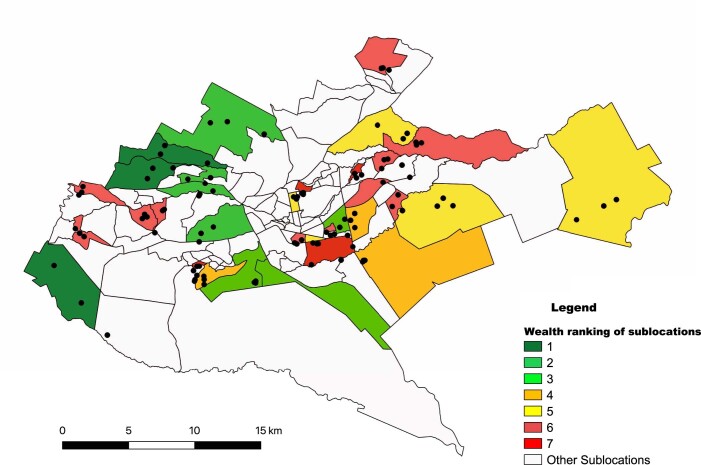
A total of 1,338 E. coli isolates were sequenced as part of this study (Supplementary Table 1). In total, 311 genomes were obtained from human isolates; 421 genomes were isolated from 63 wildlife species, primarily composed of wild birds (n = 245), rodents and bats (n = 130) isolates; and 606 genomes were obtained from 13 species of livestock that can be grouped into poultry (n = 324), goat and sheep (n = 109), cattle (n = 61), pig (n = 49) and rabbit (n = 38) isolates. The isolates were distributed across 99 households from 33 geographic sublocations, spanning the entire urban area of Nairobi, with each sublocation represented by 20–63 isolates (Fig. 1, Extended Data Fig. 1 and Supplementary Methods).
Fig. 1. Flow diagram of the household selection procedure.
Different colours given to the sublocations on the Nairobi city map represent different wealth categories (dark green, wealthy; dark red, poor).
Extended Data Fig. 1. Geographical distribution of selected sublocations within the city of Nairobi chosen based on a socio-economic stratification, together with locations of each of 99 households selected within each stratum.
Different colours given to the sublocations represent different wealth categories (Dark green – wealthy, dark red – poor).
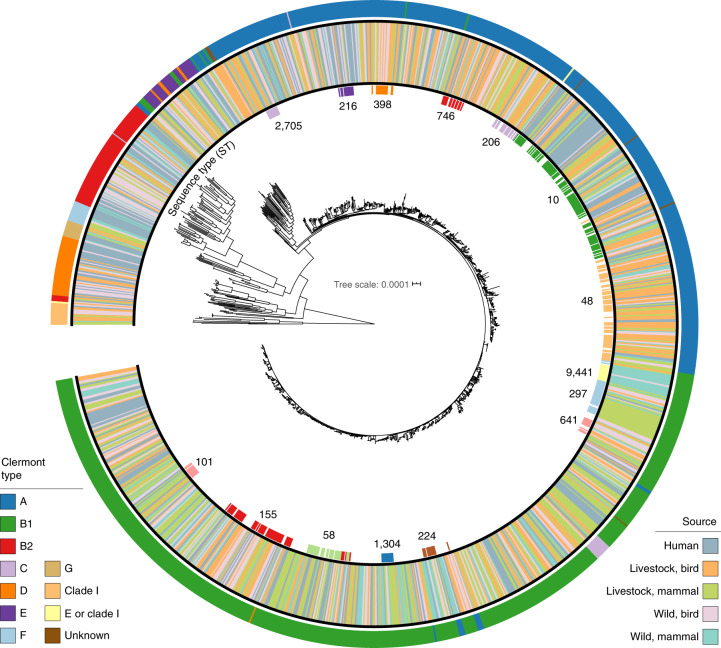
The genomes represent all major lineages of the E. coli sensu stricto phylogroup in addition to members of the cryptic clade I. The isolates belong to Clermont phylogroups B1 (45%), A (38%), B2 (6%), D (4%) and E (2%) and, to a lesser extent, clades C, F and G and clade I (<1%). Phylogroup A was strongly associated with humans (41% of human isolates) compared with the other host categories. In the livestock mammal, wild bird and wild mammal categories, genomes from phylogroup B1 were the most frequently isolated.
A total of 537 sequence types (STs), based on the seven-gene Achtman scheme, were represented, with the three most common being ST10 (n = 93, 7%), ST48 (n = 64, 5%) and ST155 (n = 54, 4%) (Supplementary Table 2). One hundred and thirty-nine STs, representing 14% (184/1,338) of isolates, have been found only in African countries (Kenya, Madagascar, South Africa and Uganda), based on the genomes that were present in Enterobase at the time this study was carried out. One hundred and thirty-three of the Africa-specific STs in this collection, representing 13% (173/1,338) of the isolates, were unique to Kenya. Most of these novel and unique STs were isolated from livestock (52%, 96/184) and wildlife (34%, 63/184). A core-genome alignment comprising 80,722 nucleotide positions conserved across all 1,338 isolates was used to infer the overall phylogenetic relationship among isolates (Fig. 2). Additionally, we did not find extensive associations of isolates with either host species or sublocation (Fig. 2 and Extended Data Fig. 2).
Fig. 2. Core genome phylogeny of 1,338 E. coli isolates.
Inner ring: STs (only STs with a minimum of ten isolates are shown); middle ring: source type of isolate; outer ring: Clermont phylotype classifications. The tree is rooted on the clade I group.
Clonal strain sharing of E. coli
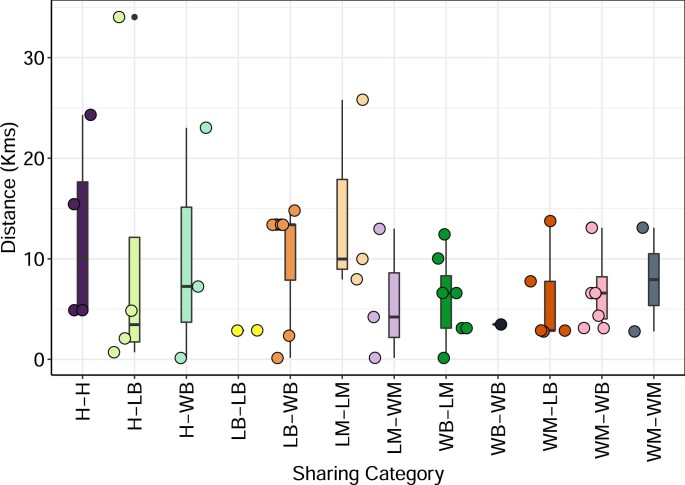
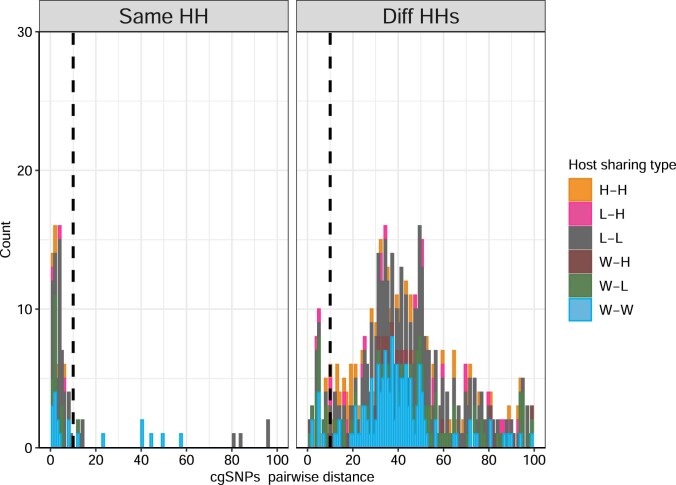
Transmission of bacteria, either directly or indirectly via a common source, can be inferred by the presence of very closely related genomes in two individuals, which we refer to as clonal strain sharing. To identify clonal strain sharing, we used core-genome, multi-locus sequence typing (cgMLST), which is a measure of genetic relatedness that is reproducible and scalable across larger and more diverse datasets32. We first plotted the frequency distribution of pairs of isolates differing by fewer than 100 cgMLST loci (Fig. 3). Here, we found a total of 150 pairs of isolates that differed by ten or fewer cgMLST alleles from other isolates in our collection. These pairs comprised 187 (14%) isolates, with some isolates involved in multiple pairs. Data on household and host type for these 150 pairs revealed that most occurred among hosts from the same household (n = 101, 67%) and 33% (n = 49) involved hosts from different households. Given the low genetic distances and epidemiological context, we refer to these pairs of ≤10 cgMLST loci as ‘sharing pairs’ to indicate evidence of recent strain sharing either by direct transmission or acquisition from a common source (Extended Data Fig. 3). We found no significant correlation between host type sharing and inter-household geographical distance (χ2 = 8.83, P = 0.64, Kruskal–Wallis) (Extended Data Fig. 4).
Fig. 3. Frequency distribution of pairwise distances among isolates from the same household and from different households.
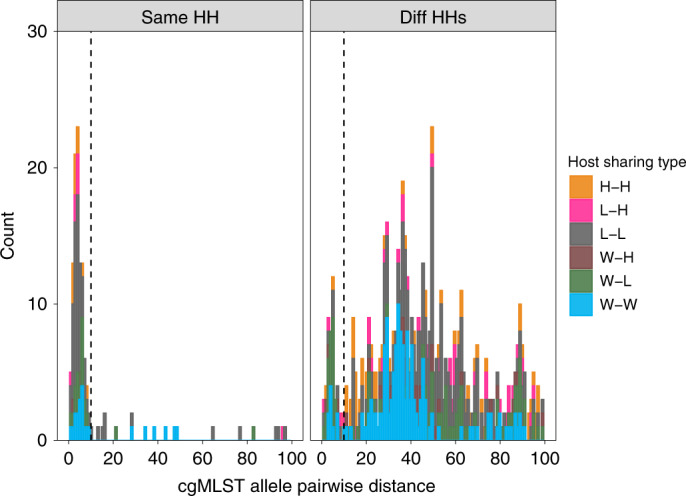
cgMLST allele pairwise distances among isolates from the same household (HH; left) and from different (Diff) HHs (right). The sources of isolates in each pair are indicated by the colour. Only pairs that are closer than 100 cgMLST loci apart are shown. The vertical dashed black line indicates the sharing threshold (10 cgMLST alleles). H, human; L, livestock; W, wildlife.
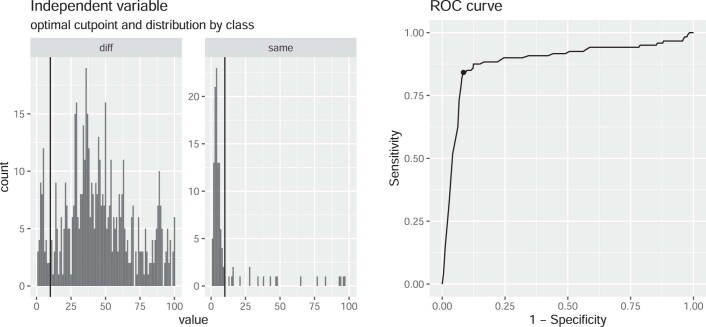
Extended Data Fig. 3. Output of cutpointR, used to identify the optimal threshold to maximise the differentiation between sharing pairs occurring within households (same) and between households (diff) at 10 cgMLST loci.
The black vertical lines on the 2 panels on the left indicate the optimal_cutpoint value of 10 as calculated by cutpointR.
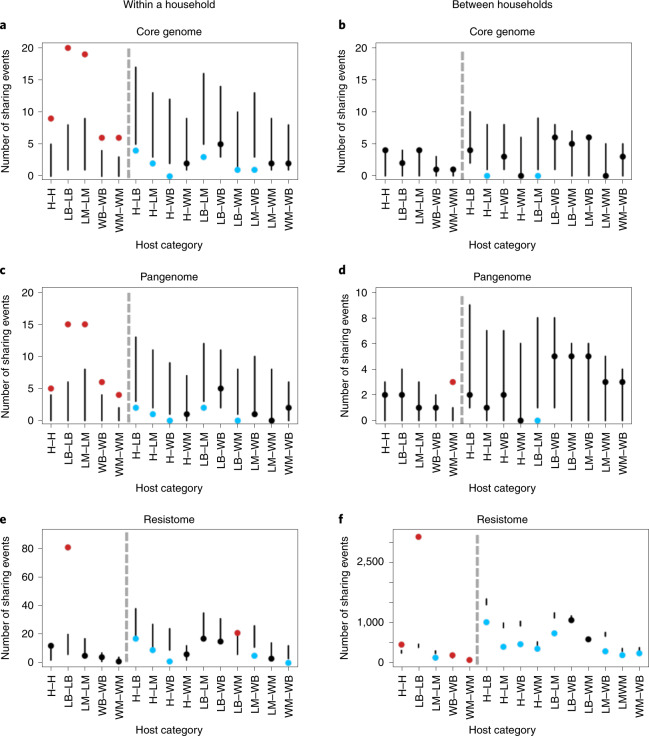
Fig. 4. Number of sharing pairs for core genomes, pangenomes and resistomes within and between households.
a,c,e, Number of within-household sharing pairs across 15 host category types for core genomes (a) (n = 121), pangenomes (c) (n = 94) and resistomes (e) (n = 9,502). b,d,f, Number of between-household sharing pairs across 15 host category types for core genomes (b) (n = 121), pangenomes (d) (n = 94) and resistomes (f) (n = 9,502). Panels show the 95% confidence intervals (vertical lines) of the calculated expected distribution using a resampling approach. Points depict the observed number of sharing pairs in each category coloured according to whether they fall above (red), below (blue) or within (black) the expected distribution. Hosts in the same category (for example, H–H) and different categories (for example, H–LB) are separated by grey dashed lines. Source type of isolate pairs is indicated on the x axis with human (H), livestock birds (LB), livestock mammals (LM), wildlife birds (WB) and wildlife mammals (WM). In each plot, within-category connections are on the left of the grey dotted line and between-category connections are on the right.
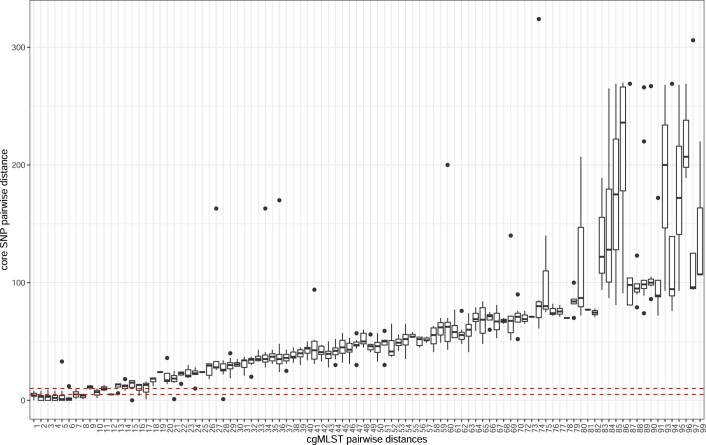
Pairwise core-genome, single-nucleotide polymorphisms (cgSNPs) of these sharing pairs were also investigated to validate the genetic distance as measured by cgMLST. The distribution of closely related pairs (<100 cgSNPs) also showed a similar pattern, with 159 pairs separated by fewer than ten cgSNPs (Extended Data Fig. 5). Both cgMLST and cgSNPs measures captured very closely related pairs of isolates, with 73% of the sharing pairs (n = 109) separated by four or fewer cgSNPs and 97% (n = 145) by a maximum of ten cgSNPs (Extended Data Fig. 6). Only one pair had more than 13 cgSNPs. WGS studies of E. coli outbreaks in humans have shown that epidemiologically linked isolates usually differ by up to four cgSNPs when isolated within 30 days of each other and, when separated by 5–10 core cgSNPs, this time frame increases to an average of 8 months33. Therefore, the genetic diversity of isolates within the same household agrees with examples of epidemiologically linked E. coli in other settings, and we estimate that length of evolutionary time separating two isolates from within the same household is within the range of several months to several years.
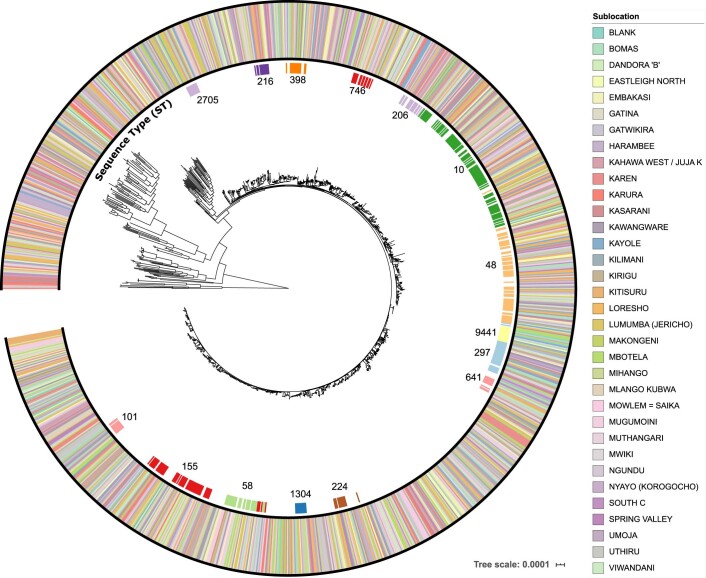
Extended Data Fig. 2. Maximum-Likelihood tree of a core genome alignment showing the distribution of isolates across 33 sublocations in Nairobi.
The outermost ring is colored according to the sublocation of sample origin and innermost ring represents the commonly predicted sequence types (ST) in our isolate collection.
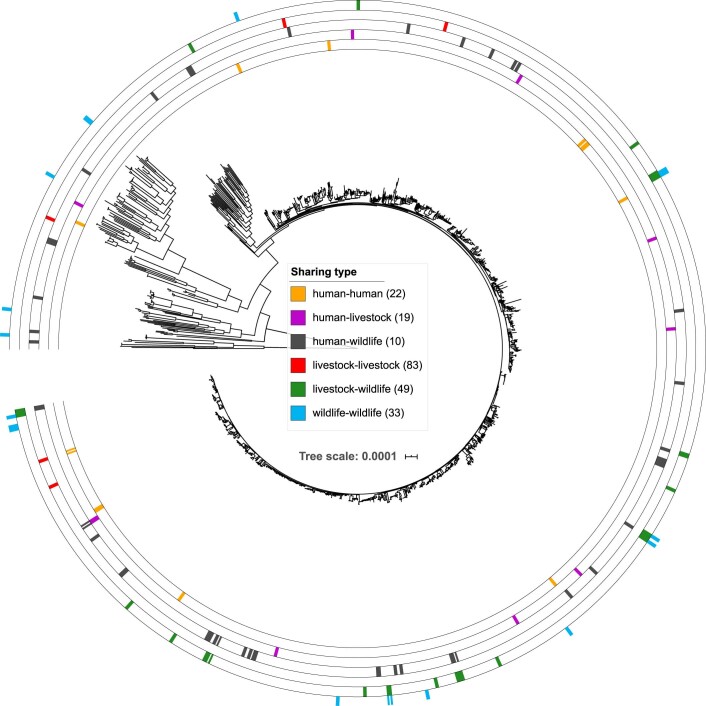
Sixty-five percent (n = 97) of the pairs were between isolates from the same host category (57 (38%) within livestock, 26 (17%) within wildlife and 14 (9%) within humans), and the remaining 36% (n = 53) were found between host categories (38 (25%) between wildlife and livestock (W–L), ten (6%) between human and livestock (H–L) and five (3%) between human and wildlife (H–W)). Further details on the breakdown of these sharing pairs are provided in Supplementary Table 1. No correlation was evident between sharing pairs and particular E. coli lineages, as sharing pairs were distributed across the phylogeny for all six (H–H, L–H, L–L, W–H, W–L and W–W) categories of sharing (Extended Data Fig. 7). However, in seven cases, wildlife isolates that were implicated in sharing pairs were found in the same cluster as isolates involved in sharing pairs with other host categories (Extended Data Fig. 7).
Extended Data Fig. 4. Plot of geographical distance of bacterial sharing in pairs involving different households (n = 49).
Abbreviations: H- Human, LB – Livestock Bird, WB – Wild Birds, LM – Livestock mammals, LB – Livestock Birds. Boxplot centre lines show median value; upper and lower bounds show the 25th and 75th quantile, respectively; upper and lower whiskers show the largest and smallest values within 1.5 times the interquartile range above the 75th percentile and below the 25th percentile, respectively; and points show data points (jittered to improve visualisation).
E. coli strain sharing between humans and livestock
We identified ten sharing pairs involving human and livestock isolates belonging to STs that were not host restricted and have been associated with a variety of sources and host species (Table 1).
Table 1.
Details of humans involved in bacterial sharing with livestock (≤10 cgMLST loci)
| Sharing pair | Livestock host | cgMLST distance | ST | Household | Livestock-keeping status | Human–livestock-handling status | Gender |
|---|---|---|---|---|---|---|---|
| 1 | Chicken | 1 | 10 | Different | Yes | Yes | Male |
| 2 | Goose | 1 | 538 | Same | Yes | Yes | Male |
| 3 | Chicken | 3 | 23 | Different | No | – | Male |
| 4 | Cattle | 3 | 6,178 | Same | Yes | Yes | Male |
| 5 | Duck | 3 | 58 | Same | Yes | Yes | Male |
| 6 | Rabbit | 4 | 9,454 | Same | Yes | Yes | Male |
| 7 | Turkey | 4 | 9,454 | Same | Yes | Yes | Male |
| 8 | Chicken | 4 | 206 | Same | Yes | – | Male |
| 9 | Turkey | 8 | 1,237 | Different | Yes | – | Male |
| 10 | Chicken | 10 | 48 | Different | No | None | Male |
–, Information not collected
All sharing pairs involved human males (P = 0.003, Fisher’s exact test). Six of the ten sharing pairs involved humans and livestock in the same household, whereas four humans (not keeping livestock) shared bacteria with livestock from other households. The ten sharing events between humans and livestock did not always occur in a livestock-keeping household. Six of seven persons (we lacked data for three people) had direct contact with livestock through collecting eggs, slaughter, milking or handling, but one person had no history of livestock contact (Table 1).
Sharing is shaped by host and households
Household and host category strongly influenced the distribution of sharing of E. coli isolates in both the core genome and the pangenome in Nairobi (Fig. 4a–d). Within households, sharing of E. coli isolates was consistently higher than expected within the same host category (Fig. 4a,c). No strong pattern was observed among households where the observed shared E. coli isolates fell largely within the expected range (Fig. 4b,d). Resistome similarity was predominantly low among different hosts but high among poultry isolates, irrespective of household structure (Fig. 4e,f). Sharing among poultry (livestock birds (LB)) in the same household was particularly high across all three definitions of sharing and similarity—that is, the core, pangenome and resistome (LB–LB in Fig. 4).
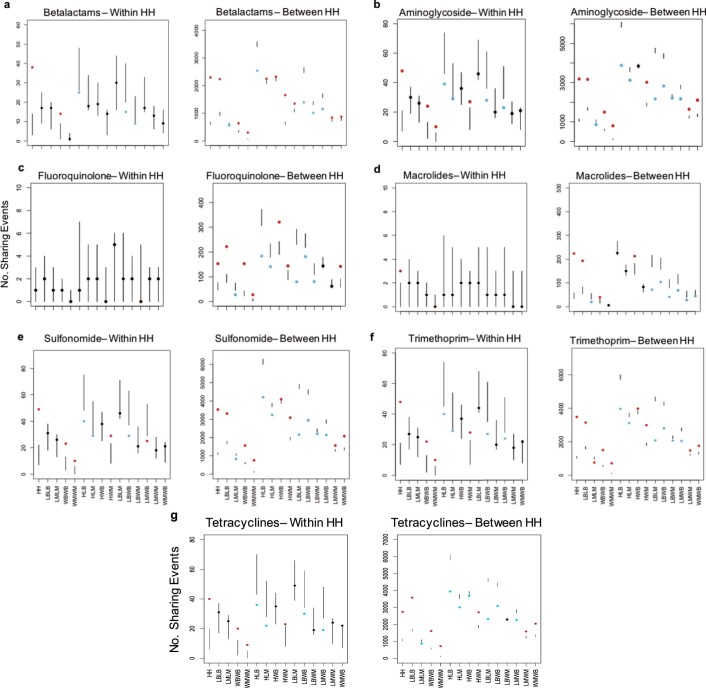
To further investigate resistome similarity between hosts, we performed the same analysis with sharing classed as two isolates sharing resistance genes that confer drug resistance to a given class of antibiotics. We compared eight classes of antibiotic whose resistance genes were found in the population (Extended Data Fig. 8) and found that, between households, poultry–poultry sharing continued to be much greater than the expected range (Extended Data Fig. 8). Resistome similarity among poultry does not, therefore, appear to be driven by resistance to a single or few antibiotic classes. H–H sharing between households was also higher than expected, suggesting similar antibiotic selection pressures on human isolates across the board.
Extended Data Fig. 5. The distribution of closely related isolates (separated by 100 cgSNPS, n = 660) based on core genome SNPs (cgSNPs).
An alignment of 399,673 aligned nucleotide positions were used. Each of these core SNP positions were conserved in at least 99.8% of isolates (1335/1338). The vertical dashed black line indicates the sharing threshold (10 cgSNPs).
Discussion
Our population genomic analysis, explicitly embedded within an epidemiologically structured sampling framework, provides a comprehensive overview of the genomic landscape of E. coli in humans, livestock and peri-domestic wildlife in a rapidly developing city. Our findings have implications for understanding the baseline level of bacterial diversity in settings where there is a potential for interaction between humans and animals. Our results reveal strain sharing occurring within households and a lower but detectable level of connectivity among human and animal populations across the urban environment beyond the household.
Isolates from Africa make up less than 3% (n = 3,626) of the publicly available E. coli genome sequences in the public genome database, Enterobase. Our study provides a substantial contribution to the record of E. coli diversity in this part of the world with the identification of 133 unique and novel STs, in addition to a detailed footprint at a city-wide scale. Previous work on the population structure of E. coli isolated from human, livestock and wildlife in other both rural and urban settings showed varying degrees of overlap in the genotypes among these populations, driven by frequent contact and close proximity13,14,34. The wide range of genotyping methods used in these studies, each with varying levels of resolution, makes it difficult to make direct comparisons between studies. Earlier genotyping methods have lower resolution and are less robust35. Other studies measure similarity in microbiome community composition but are less reliable at resolving strain differences between samples36. Our approach combines high-resolution WGS with a structured sampling design, which captures more accurately the extent of strain sharing in this location.
In our study, we found that household stratification drives clonal strain sharing. Previous studies have shown an important role of the household as a driver for sharing similar microbiomes or bacteria in humans and companion animals37–41. Our findings show that strain sharing can involve humans, livestock and wildlife found in the same household or area.
The use of isolates collected within a time frame of 14 months in this study increased our ability of finding clonal isolates that overlap among hosts, households and sublocations. Previous work using whole genomes found either no overlap or isolates that were separated by more than ten cgSNPs, which does not provide strong evidence for a recent sharing event42,43. Although challenging in practice, we have demonstrated the importance of large-scale structured sampling to understand strain sharing at the population level.
Genotype similarity of the core and accessory genome within households is posited to be driven by direct and social contact among individual hosts44,45. Consistent with expectation, host type was also shown to be a strong driver in E. coli isolate sharing within households (Fig. 4). Members of the same host category, particularly in the same household, are more likely to have direct and/or indirect contact within shared environments, creating increased opportunity for bacterial sharing14,36,37,44–46.
Eight of the ten H–L strain-sharing events that we identified involved various poultry species. Inhalation and ingestion of faecal dust from poultry has previously been identified as a significant risk in the spread of bacteria from one host to another, both within the poultry populations and with humans working in close contact with them47. Furthermore, closely related ST131 strains have been previously found in both human and poultry E. coli populations, and genetic factors responsible for causing infections in chickens are also found in human pathogenic isolates48–51. Humans in direct contact with livestock were more prone to sharing E. coli isolates, probably through direct contact with livestock products and/or faecal matter. Although the sample size of such sharing events within our large overall sample is small, this result is consistent with previous work postulating direct contact as a risk for bacterial sharing39,52. The results also serve to highlight that detecting connections or common sources among pathogens in spatially distributed hosts in large, complex environments requires carefully structured sampling designs that account for the considerable heterogeneity in natural systems53. We note that the strong host-type signal for E. coli sharing within a household (Fig. 4a) does not hold true when examining pairs between households (Fig. 4b). This could be due to a higher diversity of E. coli in the wider population, leading to a lower probability of detecting closely related strains.
Our resistome similarity analysis also suggests disproportionately higher rates of resistome similarity among poultry, irrespective of the household, compared with the other host groups. As poultry isolates are phylogenetically diverse, the presence of a common selection pressure could explain this observation. Across Nairobi, poultry are routinely exposed to a set regimen of antimicrobial agents (for therapeutic or prophylactic purposes), and such recipes vary minimally geographically from one location to another54. Conversely, a wider range of combinations of antimicrobials is available for use in ruminants and monogastrics, including an array of injectable formulations, and these greatly vary from one farm to another. We also find resistome similarity to be higher than expected among human and wildlife isolates, both mammals and birds. The similar availability and usage patterns of antibiotics in the human population across the city could explain the similarity seen in humans, suggesting that resistome similarity occurs from prevailing selective pressures rather than spread from a common source. The presence of manure, rubbish and human waste—all contaminated with potentially similar kinds of AMR pathogens and antimicrobials—across the urban landscape of Nairobi provides a conduit for acquisition and/or selection of similar resistomes in wildlife, which act as a sink population for AMR12.
We observed a higher-than-expected level of accessory genome sharing among wild mammals (bats and rodents) and among households, apparently involving divergent lineages, as we did not see the same pattern at the core-genome level. Other types of wildlife (for example, wild birds) around the world have been shown to carry and transmit E. coli and should be considered a public health risk55–57. Our findings suggest that the role of rodents and bats should also be considered.
Our study design focuses on the breadth of sampling over depth, and, as a single isolate is sampled from each host, our approach does not account for intra-host diversity. Previous studies on the intra-host diversity of E. coli strains found them to be variable across host populations, and taking single isolates has the potential to underestimate the number of potential strain-sharing events58. However, our study using single isolates already reveals sharing events between human and animal hosts, and the scale of sharing can only be higher with incremental samples per host. Future studies should, therefore, consider both inter-host and intra-host diversity to expand on our findings.
Conclusions
Employing an epidemiologically structured sampling framework and using highly discriminatory WGS, our study provides detailed insight into the strain diversity of E. coli across a fast-growing African city where livestock-keeping within households is commonplace. To our knowledge, this is one of the largest and most comprehensive surveys of the bacterial genomic landscape in an urban environment so far, and it serves as a model for epidemiologically structured, targeted sampling and WGS of human and animal-borne bacteria. We found evidence of recent clonal sharing between humans and livestock, and we show that the E. coli population structure in humans, livestock and wildlife in this environment is shaped by both household and host type. These findings indicate that household bacterial distribution is predominantly, although not exclusively, driven by dispersal limitation, whereas, within the household, the host niche is the strongest driver for bacterial sharing (and their genetic pools) distribution. We also found similarities in the resistome of the isolates that did not match the patterns of shared genomes and presumably reflects common antibiotic usage practices, particularly in poultry. This provides the strongest evidence in our study for direct selection acting on bacteria within a host (shared antibiotic environment). These findings provide empirical support for the hypothesis that ‘Everything is everywhere’ (frequent sharing of bacteria and AMR genes between households) but ‘environment selects’ (different households and hosts have different bacterial and resistome persistence). From a disease-control-policy perspective, our study highlights the need to undertake surveillance for emerging pathogens at the appropriate spatial scale (here, households) and to account for patterns of interconnectivity where epidemiological links might be created by livestock, wildlife or humans themselves. Further work, guided by the finding of where clonal sharing is most likely to be found, will be required to quantify spillover risk associated with the main routes of inter-host transmission.
Methods
Study site
A cross-sectional study targeting synanthropic wildlife and sympatric human and livestock populations in Nairobi, Kenya, was carried out from August 2015 to October 2016 as part of the UrbanZoo project. Faecal samples (n = 2,081) from 75 wildlife species (birds and mammals, n = 794), 13 livestock species (n = 677) and humans (n = 333) were collected from households across Nairobi that were participating in the UrbanZoo 99 households project. Our study design is described in detail in the Supplementary Methods. In brief, Nairobi was split into administrative units, and 33 were chosen based on a socioeconomic stratification, which was weighted by population, such that the larger proportion of low-income households was oversampled while ensuring representation of all other socioeconomic groups. Three households were randomly selected in each sublocation to obtain two livestock-keeping and one non-livestock-keeping household (a total of 99 households), with the aim of maximizing the spatial distribution and diversity of livestock-keeping practices captured within the sampling frame (Fig. 1 and Extended Data Fig. 1). Households in each sublocation had to meet strict inclusion criteria of keeping small mammals (rabbits) or poultry, large mammals (cattle, goats and sheep) or pigs or no livestock within the household perimeter. Wildlife samples were obtained by a range of taxon-specific trapping methods, which are described in the Supplementary Methods.
Sample collection and microbiological testing
Questionnaires detailing household composition and socioeconomic data, as well as livestock ownership and management, were administered at each household using Open Data Kit Collect version 1.4.10 software59. Human, animal and wildlife faecal samples were collected and transported on ice to one of two laboratories (University of Nairobi or Kenya Medical Research Institute) within 5 h of collection. Samples were enriched in buffered peptone water for 24 h and thereafter plated onto eosin methylene blue agar (EMBA) and incubated for 24 h at 37 °C. Subsequently, five colonies were selected and subcultured on EMBA before being further subcultured on Müller–Hinton agar. A single colony was picked at random from the plate for each original sample (hereafter referred to as an ‘isolate’), and a 10-parameter biochemical test was used (triple sugar iron agar = 4, Simmon’s citrate agar = 1, and motility-indole-lysine media = 3, urease production from urea media = 1, oxidase from tetra-methyl-p-phenylenediamine dihydrochloride = 1) for identification of E coli.
WGS
DNA was extracted from bacterial isolates using commercial kits (Purelink Genomic DNA Mini Kit, Invitrogen, Life Technologies) at the International Livestock Research Institute in Nairobi, Kenya, and transported under licence to the Wellcome Trust Centre for Human Genetics. WGS was carried out at the Wellcome Trust Centre for Human Genetics on the Illumina HiSeq 2500 platform.
Sequence analysis
Sequenced reads were filtered for quality and trimmed for adaptors with BBDuk (version 38.46), using k = 19, mink = 11, hdist = 1, ktrim = r, minoverlap =12, qtrim = rl and trimq = 15. The following sequencing quality thresholds were used based on Quast: (1) at least 3 Mb aligned to EC958; (2) a maximum assembly length of 6.5 Mb; (3) GC content of between 50% and 51%; and (4) assembly N50 of >30 kb or a maximum of 100 cgMLST missing loci. In total, 1,642 genomes were sequenced that passed this quality threshold.
Genomes were assembled using Spades version 3.13.0 with the ‘–careful’ option. Clermont phylotype of the isolates was determined using the ClermonTyping tool version 1.4.160, and the multi-locus sequence type was determined and assigned by Enterobase61.
The pangenome was estimated using Roary version 3.12.0 with the following options: -s -i 95 -g 100000. Acquired antibiotic resistance genes were identified from the assemblies using starAMR (version 0.4.0) (https://github.com/phac-nml/staramr), with a cutoff of 95% sequence identity and a minimum of 60% alignment to the query sequence, against the ResFinder database downloaded on 25 September 201962. Antibiotic class of each resistant gene was assigned using the ResFinder classification.
Phylogenetic analyses
A core genome alignment was generated using Snippy version 4.6.0 (with default settings) using EC958 as a reference genome (GCA_000285655.3). A phylogenetic analysis of the core genome alignment was performed using IQTREE (version 1.6.12) -m TVM + G4 -bb 1000 -safe. The tree and metadata were visualized in iToL version 4.3 (itol.embl.de). Owing to the large number of isolates and the high level of diversity, we did not mask recombinant regions of the genome.
Ad hoc cgMLST was performed on genome assemblies using chewBBACA (v. 2.0.11) with the 2,513 gene cgMLST profile from Enterobase (downloaded October 2018).
Identification of putative bacterial sharing
A genetic distance matrix was calculated from all pairwise-allelic-profile comparisons using the library ‘ape’ in R (ref. 63). The cgMLST cutoff of 11 alleles to define putative E. coli (defined here as a sharing pair) transmission clusters was based on the observed bimodal distributions of inter-household and intra-household allele differences (Extended Data Fig. 3). The R package ‘cutpointR’ was used to validate this cutoff as the optimal value to differentiate pairs that occur within and between households64. Pairwise cgSNPs were also calculated using the full consensus genome alignment generated by Snippy version 4.6.0 (snippy-core), followed by custom filtering positions that were fully called and unambiguous with an A, G, C or T that were conserved in at least 99.8% (1,335 of 1,338) of isolates (length = 399,673 nucleotides). Pairwise distances were calculated using Disty McMatrixface version 0.1.0 (https://github.com/c2-d2/disty) with -n 0.002.
Epidemiological analysis of sharing
We established epidemiological links between every possible pair of E. coli isolates through a systematic comparison. Household-level sharing was categorized as within-household if a sharing pair involved isolates/hosts from the same household and between-household if a sharing pair involved isolates from a different household. Wildlife isolates that could not be attributed to a specific household were omitted from the sharing analysis (Supplementary Table 2).
We condensed our host types into five broad categories (Supplementary Tables 1 and 2): (1) humans; (2) livestock birds, poultry dominated by chickens; (3) livestock mammals, consisting of ruminants and monogastric livestock, (4) wild birds, predominantly seed-eating birds such as house sparrows; and (5) wild mammals, predominantly rodents, along with bats. Primates were omitted from the sharing analysis as they were associated with only two households, along with some samples derived from populations of bats and wild birds, which could be attributed to sublocation but not household.
Although the sharing threshold for the core genome was ≤10 cgMLST distance, sharing for the pangenome and resistome similarity was based on a Jaccard similarity index (JI) (between 0 and 1, where 1 is identical), where a cutoff threshold was defined, similar to the core genome. For the pangenome/accessory genome, this was determined to be JI ≤ 0.98 (Fig. 3c,d). Resistome sharing was defined as JI = 1 (Fig. 3e,f), with each isolate having a minimum of two AMR genes. In practice, this means that two isolates must share an identical set of AMR genes of length ≥2.
To calculate the number of observed sharing events, we identified clusters of isolates that were within the sharing threshold. So as to count an isolate as ‘shared’ only once for clusters >2, we applied a Hamiltonian path method65 such that the number of pairs/connections is counted as m − 1, where m is the number of isolates that form a cluster (Supplementary Fig. 9).
Having defined the number of observed sharing events among each of our host categories within and between households, we then wanted to know whether these observed events fell above or below what might be expected given the differential sampling effort across host categories. To do this, we first calculated the total number of possible pairs, assuming equal chance of sharing. Within households, this was calculated using the formula n(n−1)/2, where n is the number of samples of a given host type within a household. Between-household sharing was calculated as (n1) × (n2), where n1 is the number of samples of a given host in household 1, and n2 is the number of samples of a given host in household 2. These values were then calculated as a proportion of the total number of all possible pairwise combinations. We next performed a simulation to see how the observed sharing events were distributed, given the proportion of each pairwise host combination calculated in the previous step.
To do this, we resampled (using the rmultinom function) the total number of observed values for each type of sharing (resampling with replacement 1,000 times) from the calculated proportions. These resampled values were then used to generate the expected range of sharing events (± 95% confidence intervals) for each pairwise combination of host category. From this, we were able to assess whether our observed sharing events fell above, below or within the range that we might expect given the sampling effort. This pattern of sharing events among hosts and households enabled us to highlight cases where we observed sharing among hosts that lay outside from the predicted range. The same approach was applied to all aspects of genome sharing (Fig. 3a–f).
Ethical approval
The collection of data adhered to the legal requirements of the Government of Kenya. The International Livestock Research Institute (ILRI) Institutional Research Ethics Committee is registered and accredited by the National Commission for Science, Technology and Innovation in Kenya and is approved by the Federalwide Assurance for the Protection of Human Subjects in the United States. Ethical approval for human sampling and data collection was obtained from the ILRI Institutional Research Ethics Committee (ILRI-IREC2015/09). Livestock samples were obtained under the approval of the ILRI Institutional Animal Care and Use Committee (reference ILRI-IACUC2015/18), and permits were obtained from the Directorate of Veterinary Services. Wildlife were trapped under approval of an ILRI Institutional Animal Care and Use Protocol (IACUC2015/12), and permits were obtained from the National Museums of Kenya and Kenya Wildlife Service. Written informed consent was obtained from all adult participants and from the parents of underage participants.
Reporting Summary
Further information on research design is available in the Nature Research Reporting Summary linked to this article.
Supplementary information
Supplementary Methods.
Supplementary Table 1. Complete list of genomes and accession numbers generated in this study. Supplementary Table 2. Host categories and their constituents and sample numbers. Supplementary Table 3. Additional information on isolates involved in human–livestock sharing events.
Acknowledgements
We are grateful to the residents of our 99 sampling locations in Nairobi for taking part in the study. We thank B. van Bunnik for insightful discussions and help with statistical analysis; P. Alarcon, P. Dominguez-Salas, L. Madé, S. Ahmed and C. Pfeifer for assistance with questionnaire design; A. Kihara and J. Rogena for support with implementing the data collection tool and database design; and students on the Kenya Field Epidemiology and Laboratory Training Program (K-FELTP) for assistance with fieldwork. We thank the City of Nairobi authorities, the Department of Veterinary Services and the Department of Health Services for their cooperation in this study. This study was supported by the UK Medical Research Council, Biotechnology and Biological Science Research Council (UK), the Economic and Social Research Council (UK) and the Natural Environment Research Council (UK), through the Environmental & Social Ecology of Human Infectious Diseases Initiative (ESEI), grant reference: G1100783/1. This work was also supported, in part, by the CGIAR Research Program on Agriculture for Nutrition and Health (A4NH), led by the International Food Policy Research Institute (IFPRI). We acknowledge the CGIAR Fund Donors (https://www.cgiar.org/funders/). The High-Throughput Genomics Group at the Wellcome Trust Centre for Human Genetics in Oxford (funded by Wellcome Trust grant reference 090532/Z/09/Z) generated the sequencing data. We thank the Modernizing Medical Microbiology Informatics Group for bioinformatics assistance; T. Davies, T. Peto, S. Walker and D. Crook for helpful discussions. D.J.W. is a Sir Henry Dale Fellow, jointly funded by the Wellcome Trust and the Royal Society (grant 101237/Z/13/B) and is supported by a Big Data Institute Robertson Fellowship. D.M.M. was supported by the Darwin Trust of Edinburgh and Centre for Immunology, Infection and Evolution (CIIE), University of Edinburgh. B.A.W. was funded through the project ‘Selection and Transmission of Antimicrobial Resistance in Complex Systems (STARCS)’ in the Joint Programming Initiative on Antimicrobial Resistance, grant reference MR/R000093/1. M.J.W. was supported by a Sir Henry Wellcome Postdoctoral Fellowship from the Wellcome Trust (grant reference WT103953MA) and by a Junior Research Fellowship as part of a Wellcome Trust Strategic grant to the Centre for Immunity, Infection and Evolution at the University of Edinburgh (grant reference 095831). The views expressed are those of the authors and are not necessarily those of CGIAR, the Government of Kenya, the Food and Agriculture Organization of the United Nations or other institutions to which the authors are affiliated.
Extended data
Extended Data Fig. 6. The correlation between pairwise genetic distances measured by core genome single nucleotide polymorphisms (cgSNPs) and core genome multi locus sequence typing (cgMLST) of pairs of isolates with ≤ 100 cgMLST and ≤ 1000 cgSNPs.
73% of pairs with ≤ 10 cgMLST loci apart (n = 109) were separated by ≤ 4 cgSNPs while 97% (n = 145) of these ≤10 cgMLST pairs were separated by ≤10 core SNPs. Only one pair had more than 13 cgSNPs. Two horizontal red dotted lines indicate 4 and 10 cgSNPs. Boxplot centre lines show median value; upper and lower bounds show the 25th and 75th quantile, respectively; upper and lower whiskers show the largest and smallest values within 1.5 times the interquartile range above the 75th percentile and below the 25th percentile, respectively; and points show show samples outside the whisker range.
Extended Data Fig. 7. Core genome phylogenetic tree showing the distribution of isolates involved in the 6 different categories of sharing events.
Ring colours indicate the sharing category (human-human, human-livestock, human-wildlife, livestock-livestock, livestock-wildlife, wildlife-wildlife) from the innermost to the outermost rings, respectively.
Extended Data Fig. 8. Number of sharing events across 15 host category types, within and between households for each of 7 identified antibiotic classes.
(a) Beta-lactam (n = 21686), (b) Aminoglycosides (n = 36934), (c) Fluoroquinolone (n = 2088), (d) Macrolide (n = 1533), (e) Sulfonamide (n = 38125), (f) Trimethoprim (n = 36315), (g) Tetracyclines (n = 36816). Panels show the 95% confidence intervals (vertical lines) of the calculated expected distribution using a resampling approach, points depict the observed number of sharing events in each category coloured according to whether they fall above (red), below (blue) or within (black) the expected distribution. Source type of isolate pairs are indicated on the x-axis with either Human (H), Livestock birds (LB), Livestock mammals (LM), Wildlife birds (WB), Wildlife mammals (WM). In each plot, within-category connections are on the left of the grey dotted line and between-category connections are on the right.
Source data
Metadata (isolate source, Clermont phylotype and MLST) and Newick tree for Fig. 1.
List of sharing pairs, cgMLST pairwise distance, host type and household sharing category.
List of observed and expected sharing events for each household and host type for core genome, pangenome and resistome.
List of households and corresponding sublocation, wealth group and coordinates.
Metadata (household ID and MLST) and Newick tree for Extended Data Fig. 2.
Summary output of threshold analysis from cutpointR.
Household pair, host sharing category and geographical distance between household (KMs).
List of sharing pairs, cgSNP pairwise distance, host type and household sharing category.
List of pairwise cgMLST (<100) and cgSNP (<500) distances.
Lists of isolates involved in each type of sharing (H–H, H–L, L–L, H–W, L–W and W–W). H, human; L, livestock; W, wildlife.
List of observed and expected sharing events for each household and host type across seven antibiotic classes.
Author contributions
E.M.F., T.P.R., M.E.J.W., S.K., E.K., J.M.B. and M.J.W. designed the sample collection design. M.J.W., M.E.J.W. and E.M.F. designed the sequencing design. M.F., J.M.B., J.A., J.M.H., J.M.B., P.M., D.M.M, Y.N., E.F., T.I., L.A., F.A., M.K.M., T.K., E.O. and A.O. collected surveys and samples in the field. V.K., A.K., C.N., N.G., T.O., J.M.H., S.M.N., A.O., J.K. and D.M.M. performed microbiological cultures and DNA extraction. B.A.W., D.M.M. and M.J.W. performed bioinformatic and phylogenetic analysis. L.P., H.P., A.I. and D.J.W. contributed to bioinformatic analysis. D.M.H.M., D.M.M., B.A.W., E.M.F. and M.E.J.W. performed epidemiological and statistical analyses, interpreted results and wrote the paper. J.R., D.J.W., C.K., C.T. and J.D.D. contributed intellectually to the study design and interpretation. All authors provided comments on the manuscript and gave final approval for publication. D.M.M. and B.A.W. contributed equally. M.E.J.W. and E.M.F. contributed equally.
Peer review
Peer review information
Nature Microbiology thanks B. Jesse Shapiro and the other, anonymous, reviewer(s) for their contribution to the peer review of this work.
Data availability
Whole-genome sequences used in this study are available under the BioProjects with accession numbers PRJEB32607 and PRJEB41827. The reference genome used for mapping is E. coli strain EC958 (GCA_000285655.3). The ResFinder AMR gene database used was downloaded on 25 September 2019 from https://bitbucket.org/genomicepidemiology/resfinder_db. Source data are provided with this paper.
Code availability
The scripts used to perform this analysis can be found at https://git.ecdf.ed.ac.uk/epigroup/urbanzoo.
Competing interests
The authors declare no competing interests.
Footnotes
Publisher’s note Springer Nature remains neutral with regard to jurisdictional claims in published maps and institutional affiliations.
These authors contributed equally: Dishon M. Muloi, Bryan A. Wee.
Contributor Information
Mark E. J. Woolhouse, Email: Mark.Woolhouse@ed.ac.uk
Eric M. Fèvre, Email: Eric.Fevre@liverpool.ac.uk
Extended data
is available for this paper at 10.1038/s41564-022-01079-y.
Supplementary information
The online version contains supplementary material available at 10.1038/s41564-022-01079-y.
References
- 1.Karesh WB, et al. Ecology of zoonoses: natural and unnatural histories. Lancet. 2012;380:1936–1945. doi: 10.1016/S0140-6736(12)61678-X. [DOI] [PMC free article] [PubMed] [Google Scholar]
- 2.Wolfe ND, Dunavan CP, Diamond J. Origins of major human infectious diseases. Nature. 2007;447:279–283. doi: 10.1038/nature05775. [DOI] [PMC free article] [PubMed] [Google Scholar]
- 3.Allen T, et al. Global hotspots and correlates of emerging zoonotic diseases. Nat. Commun. 2017;8:1124. doi: 10.1038/s41467-017-00923-8. [DOI] [PMC free article] [PubMed] [Google Scholar]
- 4.Zhang, F. et al. Global discovery of human-infective RNA viruses: a modelling analysis. PLoS Pathog. 10.1371/journal.ppat.1009079 (2020). [DOI] [PMC free article] [PubMed]
- 5.Gottdenker NL, Streicker DG, Faust CL, Carroll CR. Anthropogenic land use change and infectious diseases: a review of the evidence. EcoHealth. 2014;11:619–632. doi: 10.1007/s10393-014-0941-z. [DOI] [PubMed] [Google Scholar]
- 6.Muloi D, et al. Epidemiology of antimicrobial-resistant Escherichia coli carriage in sympatric humans and livestock in a rapidly urbanizing city. Int. J. Antimicrob. Agents. 2019;54:531–537. doi: 10.1016/j.ijantimicag.2019.08.014. [DOI] [PMC free article] [PubMed] [Google Scholar]
- 7.Santiago-Alarcon, D. & MacGregor-Fors, I. Cities and pandemics: urban areas are ground zero for the transmission of emerging human infectious diseases. J. Urban Ecol. 10.1093/jue/juaa012 (2020).
- 8.Woolhouse M, Ward M, van Bunnik B, Farrar J. Antimicrobial resistance in humans, livestock and the wider environment. Phil. Trans. R. Soc. B. 2015;370:20140083. doi: 10.1098/rstb.2014.0083. [DOI] [PMC free article] [PubMed] [Google Scholar]
- 9.Hanage, W. P. Two health or not two health? That is the question. mBio10.1128/mBio.00550-19 (2019). [DOI] [PMC free article] [PubMed]
- 10.Hassell JM, Begon M, Ward MJ, Fèvre EM. Urbanization and disease emergence: dynamics at the wildlife–livestock–human interface. Trends Ecol. Evol. 2017;32:55–67. doi: 10.1016/j.tree.2016.09.012. [DOI] [PMC free article] [PubMed] [Google Scholar]
- 11.Neiderus, C.-J. How urbanization affects the epidemiology of emerging infectious diseases. Infect. Ecol. Epidemiol. 10.3402/iee.v5.27060 (2015). [DOI] [PMC free article] [PubMed]
- 12.Hassell JM, et al. Clinically relevant antimicrobial resistance at the wildlife–livestock–human interface in Nairobi: an epidemiological study. Lancet Planet. Health. 2019;3:e259–e269. doi: 10.1016/S2542-5196(19)30083-X. [DOI] [PMC free article] [PubMed] [Google Scholar]
- 13.Vittecoq M, et al. Antimicrobial resistance in wildlife. J. Appl. Ecol. 2016;53:519–529. [Google Scholar]
- 14.Rwego IB, Isabirye‐Basuta G, Gillespie TR, Goldberg TL. Gastrointestinal bacterial transmission among humans, mountain gorillas, and livestock in Bwindi Impenetrable National Park, Uganda. Conserv. Biol. 2008;22:1600–1607. doi: 10.1111/j.1523-1739.2008.01018.x. [DOI] [PubMed] [Google Scholar]
- 15.Wee, B. A., Muloi, D. M. & van Bunnik, B. A. D. Quantifying the transmission of antimicrobial resistance at the human and livestock interface with genomics. Clin. Microbiol. Infect. 10.1016/j.cmi.2020.09.019 (2020). [DOI] [PMC free article] [PubMed]
- 16.Jaureguy F, et al. Phylogenetic and genomic diversity of human bacteremic Escherichia coli strains. BMC Genomics. 2008;9:560. doi: 10.1186/1471-2164-9-560. [DOI] [PMC free article] [PubMed] [Google Scholar]
- 17.Tenaillon O, Skurnik D, Picard B, Denamur E. The population genetics of commensal Escherichia coli. Nat. Rev. Microbiol. 2010;8:207–217. doi: 10.1038/nrmicro2298. [DOI] [PubMed] [Google Scholar]
- 18.Murungi, M. K. et al. The Nairobi pork value chain: mapping and assessment of governance, challenges, and food safety issues. Front. Vet. Sci. 10.3389/fvets.2021.581376 (2021). [DOI] [PMC free article] [PubMed]
- 19.Kiambi S, et al. Investigation of the governance structure of the Nairobi dairy value chain and its influence on food safety. Prev. Vet. Med. 2020;179:105009. doi: 10.1016/j.prevetmed.2020.105009. [DOI] [PubMed] [Google Scholar]
- 20.Muloi D, et al. Value chain analysis and sanitary risks of the camel milk system supplying Nairobi city, Kenya. Prev. Vet. Med. 2018;159:203–210. doi: 10.1016/j.prevetmed.2018.09.010. [DOI] [PMC free article] [PubMed] [Google Scholar]
- 21.Kiambi S, et al. Mapping Nairobi’s dairy food system: An essential analysis for policy, industry and research. Agric. Syst. 2018;167:47–60. doi: 10.1016/j.agsy.2018.08.007. [DOI] [PMC free article] [PubMed] [Google Scholar]
- 22.Carron M, et al. Campylobacter, a zoonotic pathogen of global importance: prevalence and risk factors in the fast-evolving chicken meat system of Nairobi, Kenya. PLoS Negl. Trop. Dis. 2018;12:e0006658. doi: 10.1371/journal.pntd.0006658. [DOI] [PMC free article] [PubMed] [Google Scholar]
- 23.Onono JO, et al. Identification of production challenges and benefits using value chain mapping of egg food systems in Nairobi, Kenya. Agric. Syst. 2018;159:1–8. doi: 10.1016/j.agsy.2017.10.001. [DOI] [PMC free article] [PubMed] [Google Scholar]
- 24.Alarcon, P. et al. Urban livestock keeping in the city of Nairobi: diversity of production systems, supply chains, and their disease management and risks. Front. Vet. Sci. 10.3389/fvets.2017.00171 (2017). [DOI] [PMC free article] [PubMed]
- 25.Carron M, et al. The broiler meat system in Nairobi, Kenya: using a value chain framework to understand animal and product flows, governance and sanitary risks. Prev. Vet. Med. 2017;147:90–99. doi: 10.1016/j.prevetmed.2017.08.013. [DOI] [PMC free article] [PubMed] [Google Scholar]
- 26.Alarcon P, et al. Mapping of beef, sheep and goat food systems in Nairobi—a framework for policy making and the identification of structural vulnerabilities and deficiencies. Agric. Syst. 2017;152:1–17. doi: 10.1016/j.agsy.2016.12.005. [DOI] [PMC free article] [PubMed] [Google Scholar]
- 27.Hassell JM, et al. Deterministic processes structure bacterial genetic communities across an urban landscape. Nat. Commun. 2019;10:2643. doi: 10.1038/s41467-019-10595-1. [DOI] [PMC free article] [PubMed] [Google Scholar]
- 28.Hassell JM, et al. Socio-ecological drivers of vertebrate biodiversity and human-animal interfaces across an urban landscape. Glob. Change Biol. 2021;27:781–792. doi: 10.1111/gcb.15412. [DOI] [PMC free article] [PubMed] [Google Scholar]
- 29.Ahmed S, et al. Participatory mapping and food-centred justice in informal settlements in Nairobi. Kenya Geo Geogr. Environ. 2019;6:e00077. [Google Scholar]
- 30.Becking, L. B. Geobiologie of inleiding tot de milieukunde (WP Van Stockum & Zoon, 1934).
- 31.Hubbell, S. P. The Unified Neutral Theory of Biodiversity and Biogeography (MPB-32) (Princeton Univ. Press, 2011). [DOI] [PubMed]
- 32.Schürch AC, Arredondo-Alonso S, Willems RJL, Goering RV. Whole genome sequencing options for bacterial strain typing and epidemiologic analysis based on single nucleotide polymorphism versus gene-by-gene-based approaches. Clin. Microbiol. Infect. 2018;24:350–354. doi: 10.1016/j.cmi.2017.12.016. [DOI] [PubMed] [Google Scholar]
- 33.Dallman TJ, et al. Whole-genome sequencing for national surveillance of Shiga toxin–producing Escherichia coli O157. Clin. Infect. Dis. 2015;61:305–312. doi: 10.1093/cid/civ318. [DOI] [PMC free article] [PubMed] [Google Scholar]
- 34.Goldberg TL, et al. Patterns of gastrointestinal bacterial exchange between chimpanzees and humans involved in research and tourism in western Uganda. Biol. Conserv. 2007;135:511–517. [Google Scholar]
- 35.Salipante SJ, et al. Application of whole-genome sequencing for bacterial strain typing in molecular epidemiology. J. Clin. Microbiol. 2015;53:1072–1079. doi: 10.1128/JCM.03385-14. [DOI] [PMC free article] [PubMed] [Google Scholar]
- 36.Brito IL, et al. Transmission of human-associated microbiota along family and social networks. Nat. Microbiol. 2019;4:964–971. doi: 10.1038/s41564-019-0409-6. [DOI] [PMC free article] [PubMed] [Google Scholar]
- 37.Lax S, et al. Longitudinal analysis of microbial interaction between humans and the indoor environment. Science. 2014;345:1048–1052. doi: 10.1126/science.1254529. [DOI] [PMC free article] [PubMed] [Google Scholar]
- 38.Mohamed M, et al. Large fecal reservoir of Escherichia coli sequence type 131-H30 subclone strains that are shared within households and resemble clinical ST131-H30 isolates. J. Infect. Dis. 2020;221:1659–1668. doi: 10.1093/infdis/jiz669. [DOI] [PMC free article] [PubMed] [Google Scholar]
- 39.Mosites E, et al. Microbiome sharing between children, livestock and household surfaces in western Kenya. PLoS One. 2017;12:e0171017. doi: 10.1371/journal.pone.0171017. [DOI] [PMC free article] [PubMed] [Google Scholar]
- 40.Naziri Z, Derakhshandeh A, Firouzi R, Motamedifar M, Tabrizi AShojaee. DNA fingerprinting approaches to trace Escherichia coli sharing between dogs and owners. J. Appl. Microbiol. 2016;120:460–468. doi: 10.1111/jam.13003. [DOI] [PubMed] [Google Scholar]
- 41.Domman D, et al. Defining endemic cholera at three levels of spatiotemporal resolution within Bangladesh. Nat. Genet. 2018;50:951–955. doi: 10.1038/s41588-018-0150-8. [DOI] [PMC free article] [PubMed] [Google Scholar]
- 42.Falgenhauer L, et al. Circulation of clonal populations of fluoroquinolone-resistant CTX-M-15-producing Escherichia coli ST410 in humans and animals in Germany. Int. J. Antimicrob. Agents. 2016;47:457–465. doi: 10.1016/j.ijantimicag.2016.03.019. [DOI] [PubMed] [Google Scholar]
- 43.Ludden, C. et al. One health genomic surveillance of Escherichia coli demonstrates distinct lineages and mobile genetic elements in isolates from humans versus livestock. mBio10.1128/mBio.02693-18 (2019). [DOI] [PMC free article] [PubMed]
- 44.Moeller AH, et al. Social behavior shapes the chimpanzee pan-microbiome. Sci. Adv. 2016;2:e1500997. doi: 10.1126/sciadv.1500997. [DOI] [PMC free article] [PubMed] [Google Scholar]
- 45.Tung J, et al. Social networks predict gut microbiome composition in wild baboons. eLife. 2015;4:e05224. doi: 10.7554/eLife.05224. [DOI] [PMC free article] [PubMed] [Google Scholar]
- 46.Springer A, Mellmann A, Fichtel C, Kappeler PM. Social structure and Escherichia coli sharing in a group-living wild primate, Verreaux’s sifaka. BMC Ecol. 2016;16:6. doi: 10.1186/s12898-016-0059-y. [DOI] [PMC free article] [PubMed] [Google Scholar]
- 47.Tobin MR, Goldshear JL, Price LB, Graham JP, Leibler JH. A framework to reduce infectious disease risk from urban poultry in the United States. Public Health Rep. 2015;130:380–391. doi: 10.1177/003335491513000417. [DOI] [PMC free article] [PubMed] [Google Scholar]
- 48.Liu, C. M. et al. Escherichia coli ST131-H22 as a foodborne uropathogen. mBio10.1128/mBio.00470-18 (2018). [DOI] [PMC free article] [PubMed]
- 49.Roer L, et al. ST131 fimH22 Escherichia coli isolate with a blaCMY-2/IncI1/ST12 plasmid obtained from a patient with bloodstream infection: highly similar to E. coli isolates of broiler origin. J. Antimicrob. Chemother. 2019;74:557–560. doi: 10.1093/jac/dky484. [DOI] [PubMed] [Google Scholar]
- 50.Mageiros L, et al. Genome evolution and the emergence of pathogenicity in avian Escherichia coli. Nat. Commun. 2021;12:765. doi: 10.1038/s41467-021-20988-w. [DOI] [PMC free article] [PubMed] [Google Scholar]
- 51.McNally, A. et al. Combined analysis of variation in core, accessory and regulatory genome regions provides a super-resolution view into the evolution of bacterial populations. PLoS Genet. 10.1371/journal.pgen.1006280 (2016). [DOI] [PMC free article] [PubMed]
- 52.Song SJ, et al. Cohabiting family members share microbiota with one another and with their dogs. eLife. 2013;2:e00458. doi: 10.7554/eLife.00458. [DOI] [PMC free article] [PubMed] [Google Scholar]
- 53.VanderWaal KL, Ezenwa VO. Heterogeneity in pathogen transmission: mechanisms and methodology. Funct. Ecol. 2016;30:1606–1622. [Google Scholar]
- 54.Muloi D, et al. A cross-sectional survey of practices and knowledge among antibiotic retailers in Nairobi, Kenya. J. Glob. Health. 2019;9:010412–010412. doi: 10.7189/jogh.09.020412. [DOI] [PMC free article] [PubMed] [Google Scholar]
- 55.Bonnedahl J, et al. Dissemination of Escherichia coli with CTX-M Type ESBL between humans and yellow-legged gulls in the south of France. PLoS ONE. 2009;4:e5958. doi: 10.1371/journal.pone.0005958. [DOI] [PMC free article] [PubMed] [Google Scholar]
- 56.Kauffman MD, LeJeune J. European starlings (Sturnus vulgaris) challenged with Escherichia coli O157 can carry and transmit the human pathogen to cattle. Lett. Appl. Microbiol. 2011;53:596–601. doi: 10.1111/j.1472-765X.2011.03163.x. [DOI] [PubMed] [Google Scholar]
- 57.Mukerji S, et al. Resistance to critically important antimicrobials in Australian silver gulls (Chroicocephalus novaehollandiae) and evidence of anthropogenic origins. J. Antimicrob. Chemother. 2019;74:2566–2574. doi: 10.1093/jac/dkz242. [DOI] [PubMed] [Google Scholar]
- 58.Stoesser N, et al. Extensive within-host diversity in fecally carried extended-spectrum-beta-lactamase-producing Escherichia coli isolates: implications for transmission analyses. J. Clin. Microbiol. 2015;53:2122–2131. doi: 10.1128/JCM.00378-15. [DOI] [PMC free article] [PubMed] [Google Scholar]
- 59.Hartung, C. et al. Open data kit: tools to build information services for developing regions. In Proc. 4th ACM/IEEE International Conference on Information and Communication Technologies and Development10.1145/2369220.2369236 (2010).
- 60.Beghain J, Bridier-Nahmias A, Le Nagard H, Denamur E, Clermont O. ClermonTyping: an easy-to-use and accurate in silico method for Escherichia genus strain phylotyping. Microb. Genomics. 2018;4:e000192. doi: 10.1099/mgen.0.000192. [DOI] [PMC free article] [PubMed] [Google Scholar]
- 61.Zhou, Z. et al. The EnteroBase user’s guide, with case studies on Salmonella transmissions, Yersinia pestis phylogeny, and Escherichia core genomic diversity. Genome Res. 10.1101/gr.251678.119 (2020). [DOI] [PMC free article] [PubMed]
- 62.Zankari E, et al. Identification of acquired antimicrobial resistance genes. J. Antimicrob. Chemother. 2012;67:2640–2644. doi: 10.1093/jac/dks261. [DOI] [PMC free article] [PubMed] [Google Scholar]
- 63.Paradis E, Claude J, Strimmer K. APE: analyses of phylogenetics and evolution in R language. Bioinformatics. 2004;20:289–290. doi: 10.1093/bioinformatics/btg412. [DOI] [PubMed] [Google Scholar]
- 64.Thiele C, Hirschfeld G. Cutpointr: improved estimation and validation of optimal cutpoints in R. J. Stat. Softw. 2021;98:1–27. [Google Scholar]
- 65.Alhalabi W, Kitanneh O, Alharbi A, Balfakih Z, Sarirete A. Efficient solution for finding Hamilton cycles in undirected graphs. SpringerPlus. 2016;5:1192. doi: 10.1186/s40064-016-2746-8. [DOI] [PMC free article] [PubMed] [Google Scholar]
Associated Data
This section collects any data citations, data availability statements, or supplementary materials included in this article.
Supplementary Materials
Supplementary Methods.
Supplementary Table 1. Complete list of genomes and accession numbers generated in this study. Supplementary Table 2. Host categories and their constituents and sample numbers. Supplementary Table 3. Additional information on isolates involved in human–livestock sharing events.
Data Availability Statement
Whole-genome sequences used in this study are available under the BioProjects with accession numbers PRJEB32607 and PRJEB41827. The reference genome used for mapping is E. coli strain EC958 (GCA_000285655.3). The ResFinder AMR gene database used was downloaded on 25 September 2019 from https://bitbucket.org/genomicepidemiology/resfinder_db. Source data are provided with this paper.
The scripts used to perform this analysis can be found at https://git.ecdf.ed.ac.uk/epigroup/urbanzoo.


