

Abstract
Background
Hydroquinone (HQ) is a phenolic metabolite of benzene with a potential risk for hematological disorders and hematotoxicity in humans. In the present study, an integrative analysis of microRNA (miRNA) and mRNA expressions was performed to identify potential pathways and miRNA-mRNA network associated with benzene metabolite hydroquinone-induced hematotoxicity.
Methods
K562 cells were treated with 40 μM HQ for 72 h, mRNA and miRNA expression changes were examined using transcriptomic profiles and miRNA microarray, and then bioinformatics analysis was performed.
Results
Out of all the differentially expressed genes (DEGs) and differentially expressed miRNAs (DEMs) induced by HQ, 1482 DEGs and 10 DEMs were up-regulated, and 1594 DEGs and 42 DEMs were down-regulated. HQ-induced DEGs were involved in oxidative stress, apoptosis, DNA methylation, histone acetylation and cellular response to leukemia inhibitory factor GO terms, as well as metabolic, Wnt/β-catenin, NF-κB, and leukemia-related pathways. The regulatory network of mRNAs and miRNAs includes 23 miRNAs, 1108 target genes, and 2304 potential miRNAs-mRNAs pairs. MiR-1246 and miR-224 had the potential to be major regulators in HQ-exposed K562 cells based on the miRNAs-mRNAs network.
Conclusions
This study reinforces the use of in vitro model of HQ exposure and bioinformatic approaches to advance our knowledge on molecular mechanisms of benzene hematotoxicity at the RNA level.
Supplementary Information
The online version contains supplementary material available at 10.1186/s40360-022-00556-8.
Keywords: Hydroquinone, Transcriptomic, MiRNA, Hematotoxicity, K562 cells
Background
Hydroquinone (HQ) is a phenolic metabolite of benzene representing potential risks for hematological disorders and hematotoxicity [1–3]. Extensive research has shown that HQ may contribute to benzene-induced leukemia by oxidative stress, DNA damage, cell cycle regulation, and apoptosis [4–10]. HQ can inhibit erythroid differentiation in HD3 chicken erythroblast cells, K562 human leukemia cells, and U937 human leukemia cells [4, 11–14]. Our previous studies suggest that benzene metabolite phenol, 1,2,4-benzenetriol, and HQ considerably inhibit hemin-induced erythroid differentiation in K562 cells [14, 15]. The underlying molecular mechanisms involved in HQ toxicity are not fully understood.
MicroRNAs (miRNAs) are endogenous, highly conserved small non-coding RNAs that modulate various biological processes like cell survival, proliferation, metabolism, differentiation, and apoptosis [16–19]. The miRNA-mediated gene silencing can involve translational repression, co-translational protein degradation, competition for the cap structure, inhibition of ribosomal subunit joining, inhibition of mRNA circularization through deadenylation, or deadenylation-dependent decay [20, 21]. But recently, miRNAs have been found to mediate gene activation through the bidirectional transcription of the human genome, binding to the enhancer, or recruiting a protein complex with transcriptional activators to the gene promoter [22, 23]. Repression is more common in eukaryotes whereas posttranscriptional upregulation has been observed in specific cell types with distinct transcripts or conditions [23]. MiRNAs have been identified as exerting a powerful effect upon acute myeloid leukemia (AML) development and can be used as potential biomarkers for leukemia diagnosis and prognosis [24–26]. Various studies have assessed the role of miRNAs in particulate matter-exposed human pulmonary epithelial cells, sulfur mustard-resistance of the keratinocyte cell line, alternariol and altertoxin II-treated HepG2 cells, and environmental toxicants-exposed aquatic organisms to explore the corresponding toxicity mechanisms [27–30]. As Liang et al. point out, miRNA-451a and miRNA-486-5p expression are notably lower in HQ-treated CD34+ hematopoietic progenitor cells and K562 cells [13]. HQ may activate apoptotic signals via inhibiting the tumor-suppressive effects of miR-7-5p in TK6 lymphoblastoid cells [31]. However, the role of miRNAs and their target mRNAs expression in benzene hematotoxicity has not been fully addressed yet and needs further study.
Transcriptome sequencing with high sensitivity and good reproducibility is a bargain for detecting low-expression genes [32]. The integration of genomic tools contributes to investigating the molecular mechanism of toxicity [33]. Human leukemia K562 cells were derived from a patient with chronic myeloid leukemia [34]. Here we performed transcriptomic profiles and miRNA microarray to identify mRNAs and miRNAs changes, constructed the mRNAs and miRNAs regulatory network, and performed an in-depth bioinformatic analysis in HQ-induced K562 cells. The differentially expressed mRNAs and miRNAs participated in the metabolic pathways, Wnt/β-catenin pathway, NF-κB pathway, etc. by regulating oxidative stress, apoptosis, DNA methylation, histone acetylation, resulting in hematotoxicity including leukemia. These findings provided a theoretical basis for understanding the molecular mechanisms of benzene hematotoxicity, laying the foundation for future validation of in vivo models as well as therapeutic targets and prognostic factors.
Methods
Cell culture
Human leukemia K562 cells were purchased from Cell Resource Center, PekingUnion Medical College (CRC/PUMC, China), and were cultured as described previously [15, 34]. After K562 cells were treated with 40 μM HQ (Sigma-Aldrich) for 72 h, the cells were harvested for further study.
Transcriptome analysis
The genome-wide transcriptome analysis was analyzed as described previously [35]. Differentially expressed genes (DEGs) analysis was indicated with the absolute log2 (fold change of HQ/C) values and the adjusted P-value <0.05 was considered differentially expressed. Data are representative of three independent experiments. The volcano plot of DEGs was performed by creating scatter plots in Excel software. Select the data of downregulated DEGs including log2 (fold change of HQ/C) values and the adjusted P-value; choose the scatter plot to represent the relationship between the data sets; Add green color for the dots. The data of upregulated DEGs and genes without differential changes were performed in the same plot and added red and blue colors, respectively. Gene Ontology (GO) enrichment analysis of DEGs was conducted by over-representation analysis (ORA) using the online database WebGestalt (http://www.webgestalt.org). Significantly enriched GO terms in DEGs compared to the genome background were defined by Wallenius’ non-central hypergeometric distribution adjusting for gene length bias [36]. The pathway analysis of DEGs was conducted using the Kyoto Encyclopedia of Genes and Genomes (KEGG) database (http://www.kegg.jp/) [37].
miRNA microarray analysis
The miRNA microarray was analyzed as described previously [38]. Total RNA was extracted with Ribozol™ RNA Extraction Reagent (Invitrogen, USA) according to the manufacturer’s protocol. The expression of microRNAs contained in the miRBase was analyzed by microarray using the μParaflo™ Microfluidic Biochip Technology of LC sciences (Huston, TX, USA). A total of 1 μg of miRNA-enriched RNA was labeled with Cy3 using the ULS™ microRNA labeling kit (Kreatech, USA) and hybridized on the microarray. Hybridization images were collected using a laser scanner and digitized using Array-Pro image analysis software. The signals were normalized using a locally-weighted regression (LOWESS) filter.
Differentially expressed miRNAs (DEMs) analysis was indicated with the absolute log2 (fold change of HQ/C) values and P-value <0.05 was considered differentially expressed. Data are representative of three independent experiments. Hierarchical clustering analysis of the DEMs was performed and graphs were generated using the ggplot2 package in R software.
miRNA-mRNA regulatory network construction
The potential target mRNAs of miRNAs were screened from miRWalk (http://mirwalk.umm.uni-heidelberg.de), miRanda (https://microbit.org), TargetScan (http://www.targetscan.org), miRDB (http://mirdb.org) and RNA22 (https://cm.jefferson.edu). The miRNA target genes that appeared in at least three prediction databases were screened and quantified from the results of transcriptome analysis. Cytoscape software (version 3.8.0) was employed to construct and analyze the miRNA-mRNA regulatory network.
Results
The effects of HQ on DEGs and DEMs in K562 cells
The volcano plot of overall gene expression showed that 3076 genes were differentially expressed in K562 cells treated with 40 μM HQ for 72 h, including 1482 upregulated and 1594 downregulated DEGs (Fig. 1a). Moreover, there were 84 upregulated and 307 downregulated DEGs over a 2-fold change after HQ exposure. The top 10 upregulated DEGs and top 10 downregulated DEGs based on the absolute log2 (fold change of HQ/C) values after HQ exposure for 72 h were set out in Table 1. What stands out in the table is that LILRA6 (log2 (HQ/C) = 4.17) was the most upregulated DEG and HBB (log2 (HQ/C) = −4.95) was the most downregulated DEG.
Fig. 1.
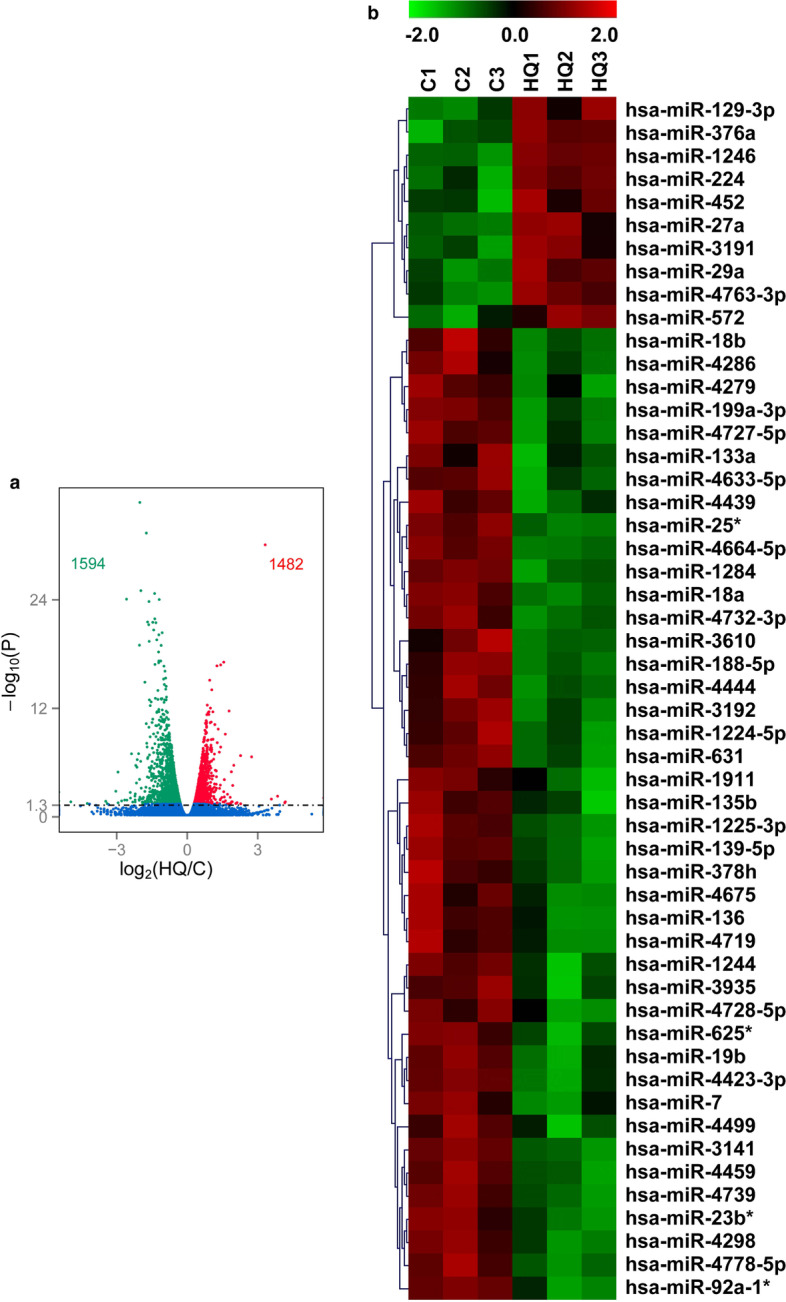
DEGs and DEMs in HQ-induced K562 cells. a The volcano plot displays the gene expression in the HQ group compared with control by transcriptomic analysis. Each point represents one of the detected genes. Green points are downregulated DEGs, red points are upregulated DEGs, and blue points are genes without differential changes when compared with control. Horizontal dotted lines indicate statistical thresholds for adjusted P-value <0.05. b The clustered heatmap of HQ and C groups by miRNA microarray assay. HQ: hydroquinone-induced K562 cells; C: the control group
Table 1.
Top 10 upregulated or downregulated DEGs in HQ-induced K562 cells
| Gene name | Description | C | HQ | Log2 (HQ/C) | Adjusted P-value |
|---|---|---|---|---|---|
| LILRA6 | leukocyte immunoglobulin like receptor A6 | 0.4 | 6.4 | 4.17 | 0.025* |
| KISS1 | KiSS-1 metastasis-suppressor | 0.4 | 6.2 | 4.15 | 0.031* |
| GPR35 | G protein-coupled receptor 35 | 0.7 | 10.1 | 3.84 | 0.006** |
| CREB3L3 | cAMP responsive element binding protein 3 like 3 | 0.7 | 8.5 | 3.58 | 0.012* |
| THBS1 | thrombospondin 1 | 31.8 | 317.2 | 3.32 | 0.000*** |
| PI16 | peptidase inhibitor 16 | 6.7 | 44.9 | 2.74 | 0.000*** |
| CCL2 | C-C motif chemokine ligand 2 | 11.7 | 56.3 | 2.27 | 0.000*** |
| IGFBP5 | insulin like growth factor binding protein 5 | 18.4 | 80.3 | 2.13 | 0.031* |
| CHGB | chromogranin B | 2.8 | 11.9 | 2.07 | 0.037* |
| ITGA3 | integrin subunit alpha 3 | 11.3 | 44.7 | 1.98 | 0.000*** |
| KIF19 | kinesin family member 19 | 10.6 | 1.8 | −2.57 | 0.018* |
| BMP2 | bone morphogenetic protein 2 | 9.9 | 1.6 | −2.66 | 0.018* |
| LRRTM1 | leucine rich repeat transmembrane neuronal 1 | 8.9 | 1.3 | −2.79 | 0.023* |
| NMUR1 | neuromedin U receptor 1 | 21.9 | 2.9 | −2.94 | 0.000*** |
| MARVELD3 | MARVEL domain containing 3 | 7.4 | 1.0 | −2.94 | 0.037* |
| ACTL10 | actin like 10 | 12.7 | 1.5 | −3.04 | 0.002*** |
| LRRC14B | leucine rich repeat containing 14B | 6.4 | 0.6 | −3.41 | 0.046* |
| KRT36 | keratin 36 | 7.1 | 0.6 | −3.47 | 0.024* |
| GOLGA8Q | golgin subfamily A | 5.7 | 0.3 | −4.25 | 0.045* |
| HBB | hemoglobin subunit beta | 370.6 | 12.0 | −4.95 | 0.029* |
* represents P value < 0.05; ** represents P value < 0.01; *** represents P value < 0.005
The heatmap and hierarchical clustering analysis showed that 52 miRNAs were differentially expressed after HQ exposure, including 10 upregulated and 42 downregulated DEMs (Fig. 1b). In addition, 7 upregulated and 23 downregulated DEMs were over 2-fold change after HQ exposure. These results indicated that majority of genes and miRNAs were downregulated after HQ exposure. The top 10 upregulated DEMs and top 10 downregulated DEMs based on the absolute log2 (fold change of HQ/C) values after HQ exposure for 72 h were set out in Table 2. It is apparent from this table that miR-1246 (log2 (HQ/C) = 4.49) was the most upregulated DEM and miR-4423-3p was the most downregulated DEM.
Table 2.
Top 10 upregulated or downregulated DEMs in HQ-induced K562 cells
| miRNA name | C | HQ | Log2 (HQ/C) | P-value |
|---|---|---|---|---|
| miR-1246 | 1278 | 28,646 | 4.49 | 0.001*** |
| miR-224 | 251 | 909 | 1.86 | 0.034* |
| miR-572 | 51 | 150 | 1.55 | 0.033* |
| miR-129-3p | 63 | 166 | 1.41 | 0.026* |
| miR-29a | 86 | 219 | 1.35 | 0.011* |
| miR-27a | 128 | 291 | 1.18 | 0.039* |
| miR-452 | 22 | 49 | 1.16 | 0.045* |
| miR-376a | 24 | 40 | 0.77 | 0.030* |
| miR-3191 | 25 | 41 | 0.75 | 0.025* |
| miR-4763-3p | 70 | 90 | 0.36 | 0.009** |
| miR-4778-5p | 4845 | 1973 | −1.3 | 0.008** |
| miR-4298 | 4588 | 1859 | −1.3 | 0.011* |
| miR-23b* | 28 | 12 | −1.3 | 0.015* |
| miR-4732-3p | 34 | 14 | −1.32 | 0.007** |
| miR-7 | 158 | 58 | −1.46 | 0.032* |
| miR-135b | 28 | 10 | −1.48 | 0.043* |
| miR-18a | 1917 | 661 | −1.54 | 0.002*** |
| miR-92a-1* | 118 | 38 | −1.65 | 0.030* |
| miR-25* | 209 | 66 | −1.66 | 0.002*** |
| miR-4423-3p | 81 | 14 | −2.58 | 0.028* |
* represents P value < 0.05; ** represents P value < 0.01; *** represents P value < 0.005
DEGs involved in the oxidative stress, apoptosis, DNA methylation, histone acetylation and cellular response to leukemia inhibitory factor GO terms in HQ-induced K562 cells
The top 30 enriched GO terms of target DEGs were presented in Fig. 2. GO analysis showed that HQ-upregulated DEGs enriched in biological processes for RNA processing, cellular nitrogen compound metabolic process, and ribonucleoprotein complex biogenesis, whereas HQ-downregulated DEGs enriched in biological processes for single-organism cellular process, localization, and response to stimulus. Our previous studies have demonstrated that DNA methylation, histone acetylation, and ROS have major influences on the transcription of erythroid-specific genes [15, 39–41]. Here, we focused on the GO terms of oxidative stress, apoptosis, DNA methylation, and histone acetylation in HQ-induced K562 cells.
Fig. 2.

GO analysis of DEGs in HQ-induced K562 cells. GO enrichment histogram of upregulated DEGs (a) and downregulated DEGs (b)
HQ treatment considerably increases the relative ROS levels in HD3 chicken erythroblast cells, HL-60 promyelocytic leukemia cells (HL-60 cells), Jurkat T-lymphoblastic leukemia cells (Jurkat cells), and K562 cells [4, 40, 42, 43]. In the present study, there were 38 upregulated DEGs and 37 downregulated DEGs in the response to oxidative stress term (GO:0006979), among which there were 27 upregulated DEGs and 20 downregulated DEGs in the cellular response to oxidative stress term (GO:0034599) in HQ-induced K562 cells. Taken together, these indicated the crucial role of oxidative stress in HQ exposure in K562 cells.
Activation of CASP3 and CASP8 both have pivotal roles in the execution phase of cell apoptosis. As mentioned, HQ induces apoptosis in HL-60 cells, Jurkat cells, human bone marrow mononuclear cells (BMMNC), and K562 cells accompanied by CASP3 or CASP8 activation [7, 44, 45]. Consistently, HQ exposure markedly upregulated the mRNA levels of CASP3 and CASP8 to 1.53-fold and 1.38-fold of that in the control K562 cells in the present study. Moreover, there were 17 upregulated DEGs and 14 downregulated DEGs in the positive regulation of apoptotic signaling pathway (GO:2001235), contributing to HQ-induced apoptosis in K562 cells.
Exposure to benzene metabolites phenol and HQ cause an increase in DNA methylation levels at some erythroid-specific genes clusters, including α-globin, β-globin, and GATA1 gene clusters in K562 cells [39, 46]. There were 5 upregulated DEGs (GATAD2A, PRMT5, BRCA1, BEND3, and MTRR) and 2 downregulated DEGs (TDRKH and SPI1) in the DNA methylation term (GO:0006306) in HQ-induced K562 cells in the present study. To date, we have viewed no data on the effects of HQ on histone acetylation, but the effects of environmental chemicals on histone modifications have been explored recently [47, 48]. Presently, there were 17 upregulated DEGs (LIF, BEND3, ATG5, NAA50, HAT1, TAF5L, POLE3, POLE4, GTF3C4, NOC2L, ING3, BRCA1, KANSL2, WDR5, RUVBL1, ACTL6A, SET, and BEND3) and 5 downregulated DEGs (SPI1, MAPK3, WBP2, FLCN, and YEATS2) in the histone acetylation term (GO:0016573) in HQ-induced K562 cells, indicating their potential roles in HQ exposure.
Exposure to HQ can markedly change the mRNA levels and DNA methylation levels of erythroid-specific genes, as well as reactive oxygen species (ROS) levels in K562 cells [14, 39–41]. Transcriptomic analysis contributed to high-throughput data for HQ-induced DEGs in K562 cells, which further support the role of oxidative stress, apoptosis, DNA methylation, histone acetylation in benzene metabolite HQ-induced hematotoxicity. In addition, there were 20 upregulated DEGs and 10 downregulated DEGs in the cellular response to leukemia inhibitory factor term (GO:1990830) in HQ-induced K562 cells (Table 3). Different biological processes in response to HQ exposure might result in these genes expression changes and take part in the mechanism of benzene-induced leukemia.
Table 3.
DEGs in the GO term of cellular response to leukemia inhibitory factor
| Gene name | Description | C | HQ | Log2 (HQ/C) | Adjusted P-value |
|---|---|---|---|---|---|
| INA | internexin neuronal intermediate filament protein alpha | 8 | 25 | 1.71 | 0.003*** |
| NEFH | neurofilament heavy polypeptide | 201 | 429 | 1.10 | 0.000*** |
| BCLAF1 | BCL2 associated transcription factor 1 | 868 | 1692 | 0.96 | 0.000*** |
| TWISTNB | TWIST neighbor | 232 | 448 | 0.95 | 0.009** |
| NUP35 | nucleoporin 35 | 119 | 217 | 0.87 | 0.001*** |
| ARID5B | AT-rich interaction domain 5B | 51 | 93 | 0.87 | 0.002*** |
| WDR35 | WD repeat domain 35 | 138 | 242 | 0.80 | 0.000*** |
| MRPL15 | mitochondrial ribosomal protein L15 | 750 | 1194 | 0.67 | 0.000*** |
| NCL | nucleolin | 10,212 | 16,137 | 0.66 | 0.000*** |
| MAT2A | methionine adenosyltransferase 2A | 1673 | 2554 | 0.61 | 0.000*** |
| SRM | spermidine synthase | 3782 | 5646 | 0.58 | 0.003*** |
| RIF1 | replication timing regulatory factor 1 | 597 | 890 | 0.57 | 0.007** |
| SRSF3 | serine and arginine rich splicing factor 3 | 4876 | 7227 | 0.57 | 0.000*** |
| CACYBP | calcyclin binding protein | 3052 | 4434 | 0.54 | 0.000*** |
| MRAS | muscle RAS oncogene homolog | 103 | 150 | 0.53 | 0.031* |
| HNRNPU | heterogeneous nuclear ribonucleoprotein U | 8697 | 12,532 | 0.53 | 0.000*** |
| EED | embryonic ectoderm development | 412 | 585 | 0.51 | 0.003*** |
| SRSF7 | serine and arginine rich splicing factor 7 | 2457 | 3430 | 0.48 | 0.000*** |
| PDCD10 | programmed cell death 10 | 609 | 809 | 0.41 | 0.009** |
| B3GNT2 | beta-1,3-N-acetylglucosaminyltransferase 2 | 468 | 598 | 0.35 | 0.047* |
| LAPTM5 | lysosomal protein transmembrane 5 | 1844 | 1483 | −0.31 | 0.040* |
| KDM3A | lysine demethylase 3A | 895 | 703 | −0.35 | 0.040* |
| PFKP | phosphofructokinase, platelet | 3315 | 2523 | −0.39 | 0.038* |
| FZD4 | frizzled class receptor 4 | 331 | 218 | −0.60 | 0.008** |
| PARP16 | poly (ADP-ribose) polymerase family member 16 | 496 | 324 | −0.62 | 0.000*** |
| PCOLCE | procollagen C-endopeptidase enhancer | 580 | 361 | −0.68 | 0.000*** |
| SYNGR1 | synaptogyrin 1 | 693 | 360 | −0.94 | 0.000*** |
| NR5A2 | nuclear receptor subfamily 5 group A member 2 | 40 | 20 | −1.02 | 0.024* |
| CTH | cystathionine gamma-lyase | 410 | 198 | −1.05 | 0.000*** |
| BSPRY | B-box and SPRY domain containing | 53 | 22 | −1.27 | 0.001*** |
* represents P value < 0.05; ** represents P value < 0.01; *** represents P value < 0.005
DEGs involved in the metabolic, Wnt/β-catenin, NF-κB, and leukemia-related pathways in HQ-induced K562 cells
The HQ-upregulated DEGs were annotated with 243 KEGG pathway whereas the downregulated DEGs included 262 KEGG pathway. The top 20 enriched pathways were presented in Fig. 3. KEGG pathway analysis demonstrated that HQ-upregulated DEGs were the most significantly enriched in the ribosome biogenesis in the eukaryotes pathway (annotated 50 DEGs, P = 4.03E-24), spliceosome, RNA transport, and proteasome whereas HQ-downregulated DEGs enriched in the axon guidance pathway (annotated 28 DEGs, P = 4.96E-05), biosynthesis of amino acids, ribosome and carbon metabolism (Fig. 3).
Fig. 3.

KEGG analysis for DEGs in HQ-induced K562 cells. KEGG pathway enrichment analysis of upregulated DEGs (a) and downregulated DEGs (b). Rich factor indicates the ratio of annotated DEGs number and whole background genes number in the corresponding pathway. The size of each bubble corresponds to the number of annotated DEGs, and the color gradient depicts the adjusted P-value of enrichment significance
In addition, most genes were annotated as the metabolic pathways, attaining 121genes in both the upregulated and the downregulated DEGs. The cytochrome P450 family 1 subfamily A member 1 (CYP1A1) participates in metabolic pathways. The frizzled class receptor 2 (FZD2) gene encodes a protein in the beta-catenin canonical signaling pathway. HQ has been reported to considerably upregulate the mRNA level of CYP1A1, whereas downregulate the mRNA level of FZD2 in human epidermal keratinocytes cells (HEK cells) [49]. In our results, the mRNA levels of CYP1A1 and FZD2 in K562 cells showed similar trends to the HEK cells.
The canonical Wnt/β-catenin pathway is a key factor in multiple biological processes like cell proliferation, apoptosis, motility, and differentiation. HQ treatment reduces the level of β-catenin, a dominant part in the canonical Wnt signaling pathway in BMMNC cells [45]. Presently, HQ considerably downregulated the mRNA levels of WNT6 and WNT11, as well as other 12 genes (FZD2, PLCB2, VANGL2, NFATC4, FZD4, FRAT1, PPARD, CTNNBIP1, RAC2, LRP5, FRAT2, and NFATC2) in the Wnt signaling pathway (hsa04310) (Supplementary Fig. 1).
RNA-seq has identified that hydroquinone promotes DNA homologous recombination repair via activating the NF-κB pathway in the human osteosarcoma cell line (U2OS/DR-GFP) [50]. In our study, the mRNA level of NFKB1 was upregulated after HQ exposure, indicating the NF-κB pathway might be activated in HQ-induced K562 cells.
Furthermore, there were 10, 12, 13, and 39 DEGs annotated as the KEGG terms of chronic myeloid leukemia, acute myeloid leukemia, hematopoietic cell lineage, and human T-cell leukemia virus 1 infection in HQ-induced K562 cells, respectively (Table 4) [37]. The related DEGs were highlighted in the KEGG maps in Supplementary Fig. 2–5. HQ exposure might change these genes’ expression to activate the leukemia-related pathways, resulting in potential benzene hematotoxicity.
Table 4.
KEGG analysis of leukemia related pathways
| KEGG term | ID | Input number | Background number | Regulated | Genes |
|---|---|---|---|---|---|
| Chronic myeloid leukemia | hsa05220 | 4 | 73 | up | CRK, CHUK, NFKB1, NRAS |
| 6 | 73 | down | STAT5B, MAP 2 K2, PIK3CD, GAB2, SHC2, MAPK3 | ||
| Acute myeloid leukemia | hsa05221 | 4 | 57 | up | KIT, CHUK, NFKB1, NRAS |
| 8 | 57 | down | PPARD, MAP2K2, SPI1, PIM1, PIK3CD, STAT5B, MAPK3, STAT3 | ||
| Hematopoietic cell lineage | hsa04640 | 4 | 88 | up | KIT, CD44, THPO, ITGA3 |
| 9 | 88 | down | ITGAM, ITGA2B, CD19, ANPEP, CD33, CD7, IL9R, CD37, ITGA5 | ||
| Human T-cell leukemia virus 1 infection | hsa05166 | 17 | 261 | up | PCNA, ANAPC10, CDC23, NFKB1, POLE3, FOSL1, ATR, VAC14, CDC26, CHUK, ETS2, POLE4, RANBP1, VDAC3, MRAS, CREM, NRAS |
| 22 | 261 | down | STAT5B, HLA-E, TP53INP1, HLA-A, NFATC2, TNFRSF13C, FZD4, FZD2, IL15RA, PIK3CD, TLN1, NFATC4, HLA-B, WNT11, ATF3, SPI1, RRAS, MAP3K3, WNT6, HLA-C, TSPO, SLC25A6 |
Identification of miR-1246 and miR-224 as major regulators in the miRNA-mRNA network in HQ-induced K562 cells
The mutual regulation of DEMs and DEGs was analyzed to construct an interaction network after HQ exposure in K562 cells. It is a widely held view that miRNAs can induce the degradation of their target mRNAs, so we focused on those miRNAs and mRNAs with opposite expression trends. There were 10 upregulated DEMs and 1594 downregulated DEGs, as well as 42 downregulated DEMs and 1482 upregulated DEGs in HQ-induced K562 cells. The entire analysis led to the identification of 23 miRNAs, 1108 target genes, and 2304 potential miRNAs-mRNAs pairs in the network. Moreover, the miRNA-mRNA network of DEGs and DEMs over a 2-fold change was constructed by a cystoscope (Fig. 4).
Fig. 4.

The miRNA-mRNA network of HQ-induced K562 cells. a The network of upregulated DEMs and downregulated target DEGs. b The network of downregulated DEMs and upregulated target DEGs. Triangles indicate DEM and circles indicate DEG. Red represents upregulated expression and green represents downregulated expression
The miRNA-mRNA network was constructed with 109 potential pairs containing 7 upregulated DEMs and 75 downregulated target DEGs in Fig. 4a; the network had 30 potential pairs containing 8 upregulated DEMs and 15 downregulated target DEGs in Fig. 4b. Per miRNA had 2–29 target genes and per gene was connected to 1–5 miRNAs. The lists of top miRNAs and target genes in the network were shown in Table 5 and Table 6. On the other hand, we found that majority of DEGs and DEMs were downregulated after HQ exposure.
Table 5.
List of top-regulated miRNAs in the miRNA-mRNA regulatory network
| miRNA name | Degree | Regulated |
|---|---|---|
| miR-27a | 29 | up |
| miR-1246 | 17 | up |
| miR-129-3p | 17 | up |
| miR-224 | 17 | up |
| miR-452 | 14 | up |
| miR-29a | 13 | up |
| miR-572 | 2 | up |
| miR-188-5p | 6 | down |
| miR-139-5p | 5 | down |
| miR-135b | 5 | down |
| miR-18b | 4 | down |
| miR-136 | 3 | down |
| miR-199a-3p | 3 | down |
| miR-18a | 3 | down |
Table 6.
List of top-regulated genes in the miRNA-mRNA regulatory network
| Gene name | Description | Degree | Regulated |
|---|---|---|---|
| YPEL2 | protein yippee-like 2 | 5 | down |
| TP53INP1 | tumor protein p53-inducible nuclear protein 1 | 5 | down |
| XYLT1 | xylosyltransferase 1 | 4 | down |
| ZC3H6 | zinc finger CCCH domain-containing protein 6 | 4 | down |
| NR5A2 | nuclear receptor subfamily 5 group A member 2 | 4 | down |
| PPP2R2C | serine/threonine-protein phosphatase 2A subunit B gamma isoform | 3 | down |
| FAIM2 | Fas apoptotic inhibitory molecule 2 | 3 | down |
| EPHA4 | ephrin type-A receptor 4 | 3 | down |
| YPEL1 | protein yippee-like 1 | 3 | down |
| THBS1 | thrombospondin-1 | 5 | up |
| CD44 | CD44 antigen | 3 | up |
| IGFBP5 | insulin like growth factor binding protein 5 | 3 | up |
| ITGA3 | integrin subunit alpha 3 | 3 | up |
| WDR43 | WD repeat-containing protein 43 | 3 | up |
HMDD (the Human microRNA Disease Database) is a database for experiment-based miRNA and human disease associations (http://www.cuilab.cn/hmdd) [51]. When the DEMs over a 2-fold change were screened from the HMDD 3.2, 5 miRNAs (miR-27a, miR-224, miR-1246, miR-18a, and miR-18b) were associated with leukemia, indicating potential roles in benzene-induced leukemia. According to the miRNA-mRNA regulatory network, there were more interactions between upregulated miRNAs and downregulated genes than the other way around. In our study, miR-1246 and miR-224 were the most upregulated DEMs with 17 target DEGs whereas miR-18a and miR-18b were downregulated in HQ-induced K562 cells. However, it remains unknown why MiR-27a was upregulated in HQ-induced K562 cells but downregulated in acute leukemia cell lines and primary samples compared to hematopoietic stem-progenitor cells [52]. Therefore, miR-1246 and miR-224 were identified to be major regulators for HQ exposure in K562 cells. These results indicated the crucial role of miR-1246 and miR-224 in benzene hematotoxicity.
Discussion
Our previous studies have demonstrated that hemin-induced erythroid differentiation is concentration-dependently and time-dependently inhibited by benzene metabolites exposure (phenol, 1,2,4-benzenetriol, and hydroquinone) in K562 cells [14, 15, 39, 46]. In the present study, the concentration of 40 μM HQ was selected to correspond to no obvious cytotoxicity but markedly inhibiting erythroid differentiation in K562 cells when exposed for 72 h [14]. Hemoglobin subunit beta (HBB) loci are associated with beta-thalassemia, sickle cell anemia, and heinz body anemias [53–55] . HBB was the most dramatically downregulated gene after HQ exposure, which might play important roles in benzene hematotoxicity.
It has been reported that the NF-κB pathway is activated in the development of chronic myeloid leukemia and acute myeloid leukemia [56–59]. In our study, HQ exposure upregulated the mRNA level of NFKB1 in chronic myeloid leukemia and acute myeloid leukemia pathway, which partly supported that HQ might promote leukemia development by activating the NF-κB pathway. HQ exposure downregulated the mRNA levels of MAP 2 K2 and MAPK3 in chronic myeloid leukemia and acute myeloid leukemia pathway (Table 4). This may inhibit the MAPK signaling pathway and thus inhibit cell proliferation (Supplementary Fig. 2, 3). These results were consistent with our previous study that HQ induced a concentration-dependent decrease in the viabilities in K562 cells [44]. The roles of metabolic pathways, Wnt/β-catenin pathway, and NF-κB pathway in benzene hematotoxicity need further study.
The downregulated miR-1246/1248 are key nodes that reveal the possible relapse mechanisms for pediatric T cell acute lymphoblastic leukemia. As reported, miR-1246 is one of the most highly enriched miRNAs in AML derived extracellular vesicles [16, 60, 61]. MiR-1246, a hundreds-fold alteration in microvesicles from three different leukemia cell lines (K562, Nalm-6, and Jurkat), is upregulated to activate the expression of C6orf211 and C19orf10 to promote tumor progression in patients diagnosed as chronic myeloid leukemia [62]. MiR-224 expression is considerably upregulated in the bone marrow of pediatric AML patients and can be used as noninvasive biomarkers for the early prediction of hepatocellular carcinoma development [63]. These results indicated the crucial role of miR-1246 and miR-224 in hematotoxicity. MiR-29a is highly expressed in arsenic-induced peripheral neuropathy, which is consistent with higher expression after HQ exposure in this study [64]. Low expression of miR-18a distinguishes pediatric and adult acute lymphoblastic leukemia from each other [65]. PML/RARα-regulated miR-181a/b cluster targets the tumor suppressor RASSF1A in acute promyelocytic leukemia [66].
In further research, the expression, target genes, and biological function of miR-1246 and miR-224 will be confirmed by more techniques in HQ-induced K562 cells, CD34+ hematopoietic progenitor cells, U937 human leukemia cells, and human peripheral blood mononuclear cells (PBMCs). Inhibition of miR-1246 and miR-224 will contribute to their regulation for HQ exposure. On the other hand, hydroquinone has been reported to inhibit PRV infection in mouse neuroblastoma N2a cells, protect neurons from transient cerebral ischemia, and reduce gliosis in a gerbil model of transient cerebral ischemia [67, 68]. The study on the effect of HQ on neural systems will contribute to a full understanding of benzene toxicity. Further assessment in suitable animal models or any data of miRNAs expression of benzene-exposed patients will be immensely beneficial to further studies.
Conclusion
In summary, the present study identified differentially expressed genes and miRNAs in HQ-induced K562 cells using transcriptomic profiles and miRNA microarray. The miRNA-mRNA network can help us better understand the molecular mechanisms between miRNAs and their target genes. MiR-1246 and miR-224 had the potential to be major regulators for HQ exposure in K562 cells based on the miRNAs-mRNAs network and were reported to be associated with leukemia, suggesting potential biomarkers for the evaluation of benzene hematotoxicity. Apart from the miRNAs-mRNAs regulation, how miRNAs regulate protein expression remains elusive. Further proteomics study is to be performed to elucidate the underlying mechanism. The GO and KEGG pathways provide a framework for further studies in suitable in vitro and animal models, which will contribute to developing new strategies for the prevention and rapid diagnosis of benzene hematotoxicity.
Supplementary Information
Additional file 1: Supplementary Figure 1. HQ-regulated DEGs of K562 cells in the Wnt signaling pathway. The Wnt signaling pathway was downloaded from the KEGG database (https://www.kegg.jp/kegg-bin/show_pathway?map04310). In K562 cells, HQ-upregulated DEGs were colored pink and HQ-downregulated DEGs were colored green. Supplementary Figure 2. HQ-regulated DEGs of K562 cells in chronic myeloid leukemia pathway. The chronic myeloid leukemia pathway was downloaded from the KEGG database (https://www.kegg.jp/kegg-bin/show_pathway?map05220). In K562 cells, HQ-upregulated DEGs were colored pink and HQ-downregulated DEGs were colored green. Supplementary Figure 3. HQ-regulated DEGs of K562 cells in acute myeloid leukemia pathway. The acute myeloid leukemia pathway was downloaded from the KEGG database (https://www.kegg.jp/kegg-bin/show_pathway?map05221). In K562 cells, HQ-upregulated DEGs were colored pink and HQ-downregulated DEGs were colored green. Supplementary Figure 4. HQ-regulated DEGs of K562 cells in hematopoietic cell lineage pathway. The hematopoietic cell lineage pathway was downloaded from the KEGG database (https://www.kegg.jp/kegg-bin/show_pathway?map04640). In K562 cells, HQ-upregulated DEGs were colored pink and HQ-downregulated DEGs were colored green. Supplementary Figure 5. HQ-regulated DEGs of K562 cells in human T-cell leukemia virus 1 infection pathway. The human T-cell leukemia virus 1 infection pathway was downloaded from the KEGG database (https://www.kegg.jp/kegg-bin/show_pathway?map05166). In K562 cells, HQ-upregulated DEGs were colored pink and HQ-downregulated DEGs were colored green.
Acknowledgements
Not applicable.
Authors’ contributions
All authors have contributed to this scientific work and approved the manuscript. CY, SY, and ZY designed this study, performed the experiments and data analysis, and wrote the manuscript. LL, YX, FZ, and XL were involved in methodology and software. ZY supervised the drafting of the manuscript and is responsible for correspondence. All authors took responsibility for the integrity of the data and the accuracy of the data analysis.
Funding
This work was supported by grants from the National Natural Science Foundation of China (Project No. 81070091 and 81573192).
Availability of data and materials
The datasets used and/or analyzed during the current study are available from the corresponding author on reasonable request.
Declarations
Ethics approval and consent to participate
Not applicable.
Consent for publication
Not applicable.
Competing interests
The authors declare that there is no conflict of interest.
Footnotes
Publisher’s Note
Springer Nature remains neutral with regard to jurisdictional claims in published maps and institutional affiliations.
References
- 1.Aksoy M. Hematotoxicity and carcinogenicity of benzene. Environ Health Perspect. 1989;82:193–197. doi: 10.1289/ehp.8982193. [DOI] [PMC free article] [PubMed] [Google Scholar]
- 2.Huff J. Benzene-induced cancers: Abridged history and occupational health impact. Int J Occup Environ Health. 2007;13:213–221. doi: 10.1179/oeh.2007.13.2.213. [DOI] [PMC free article] [PubMed] [Google Scholar]
- 3.Rothman N, Smith MT, Hayes RB, Li GL, Irons RD, Dosemeci M, et al. An epidemiologic study of early biologic effects of benzene in Chinese workers. Environ Health Perspect. 1996;104:1365–1370. doi: 10.1289/ehp.961041365. [DOI] [PMC free article] [PubMed] [Google Scholar]
- 4.Badham HJ, Winn LM. In utero and in vitro effects of benzene and its metabolites on erythroid differentiation and the role of reactive oxygen species. Toxicol Appl Pharmacol. 2010;224:273–279. doi: 10.1016/j.taap.2010.01.002. [DOI] [PubMed] [Google Scholar]
- 5.Gaskell M, McLuckie KI, Farmer PB. Genotoxicity of the benzene metabolites para-benzoquinone and hydroquinone. Chem Biol Interact. 2005;153:267–270. doi: 10.1016/j.cbi.2005.03.034. [DOI] [PubMed] [Google Scholar]
- 6.Hatzi VI, Terzoudi GI, Pantelias GE, Spiliopoulou C, Makropoulos V. The benzene metabolite hydroquinone enhances G2-chromosomal radiosensitivity by inducing a less-efficient G2-M-checkpoint in irradiated lymphocytes. Int J Oncol. 2007;31:145–152. [PubMed] [Google Scholar]
- 7.Inayat-Hussain SH, Winski SL, Ross D. Differential involvement of caspases in hydroquinone-induced apoptosis in human leukemic hl-60 and jurkat cells. Toxicol Appl Pharmacol. 2001;175:95–103. doi: 10.1006/taap.2001.9221. [DOI] [PubMed] [Google Scholar]
- 8.McDonald TA, Holland NT, Skibola C, Duramad P, Smith MT. Hypothesis: Phenol and hydroquinone derived mainly from diet and gastrointestinal flora activity are causal factors in leukemia. Leukemia. 2001;15:10–20. doi: 10.1038/sj.leu.2401981. [DOI] [PubMed] [Google Scholar]
- 9.Smith MT. The mechanism of benzene-induced leukemia: A hypothesis and speculations on the causes of leukemia. Environ Health Perspect. 1996;104:1219–1225. doi: 10.1289/ehp.961041219. [DOI] [PMC free article] [PubMed] [Google Scholar]
- 10.Tan Q, Li J, Peng J, Liu Z, Liu J, Zhang H, et al. E4F1 silencing inhibits the cell growth through cell-cycle arrest in malignant transformed cells induced by droquinone. J Biochem Mol Toxicol. 2019;33:e22269. doi: 10.1002/jbt.22269. [DOI] [PubMed] [Google Scholar]
- 11.Chen YJ, Liu WH, Chang LS. Hydroquinone-induced FOXP3-ADAM17-Lyn-Akt-p21 signaling axis promotes malignant progression of human leukemia U937 cells. Arch Toxicol. 2017;91:983–997. doi: 10.1007/s00204-016-1753-4. [DOI] [PubMed] [Google Scholar]
- 12.Liang B, Chen Y, Yuan W, Qin F, Zhang Q, Deng N, et al. Down-regulation of miRNA-451a and miRNA-486-5p involved in benzene-induced inhibition on erythroid cell differentiation in vitro and in vivo. Arch Toxicol. 2018;92:259–272. doi: 10.1007/s00204-017-2033-7. [DOI] [PubMed] [Google Scholar]
- 13.Ma X, Zhang X, Luo J, Liang B, Peng J, Chen C, et al. MiR-486-5p-directed MAGI1/Rap1/RASSF5 signaling pathway contributes to hydroquinone-induced inhibition of erythroid differentiation in K562 cells. Toxicol in Vitro. 2020;66:104830. doi: 10.1016/j.tiv.2020.104830. [DOI] [PubMed] [Google Scholar]
- 14.Wu XR, Xue M, Li XF, Wang Y, Wang J, Han QL, et al. Phenolic metabolites of benzene inhibited the erythroid differentiation of K562 cells. Toxicol Lett. 2011;203:190–199. doi: 10.1016/j.toxlet.2011.03.012. [DOI] [PubMed] [Google Scholar]
- 15.Yu CH, Li Y, Zhao X, Yang SQ, Li L, Cui NX, et al. Benzene metabolite 1,2,4-benzenetriol changes DNA methylation and histone acetylation of erythroid-specific genes in K562 cells. Arch Toxicol. 2019;93:137–147. doi: 10.1007/s00204-018-2333-6. [DOI] [PubMed] [Google Scholar]
- 16.Butler JT, Abdelhamed S, Gao L, Lim J, Horton TM, Kurre P. Leukemic stress targets the mTOR pathway to suppress residual HSC in the BM microenvironment. Blood. 2019;134:3730. [Google Scholar]
- 17.Guo H, Ingolia NT, Weissman JS, Bartel DP. Mammalian microRNAs predominantly act to decrease target mRNA levels. Nature. 2010;466:835–840. doi: 10.1038/nature09267. [DOI] [PMC free article] [PubMed] [Google Scholar]
- 18.Siomi H, Siomi MC. Posttranscriptional regulation of microRNA biogenesis in animals. Mol Cell. 2010;38:323–332. doi: 10.1016/j.molcel.2010.03.013. [DOI] [PubMed] [Google Scholar]
- 19.Valencia-Sanchez MA, Liu J, Hannon GJ, Parker R. Control of translation and mRNA degradation by miRNAs and siRNAs. Genes Dev. 2006;20:515–524. doi: 10.1101/gad.1399806. [DOI] [PubMed] [Google Scholar]
- 20.Eulalio A, Huntzinger E, Izaurralde E. Getting to the root of miRNA-mediated gene silencing. Cell. 2008;132(1):9–14. doi: 10.1016/j.cell.2007.12.024. [DOI] [PubMed] [Google Scholar]
- 21.Behm-Ansmant I, Rehwinkel J, Izaurralde E. MicroRNAs silence gene expression by repressing protein expression and/or by promoting mRNA decay. Cold Spring Harb Symp Quant Biol. 2006;71:523–530. doi: 10.1101/sqb.2006.71.013. [DOI] [PubMed] [Google Scholar]
- 22.Pu M, Chen J, Tao Z, Miao L, Qi X, Wang Y, et al. Regulatory network of miRNA on its target: coordination between transcriptional and post-transcriptional regulation of gene expression. Cell Mol Life Sci. 2019;76(3):441–451. doi: 10.1007/s00018-018-2940-7. [DOI] [PMC free article] [PubMed] [Google Scholar]
- 23.Vasudevan S. Posttranscriptional upregulation by microRNAs. Wiley Interdiscip Rev RNA. 2012;3:311–330. doi: 10.1002/wrna.121. [DOI] [PubMed] [Google Scholar]
- 24.Marcucci G, Maharry KS, Metzeler KH, Volinia S, Wu YZ, Mrózek K, et al. Clinical role of microRNAs in cytogenetically normal acute myeloid leukemia: miR-155 upregulation independently identifies high-risk patients. J Clin Oncol. 2013;31:2086–2093. doi: 10.1200/JCO.2012.45.6228. [DOI] [PMC free article] [PubMed] [Google Scholar]
- 25.Lopotova T, Zackova M, Klamova H, Moravcova J. MicroRNA-451 in chronic myeloid leukemia: miR-451-BCR-ABL regulatory loop? Leuk Res. 2011;35:974–977. doi: 10.1016/j.leukres.2011.03.029. [DOI] [PubMed] [Google Scholar]
- 26.Wallace JA, O'Connell RM. MicroRNAs and acute myeloid leukemia: therapeutic implications and emerging concepts. Blood. 2017;130:1290–1301. doi: 10.1182/blood-2016-10-697698. [DOI] [PMC free article] [PubMed] [Google Scholar]
- 27.Bertucci A, Pierron F, Ye T, Gonzalez P, Couture P, Baudrimont M. Identification and expression of microRNAs in european eels Anguilla anguilla from two natural sites with different pollution levels. Environ Pollut. 2019;250:274–283. doi: 10.1016/j.envpol.2019.04.029. [DOI] [PubMed] [Google Scholar]
- 28.Rothmiller S, Wolf M, Worek F, Steinritz D, Thiermann H, Schmidt A. Alteration of miRNA expression in a sulfur mustard resistant cell line. Toxicol Lett. 2018;293:38–44. doi: 10.1016/j.toxlet.2017.08.014. [DOI] [PubMed] [Google Scholar]
- 29.Vejdovszky K, Sack M, Jarolim K, Aichinger G, Somoza MM, Marko D. In vitro combinatory effects of the Alternaria mycotoxins alternariol and altertoxin II and potentially involved miRNAs. Toxicol Lett. 2017;267:45–52. doi: 10.1016/j.toxlet.2016.12.011. [DOI] [PubMed] [Google Scholar]
- 30.Xu Z, Wang N, Xu Y, Hua L, Zhou D, Zheng M, et al. Effects of chronic PM2.5 exposure on pulmonary epithelia: Transcriptome analysis of mRNA-exosomal miRNA interactions. Toxicol Lett. 2019;316:49–59. doi: 10.1016/j.toxlet.2019.09.010. [DOI] [PubMed] [Google Scholar]
- 31.Luo H, Liang H, Chen Y, Chen S, Xu Y, Xu L, et al. miR-7-5p overexpression suppresses cell proliferation and promotes apoptosis through inhibiting the ability of DNA damage repair of PARP-1 and BRCA1 in TK6 cells exposed to hydroquinone. Chem Biol Interact. 2018;283:84–90. doi: 10.1016/j.cbi.2018.01.019. [DOI] [PubMed] [Google Scholar]
- 32.Yadav NK, Shukla P, Omer A, Pareek S, Singh RK. Next generation sequencing: potential and application in drug discovery. Sci World J. 2014;2014:802437. doi: 10.1155/2014/802437. [DOI] [PMC free article] [PubMed] [Google Scholar] [Retracted]
- 33.Robbens J, van der Ven K, Maras M, Blust R, De Coen W. Ecotoxicological risk assessment using DNA chips and cellular reporters. Trends Biotechnol. 2007;25:460–466. doi: 10.1016/j.tibtech.2007.08.005. [DOI] [PubMed] [Google Scholar]
- 34.Lozzio CB, Lozzio BB. Human chronic myelogenous leukemia cell-line with positive Philadelphia chromosome. Blood. 1975;45:321–334. [PubMed] [Google Scholar]
- 35.Gao F, Kataoka M, Liu N, Liang T, Huang ZP, Gu F, et al. Therapeutic role of miR-19a/19b in cardiac regeneration and protection from myocardial infarction. Nat Commun. 2019;10:1802–1815. doi: 10.1038/s41467-019-09530-1. [DOI] [PMC free article] [PubMed] [Google Scholar]
- 36.Young MD, Wakefield MJ, Smyth GK, Oshlack A. Gene ontology analysis for RNA-seq: accounting for selection bias. Genome Biol. 2010;11:R14. doi: 10.1186/gb-2010-11-2-r14. [DOI] [PMC free article] [PubMed] [Google Scholar]
- 37.Kanehisa M, Goto S. KEGG: Kyoto encyclopedia of genes and genomes. Nucleic Acids Res. 2000;28:27–30. doi: 10.1093/nar/28.1.27. [DOI] [PMC free article] [PubMed] [Google Scholar]
- 38.Guo J, Miao Y, Xiao B, Huan R, Jiang Z, Meng D, et al. Differential expression of microRNA species in human gastric cancer versus non-tumorous tissues. J Gastroenterol Hepatol. 2009;24:652–657. doi: 10.1111/j.1440-1746.2008.05666.x. [DOI] [PubMed] [Google Scholar]
- 39.Li Y, Wu XR, Li XF, Suriguga YCH, Li YR, Yi ZC. Changes in DNA methylation of erythroid-specific genes in K562 cells exposed to phenol and hydroquinone. Toxicology. 2013;312:108–114. doi: 10.1016/j.tox.2013.08.007. [DOI] [PubMed] [Google Scholar]
- 40.Yu CH, Suriguga LY, Li YR, Tang KY, Jiang L, Yi ZC. The role of ROS in hydroquinone-induced inhibition of K562 cell erythroid differentiation. Biomed Environ Sci. 2014;27:212–214. doi: 10.3967/bes2014.043. [DOI] [PubMed] [Google Scholar]
- 41.Yu CH, Jiang L, Wang Y, Cui NX, Zhao X, Yi ZC. Inhibition of erythroid differentiation of human leukemia K562 cells by N-acetylcysteine and ascorbic acid through downregulation of ROS. Biomed Environ Sci. 2018;31:247–251. doi: 10.3967/bes2018.032. [DOI] [PubMed] [Google Scholar]
- 42.Ishihama M, Toyooka T, Ibuki Y. Toxicology in Vitro Generation of phosphorylated histone H2AX by benzene metabolites. Toxicol in Vitro. 2008;22:1861–1868. doi: 10.1016/j.tiv.2008.09.005. [DOI] [PubMed] [Google Scholar]
- 43.Kim YJ, Woo HD, Kim BM, Lee YJ, Kang SJ, Cho YH, et al. Risk assessment of hydroquinone: differential responses of cell growth and lethality correlated to hydroquinone concentration. J Toxicol Environ Health A. 2009;72:1272–1278. doi: 10.1080/15287390903212279. [DOI] [PubMed] [Google Scholar]
- 44.Wang Y, Zhang GY, Han QL, Wang J, Suriguga LY, Yu CH, et al. Phenolic metabolites of benzene induced caspase-dependent cytotoxicities to K562 cells accompanied with decrease in cell surface sialic acids. Environ Toxicol. 2014;29:1437–1451. doi: 10.1002/tox.21874. [DOI] [PubMed] [Google Scholar]
- 45.Li J, Jiang S, Chen Y, Ma R, Chen J, Qian S, et al. Benzene metabolite hydroquinone induces apoptosis of bone marrow mononuclear cells through inhibition of β-catenin signaling. Toxicol in Vitro. 2018;46:361–369. doi: 10.1016/j.tiv.2017.08.018. [DOI] [PubMed] [Google Scholar]
- 46.Tang KY, Yu CH, Jiang L, Gong M, Liu WJ, Wang Y, et al. Long-term exposure of K562 cells to benzene metabolites inhibited erythroid differentiation and elevated methylation in erythroid specific genes. Toxicol Res. 2016;5:1284–1297. doi: 10.1039/c6tx00143b. [DOI] [PMC free article] [PubMed] [Google Scholar]
- 47.Baccarelli A, Bollati V. Epigenetics and environmental chemicals. Curr Opin Pediatr. 2009;21:243–251. doi: 10.1097/mop.0b013e32832925cc. [DOI] [PMC free article] [PubMed] [Google Scholar]
- 48.Philbrook NA, Winn LM. Investigating the effects of in utero benzene exposure on epigenetic modifications in maternal and fetal CD-1 mice. Toxicol Appl Pharmacol. 2015;289:12–19. doi: 10.1016/j.taap.2015.08.019. [DOI] [PubMed] [Google Scholar]
- 49.Pyo JJ, Ahn S, Jin SH, An S, Lee E, Choi J, et al. Keratinocyte-derived IL-36γ plays a role in hydroquinone-induced chemical leukoderma through inhibition of melanogenesis in human epidermal melanocytes. Arch Toxicol. 2019;93:2307–2320. doi: 10.1007/s00204-019-02506-6. [DOI] [PubMed] [Google Scholar]
- 50.Yang X, Lu Y, He F, Hou F, Xing C, Xu P, et al. Benzene metabolite hydroquinone promotes DNA homologous recombination repair via the NF-κB pathway. Carcinogenesis. 2019;40:1021–1030. doi: 10.1093/carcin/bgy157. [DOI] [PubMed] [Google Scholar]
- 51.Huang Z, Shi J, Gao Y, Cui C, Zhang S, Li J, et al. HMDD v3.0: a database for experimentally supported human microRNA-disease associations. Nucleic Acids Res. 2019;47:D1013–D1017. doi: 10.1093/nar/gky1010. [DOI] [PMC free article] [PubMed] [Google Scholar]
- 52.Scheibner KA, Teaboldt B, Hauer MC, Chen X, Cherukuri S, Guo Y, et al. MiR-27a functions as a tumor suppressor in acute leukemia by regulating 14-3-3θ. PLoS One. 2012;7:e50895. doi: 10.1371/journal.pone.0050895. [DOI] [PMC free article] [PubMed] [Google Scholar]
- 53.Akinsheye I, Alsultan A, Solovieff N, Ngo D, Baldwin CT, Sebastiani P, et al. Fetal hemoglobin in sickle cell anemia. Blood. 2011;118:19–27. doi: 10.1182/blood-2011-03-325258. [DOI] [PMC free article] [PubMed] [Google Scholar]
- 54.Galanello R, Origa R. Beta-thalassemia. Orphanet J Rare Dis. 2010;5:11. doi: 10.1186/1750-1172-5-11. [DOI] [PMC free article] [PubMed] [Google Scholar]
- 55.Poyart C, Wajcman H. Hemolytic anemias due to hemoglobinopathies. Mol Asp Med. 1996;17:129–142. doi: 10.1016/0098-2997(96)88344-0. [DOI] [PubMed] [Google Scholar]
- 56.Wang J, Li Q, Wang C, Xiong Q, Lin Y, Sun Q, et al. Knock-down of CIAPIN1 sensitizes K562 chronic myeloid leukemia cells to Imatinib by regulation of cell cycle and apoptosis-associated members via NF-κB and ERK5 signaling pathway. Biochem Pharmacol. 2016;99:132–145. doi: 10.1016/j.bcp.2015.12.002. [DOI] [PubMed] [Google Scholar]
- 57.Chorzalska A, Ahsan N, Rao RSP, Roder K, Yu X, Morgan J, et al. Overexpression of Tpl2 is linked to imatinib resistance and activation of MEK-ERK and NF-κB pathways in a model of chronic myeloid leukemia. Mol Oncol. 2018;12(5):630–647. doi: 10.1002/1878-0261.12186. [DOI] [PMC free article] [PubMed] [Google Scholar]
- 58.Shen MY, Wang Y, Cui SY, Wu XL, Guo Y, Xu RR. MicroRNA-125a regulates proliferation and apoptosis of acute myeloid leukemia through targeting NF-κB pathway. Eur Rev Med Pharmacol Sci. 2019;23(9):3594–3601. doi: 10.26355/eurrev_201905_17781. [DOI] [PubMed] [Google Scholar]
- 59.Fisher DAC, Malkova O, Engle EK, Miner CA, Fulbright MC, Behbehani GK, et al. Mass cytometry analysis reveals hyperactive NF Kappa B signaling in myelofibrosis and secondary acute myeloid leukemia. Leukemia. 2017;31(9):1962–1974. doi: 10.1038/leu.2016.377. [DOI] [PMC free article] [PubMed] [Google Scholar]
- 60.Abdelhamed S, Butler JT, Doron B, Halse A, Nemecek E, Wilmarth PA, et al. Extracellular vesicles impose quiescence on residual hematopoietic stem cells in the leukemic niche. EMBO Rep. 2019;20:e47546. doi: 10.15252/embr.201847546. [DOI] [PMC free article] [PubMed] [Google Scholar]
- 61.Luo M, Zhang Q, Xia M, Hu F, Ma Z, Chen Z, et al. Differential co-expression and regulatory network analysis uncover the relapse factor and mechanism of T cell acute leukemia. Mol Ther Nucleic Acids. 2018;12:184–194. doi: 10.1016/j.omtn.2018.05.003. [DOI] [PMC free article] [PubMed] [Google Scholar]
- 62.Lu L, Li H, Chen X, Xiong W, Huang S. The chromosome open reading frame genes targeted by abnormal micrornas in microvesicles from chronic myeloid leukemia. Blood. 2014;124:5509. [Google Scholar]
- 63.Amr KS, Elmawgoud Atia HA, Elazeem Elbnhawy RA, Ezzat WM. Early diagnostic evaluation of miR-122 and miR-224 as biomarkers for hepatocellular carcinoma. Genes Dis. 2017;4:215–221. doi: 10.1016/j.gendis.2017.10.003. [DOI] [PMC free article] [PubMed] [Google Scholar]
- 64.Chatterjee D, Bandyopadhyay A, Sarma N, Basu S, Roychowdhury T, Roy SS, et al. Role of microRNAs in senescence and its contribution to peripheral neuropathy in the arsenic exposed population of West Bengal, India. Environ Pollut. 2018;233:596–603. doi: 10.1016/j.envpol.2017.09.063. [DOI] [PubMed] [Google Scholar]
- 65.Mosakhani N, Missiry ME, Vakkila E, Knuutila S, Vakkila J. Low expression of miR-18a as a characteristic of pediatric acute lymphoblastic leukemia. J Pediatr Hematol Oncol. 2017;39:585–588. doi: 10.1097/MPH.0000000000000921. [DOI] [PubMed] [Google Scholar]
- 66.Bräuer-Hartmann D, Hartmann JU, Wurm AA, Gerloff D, Katzerke C, Verga Falzacappa MV, et al. PML/RARα-Regulated miR-181a/b Cluster Targets the Tumor Suppressor RASSF1A in Acute Promyelocytic Leukemia. Cancer Res. 2015;75:3411–3424. doi: 10.1158/0008-5472.CAN-14-3521. [DOI] [PMC free article] [PubMed] [Google Scholar]
- 67.Fang L, Gao Y, Lan M, Jiang P, Bai J, Li Y, et al. Hydroquinone inhibits PRV infection in neurons in vitro and in vivo. Vet Microbiol. 2020;250:108864. doi: 10.1016/j.vetmic.2020.108864. [DOI] [PubMed] [Google Scholar]
- 68.Park JH, Park CW, Ahn JH, Choi SY, Shin MC, Cho JH, et al. Neuroprotection and reduced gliosis by pre- and post-treatments of hydroquinone in a gerbil model of transient cerebral ischemia. Chem Biol Interact. 2017;278:230–238. doi: 10.1016/j.cbi.2017.01.018. [DOI] [PubMed] [Google Scholar]
Associated Data
This section collects any data citations, data availability statements, or supplementary materials included in this article.
Supplementary Materials
Additional file 1: Supplementary Figure 1. HQ-regulated DEGs of K562 cells in the Wnt signaling pathway. The Wnt signaling pathway was downloaded from the KEGG database (https://www.kegg.jp/kegg-bin/show_pathway?map04310). In K562 cells, HQ-upregulated DEGs were colored pink and HQ-downregulated DEGs were colored green. Supplementary Figure 2. HQ-regulated DEGs of K562 cells in chronic myeloid leukemia pathway. The chronic myeloid leukemia pathway was downloaded from the KEGG database (https://www.kegg.jp/kegg-bin/show_pathway?map05220). In K562 cells, HQ-upregulated DEGs were colored pink and HQ-downregulated DEGs were colored green. Supplementary Figure 3. HQ-regulated DEGs of K562 cells in acute myeloid leukemia pathway. The acute myeloid leukemia pathway was downloaded from the KEGG database (https://www.kegg.jp/kegg-bin/show_pathway?map05221). In K562 cells, HQ-upregulated DEGs were colored pink and HQ-downregulated DEGs were colored green. Supplementary Figure 4. HQ-regulated DEGs of K562 cells in hematopoietic cell lineage pathway. The hematopoietic cell lineage pathway was downloaded from the KEGG database (https://www.kegg.jp/kegg-bin/show_pathway?map04640). In K562 cells, HQ-upregulated DEGs were colored pink and HQ-downregulated DEGs were colored green. Supplementary Figure 5. HQ-regulated DEGs of K562 cells in human T-cell leukemia virus 1 infection pathway. The human T-cell leukemia virus 1 infection pathway was downloaded from the KEGG database (https://www.kegg.jp/kegg-bin/show_pathway?map05166). In K562 cells, HQ-upregulated DEGs were colored pink and HQ-downregulated DEGs were colored green.
Data Availability Statement
The datasets used and/or analyzed during the current study are available from the corresponding author on reasonable request.