

Abstract
At present, there have only been a few DNA sequencing-based studies to explore the genetic determinants of bone mineral density (BMD). We carried out the largest whole genome sequencing analysis to date for femoral neck and spine BMD (n = 4981), with one of the highest average sequencing depths implemented thus far at 22×, in a multiethnic sample (58% Caucasian and 42% African American) from the Louisiana Osteoporosis Study (LOS). The LOS samples were combined with summary statistics from the GEFOS consortium and several independent samples of various ethnicities to perform GWAS meta-analysis (n = 44 506). We identified 31 and 30 genomic risk loci for femoral neck and spine BMD, respectively. The findings substantiate many previously reported susceptibility loci (e.g. WNT16 and ESR1) and reveal several others that are either novel or have not been widely replicated in GWAS for BMD, including two for femoral neck (IGF2 and ZNF423) and one for spine (SIPA1). Although we were not able to uncover ethnicity specific differences in the genetic determinants of BMD, we did identify several loci which demonstrated sex-specific associations, including two for women (PDE4D and PIGN) and three for men (TRAF3IP2, NFIB and LYSMD4). Gene-based rare variant association testing detected MAML2, a regulator of the Notch signaling pathway, which has not previously been suggested, for association with spine BMD. The findings provide novel insights into the pathophysiological mechanisms of osteoporosis.
Introduction
Osteoporosis is a progressive age-related condition associated with reduced bone mineral density (BMD) and increased susceptibility to low trauma fractures. It represents the most prevalent metabolic bone disease affecting >200 million people worldwide, and significant sex/ethnic differences exist in its risk (1). It is estimated that at least one in three women and one in five men over the age of 50 will experience osteoporotic fractures in their remaining lifetime, and the incidence is expected to increase as the global population continues to age. BMD is influenced by both lifestyle (e.g. exercise, nutrition and aging) and genetic factors, which are estimated to account for 50%–80% of the total phenotypic variability (2).
A delicate balance of bone formation/resorption is critical for maintaining bone health during aging, and bone metabolism involves specialized cell types such as osteoblasts, osteocytes and osteoclasts (3). Osteoblasts, derived from the bone marrow mesenchymal stem cells (MSCs), are bone building cells which play a crucial role in the mineralization of the bone matrix. The MSCs can also differentiate into adipocytes and chondrocytes, which are the main components of adipose tissue and cartilage, respectively. Osteoclasts, derived from hematopoietic progenitors in the bone marrow which also give rise to monocytes in the peripheral blood, are primarily involved in bone resorption processes. Osteocytes, which are differentiated from osteoblasts and constitute most of the cells in the cortical bone, form a communication network to regulate the skeletal remodeling activities of osteoblasts and osteoclasts.
Dual-energy X-ray absorptiometry (DXA) derived BMD measurements of the femoral neck (FNK) and lumbar spine (SPN) are the most widely used metric for clinically diagnosing osteoporosis, as well as the most powerful known risk factor for predicting fracture risk (4). Since DXA machines are costly and not always available, quantitative ultrasound of the calcaneus is sometimes used to provide an estimated BMD (eBMD) measurement, although DXA remains the gold standard. The largest yield in discoveries of genetic loci associated with BMD phenotypes has been facilitated by the rise of large consortia such as GEnetic Factors for OSteoporosis (GEFOS) (5,6) and the UK Biobank (7). Genome-wide association studies (GWASs) have identified >100 loci associated with DXA BMD and >500 loci associated with eBMD, but these loci collectively explain only a small proportion (<10% and <20%, respectively) of the total trait heritability (8). Although the enormous sample size of the UK Biobank has identified most DXA loci to also be associated with eBMD, the phenotypic and genetic correlations between these traits were reported to be 0.5 and 0.64, respectively (9). Although the genetic correlation is rather strong, eBMD is not a perfect surrogate, and genetic association studies for DXA BMD are still valuable and necessary.
The majority of GWAS studies for BMD have focused on common variants (minor allele frequency, MAF > 5%), while ignoring the effects of low frequency and rare variants. At the present time, there have only been a few DNA sequencing-based studies to investigate the genetic determinants of BMD. The GEFOS consortium used a whole genome sequencing (WGS) design to identify a low frequency noncoding variant with a large effect size near a novel locus EN1 (6), whereas another study in Icelandic subjects detected a rare coding variant that disrupts the function of LGR4 (10). Although these earlier WGS studies made substantial contributions, they were conducted only in Caucasians and with low/moderate sequencing depth (7× and 10×, respectively). The sequencing depth is defined as the average number of times a nucleotide in the genome has been sequenced, and higher sequencing depth generally indicates higher confidence for variant discovery and thus for subsequent association findings. Recently, a WGS study for total body BMD using a sequencing depth of 30× was conducted by the Qatar Biobank, although the effects of rare variants were not taken into consideration (11).
We carried out the largest WGS analysis in the bone field to date, with one of the highest sequencing depths implemented thus far, in a multiethnic sample composed of both Caucasian and African American subjects from the Louisiana Osteoporosis Study (LOS). The WGS samples were combined with the GWAS summary statistics provided by GEFOS as well as several other available GWAS datasets using meta-analysis, and the BMD associated loci were prioritized based on their functional consequences, statistical fine mapping and transcriptome-wide association analysis (TWAS). Additionally, gene-based analyses were conducted to test the joint effects of the rare variants located within each gene region. This study aims to propose novel genetic determinants of BMD, and to offer new insights into the functional mechanisms of osteoporosis. An overview of the study workflow is provided in Figure 1.
Figure 1.
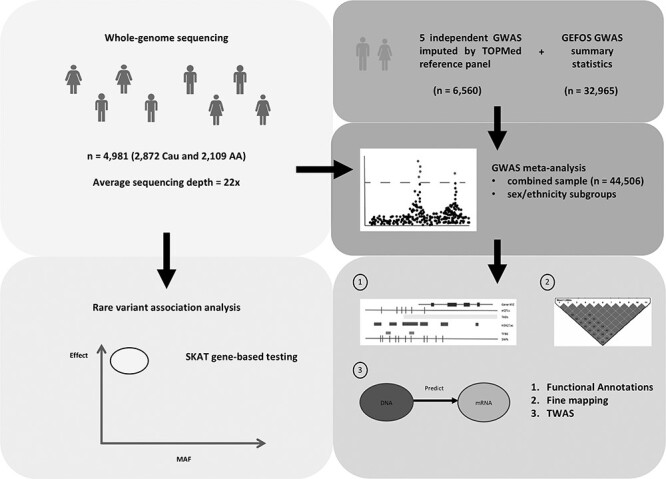
Overview of study workflow. WGS was conducted in a multiethnic sample of Caucasians and African Americans. The WGS samples were integrated with several other independent GWAS samples, which were imputed by the TOPMed reference panel, and the GWAS summary statistics provided by the GEFOS consortium to perform meta-analysis. The variants at each genomic risk locus were prioritized based on their overlap with various functional annotations, fine mapping and TWAS. Gene-based SKAT was applied to test the joint effects of the rare variants within each gene region using the WGS samples.
Results
WGS analysis
The LOS WGS sample includes 4981 subjects (2872 Caucasian and 2109 African American) with an average age of 39.2 (SD = 11.2). The proportion of males and females was equally balanced both in the full sample as well as ethnicity subgroups. The average sequencing depth was 22× on the whole genome excluding gap regions. On average, per sequencing individual, 99.0% of the whole genome excluding gap regions was covered by a depth of at least 1×, 97.6% had at least 4× and 92.3% had at least 10×. After the quality control for GWAS, there were an average of 3.7 million variants per subject and the average call rate was 99.9%.
GWAS meta-analysis
GWAS meta-analysis was performed for 15.5 million SNPs in the combined sample (n = 44 506), as well as for sex and ethnicity specific subgroups (Table 1). The genomic inflation factors for each individual GWAS were between  = 0.99–1.03, indicating that there are minimal confounding effects from population structure after adjusting for the ancestry principal components. Although we incorporated several samples of African American and Chinese subjects, we note that the combined meta-analysis was still nearly 90% Caucasian. In the combined sample, we identified 31 and 30 genomic risk loci for FNK BMD and SPN BMD, respectively (Figure 2, Tables 2 and 3). Among these risk loci, there were 32 genome-wide significant variants for FNK BMD and 35 for SPN BMD that were conditionally independent associations (Supplementary Material, Tables S1 and S2). In the female analysis, we detected 15 loci for FNK BMD and 27 for SPN BMD (Supplementary Material, Tables S3 and S4), whereas in the male analysis we identified 7 loci for FNK BMD and 6 for SPN BMD (Supplementary Material, Tables S5 and S6). There were no genome-wide significant results in the African American and Chinese analyses, which had relatively small sample sizes and were not sufficiently powered for ethnic comparisons.
Table 1.
Study-specific descriptive statistics
| N | Female | Age | Weight | SPN | FNK | |
|---|---|---|---|---|---|---|
| Combined | ||||||
| LOS-CAU | 2872 | 53% | 38.9 (12.3) | 76.2 (18.2) | 1.02 (0.13) | 0.83 (0.14) |
| LOS-AA | 2109 | 47% | 39.6 (9.5) | 84.6 (21.5) | 1.10 (0.15) | 0.93 (0.15) |
| OOS | 987 | 50% | 50.3 (18.3) | 80.1 (17.7) | 1.03 (0.16) | 0.81 (0.14) |
| KCOS | 2283 | 76% | 51.4 (13.8) | 75.2 (17.4) | 1.02 (0.16) | 0.80 (0.15) |
| COS | 1558 | 51% | 34.8 (13.4) | 60.3 (10.5) | 0.95 (0.13) | 0.81 (0.13) |
| CMMS | 500 | 100% | 52.8 (2.9) | 57.3 (7.7) | 1.05 (0.16) | 0.86 (0.12) |
| WHI-AA | 839 | 100% | 60.9 (6.9) | 83.2 (17.7) | 1.05 (0.17) | 0.83 (0.14) |
| WHI-HIS | 393 | 100% | 60.7 (7.2) | 73.9 (15.6) | 0.97 (0.16) | 0.73 (0.12) |
| GEFOS (2015) | 32 965 | 65% | 66.6 (11.2) | 84.3 (13.3) | 1.09 (0.18) | 0.86 (0.14) |
| Male | ||||||
| LOS-CAU | 1356 | - | 36.7 (8.9) | 83.3 (16.2) | 1.04 (0.14) | 0.87 (0.21) |
| LOS-AA | 1123 | - | 40.3 (9.3) | 84.5 (20.5) | 1.10 (0.16) | 0.96 (0.24) |
| OOS | 494 | - | 50.3 (18.9) | 88.9 (14.8) | 1.07 (0.17) | 0.85 (0.15) |
| KCOS | 561 | - | 50.8 (16.1) | 87.0 (16.8) | 1.07 (0.15) | 0.85 (0.15) |
| COS | 768 | - | 31.5 (12.1) | 65.9 (9.7) | 0.98 (0.12) | 0.87 (0.14) |
| GEFOS (2012) | 9971 | - | 59.4 (9.2) | 81.6 (12.7) | 1.17 (0.20) | 0.94 (0.11) |
| Female | ||||||
| LOS-CAU | 1516 | - | 40.9 (14.4) | 69.9 (17.6) | 1.01 (0.16) | 0.80 (0.20) |
| LOS-AA | 986 | - | 38.9 (10.7) | 84.7 (22.6) | 1.10 (0.15) | 0.90 (0.15) |
| OOS | 493 | - | 50.3 (17.7) | 71.4 (16.0) | 0.99 (0.15) | 0.78 (0.13) |
| KCOS | 1722 | - | 51.6 (12.9) | 71.5 (16.0) | 1.01 (0.16) | 0.78 (0.15) |
| COS | 790 | - | 37.8 (13.9) | 54.8 (8.2) | 0.92 (0.13) | 0.76 (0.11) |
| CMMS | 500 | - | 52.8 (2.9) | 57.3 (7.7) | 1.05 (0.16) | 0.86 (0.12) |
| WHI-AA | 839 | - | 60.9 (6.9) | 83.2 (17.7) | 1.05 (0.17) | 0.83 (0.14) |
| WHI-HIS | 393 | - | 60.7 (7.2) | 73.9 (15.6) | 0.97 (0.16) | 0.73 (0.12) |
| GEFOS (2012) | 22 993 | - | 59.1 (11.4) | 69.4 (13.3) | 1.01 (0.19) | 0.78 (0.12) |
Notes: Data are presented as mean (SD). Weight is measured in kg and BMD is measured as g/cm2. Abbreviations: LOS-CAU, Louisiana osteoporosis study Caucasian sample; LOS-AA, Louisiana osteoporosis study African American sample; OOS, Omaha osteoporosis study; KCOS, Kansas city osteoporosis study; COS, China osteoporosis study; CMMS, China metagenomics and metabolomics study; WHI-AA, Women’s health initiative African American sample; WHI-HIS, Women’s health initiative Hispanic sample.
Figure 2.
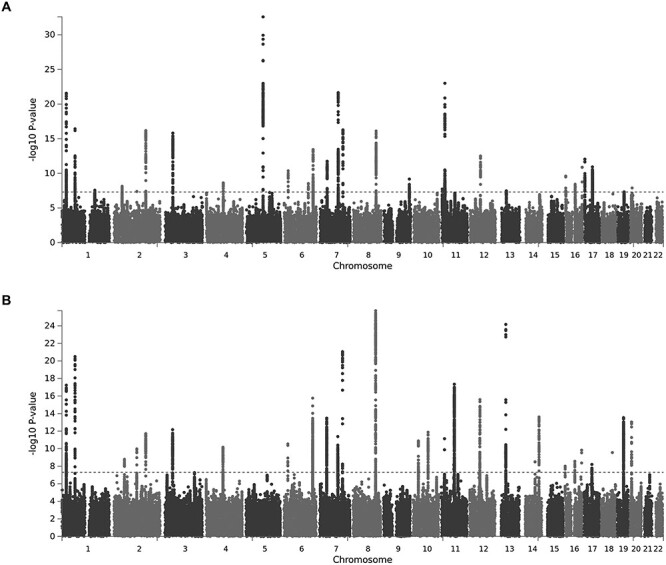
Manhattan plots illustrating GWAS association signals in the combined sample for (A) FNK BMD and (B) SPN BMD. The x-axis denotes chromosome, the y-axis represents the −log10 P-value, and the red horizontal line corresponds to the threshold for genome-wide significance.
Table 2.
Genomic risk loci for FNK BMD in combined sample
| Chr | Location (hg19) | Top SNP | Top P-value | Genes |
|---|---|---|---|---|
| 1 | 22 657 120–22 735 906 | rs7524102 | 2.7e−22 | MIR4418, ZBTB40 |
| 1 | 68 587 768–68 665 023 | rs2566752 | 3.7e−17 | WLS |
| 1 | 172 188 348–172 300 345 | rs12737669 | 2.7e−8 | DNM3 |
| 2 | 42 215 902–42 306 205 | rs10203720 | 7.4e−9 | PKDCC, LOC102723824 |
| 2 | 119 529 829–119 529 829 | rs55983207 | 4.1e−8 | LOC101927709, EN1 |
| 2 | 166 424 558–166 650 422 | rs6726821 | 6.7e−17 | CSRNP3, GALNT3 |
| 3 | 41 072 355–41 198 050 | rs391459 | 1.5e−16 | ZNF621, CTNNB1 |
| 4 | 88 701 522–88 868 189 | rs12505482 | 2.3e−9 | IBSP, MEPE, SPP1 |
| 5 | 88 226 422–88 430 633 | rs1366594 | 1.1e−30 | MEF2C-AS1 |
| 6 | 21 372 975–21 397 034 | rs9466056 | 4.3e−11 | CDKAL1, LINC00581 |
| 6 | 126 883 880–127 167 072 | rs13204965 | 3.0e−9 | MIR588, RSPO3 |
| 6 | 151 847 381–152 095 987 | rs9478217 | 3.7e−14 | CCDC170, ESR1 |
| 7 | 38 029 944–38 157 511 | rs4281029 | 1.8e−12 | EPDR1, STARD3NL |
| 7 | 96 077 048–96 371 732 | rs10808100 | 2.2e−22 | SEM1 |
| 7 | 120 954 908–121 040 782 | rs2536185 | 5.3e−17 | CPED1, WNT16, FAM3C |
| 8 | 119 882 287–120 063 542 | rs13264172 | 7.7e−17 | TNFRSF11B, COLEC10 |
| 9 | 133 423 184–133 522 025 | rs9657746 | 6.7e−10 | ASS1, LOC100272217, FUBP3 |
| 11 | 2 116 492–2 153 634 | rs7111145 | 1.0e−9 | H19, IGF2 |
| 11 | 15 630 472–15 741 475 | rs7108738 | 9.8e−24 | LOC102724957 |
| 11 | 16 484 699–16 805 226 | rs11024028 | 4.8e−11 | SOX6 |
| 12 | 54 385 599–54 443 741 | rs4759320 | 3.1e−13 | MIR196A2, HOXC4, HOXC5, HOXC6 |
| 13 | 42 949 052–43 088 407 | rs34110009 | 3.4e−8 | AKAP11, LINC02341 |
| 16 | 364 128–418 429 | rs8047501 | 2.5e−10 | AXIN1 |
| 16 | 1 524 261–1 533 554 | rs13336428 | 3.9e−8 | CLCN7, PTX4 |
| 16 | 49 848 827–49 878 979 | rs2047937 | 3.8e−9 | ZNF423 |
| 16 | 51 021 803–51 025 468 | rs62028332 | 9.2e−9 | MIR548AI |
| 16 | 86 706 435–86 714 715 | rs71390846 | 1.3e−11 | FOXL1, LINC02189 |
| 17 | 1 945 201–2 206 114 | rs8072532 | 9.0e−13 | SMG6 |
| 17 | 41 773 814–42 306 838 | rs4793018 | 1.2e−11 | MEOX1, SOST, CFAP97D1, MPP3, NAGS, TMEM101, LSM12, HDAC5, LOC105371789, C17orf53, ASB16, ASB16-AS1, TMUB2, ATXN7L3, UBTF |
| 19 | 33 536 571–33 624 096 | rs12460195 | 4.8e−8 | RHPN2, GPATCH1 |
| 20 | 10 638 386–10 644 158 | rs2235811 | 1.3e−8 | JAG1 |
Table 3.
Genomic risk loci for SPN BMD in combined sample
| Chr | Location (hg19) | Top SNP | Top P-value | Genes |
|---|---|---|---|---|
| 1 | 22 537 920–22 735 906 | rs7524102 | 5.8e−18 | WNT4, MIR4418, ZBTB40 |
| 1 | 68 593 243–68 665 023 | rs2566752 | 3.2e−21 | WLS |
| 2 | 54 617 504–54 684 666 | rs7607093 | 1.6e−9 | C2orf73, SPTBN1 |
| 2 | 119 507 607–119 579 901 | rs11692564 | 1.0e−10 | LOC101927709, EN1 |
| 2 | 166 535 918–166 640 575 | rs1895701 | 1.9e−12 | CSRNP3, GALNT3 |
| 3 | 41 072 355–41 198 050 | rs62260279 | 6.7e−13 | ZNF621, CTNNB1 |
| 4 | 88 738 578–88 859 131 | rs11934731 | 6.8e−11 | MEPE, SPP1 |
| 6 | 21 372 975–21 391 282 | rs9466056 | 2.9e−11 | CDKAL1, LINC00581 |
| 6 | 151 847 381–152 092 638 | rs1023940 | 1.7e−16 | CCDC170, ESR1 |
| 7 | 37 938 422–38 157 511 | rs2177470 | 3.3e−14 | NME8, SFRP4, EPDR1, STARD3NL |
| 7 | 96 117 918–96 429 251 | rs6965122 | 4.1e−12 | SEM1 |
| 7 | 120 954 908–121 040 782 | rs7807953 | 8.9e−22 | CPED1, WNT16, FAM3C |
| 8 | 119 822 573–120 063 542 | rs4335155 | 1.9e−26 | TNFRSF11B, COLEC10 |
| 10 | 28 422 981–28 501 117 | rs3847382 | 1.3e−11 | MPP7 |
| 10 | 79 393 332–79 467 467 | rs11002249 | 1.3e−12 | KCNMA1, DLG5 |
| 11 | 16 593 142–16 756 873 | rs11024028 | 7.3e−12 | SOX6 |
| 11 | 65 380 124–65 473 798 | rs10750766 | 7.0e−9 | SIPA1, RELA, KAT5 |
| 11 | 68 143 719–68 451 973 | rs2291467 | 5.0e−18 | LRP5, PPP6R3, GAL |
| 12 | 53 630 558–53 752 204 | rs2272313 | 2.2e−12 | MFSD5, ESPL1, AAAS, SP7 |
| 12 | 54 385 599–54 443 741 | rs12319419 | 2.6e−16 | MIR196A2, HOXC4, HOXC5, HOXC6 |
| 13 | 42 913 933–43 200 103 | rs8001611 | 6.9e−25 | AKAP11, LINC02341, TNFSF11 |
| 14 | 70 456 699–70 477 022 | rs1471243 | 3.0e−9 | SMOC1 |
| 14 | 91 354 924–91 542 088 | rs1286063 | 2.4e−14 | RPS6KA5 |
| 16 | 364 128–418 429 | rs9921222 | 9.9e−9 | AXIN1 |
| 16 | 50 929 954–51 007 792 | rs6500348 | 2.7e−9 | MIR548AI |
| 16 | 86 706 435–86 714 715 | rs71390846 | 1.5e−10 | FOXL1, LINC02189 |
| 17 | 41 773 814–41 930 241 | rs1828720 | 6.3e−9 | MEOX1, SOST, CFAP97D1, MPP3 |
| 18 | 60 054 857–60 054 857 | rs884205 | 2.8e−10 | TNFRSF11A |
| 19 | 33 504 997–33 628 438 | rs8106453 | 2.9e−14 | RHPN2, GPATCH1 |
| 20 | 10 634 658–10 669 188 | rs2235811 | 9.2e−14 | JAG1 |
Among the genome-wide significant SNPs in the combined sample, we observed that 54% of the variants identified for FNK BMD were also associated with SPN BMD, whereas 37% of the SNPs detected for SPN BMD were shared with FNK BMD. This is consistent with previous reports which assert that there are site-specific differences in the genetic determinants of BMD (12). A Venn diagram was used to illustrate the number of SNPs that were either shared or specific to each trait in each subgroup (Supplementary Material, Fig. S1). Approximately 10% of the trait-associated SNPs demonstrated heterogeneity in the allelic effects between studies and were therefore analyzed using the random effect model. We observed that >95% of the identified SNPs have MAF >10%, and the variant effect sizes were inversely proportional to the MAF (Supplementary Material, Fig. S2).
The combined meta-analysis revealed several genomic risk loci that were not significant in the GEFOS summary statistics alone, including two for FNK BMD (IGF2 and ZNF423) and one for SPN BMD (SIPA1). In the female analysis for FNK BMD, we identified PDE4D (rs153949, P-value = 5.1e−9), whereas in the female analysis for SPN BMD, we detected PIGN (rs1942989, P-value = 4.8e−8). In the male analysis for FNK BMD, we identified TRAF3IP2 (rs80250323, P-value = 4.8e−8) and NFIB (rs7036184, P-value = 1.5e−8), whereas in the male analysis for SPN BMD, we detected LYSMD4 (rs28602271, P-value = 1.4e−8). The novel SNP located at TRAF3IP2 is a low frequency variant (MAF = 1.5%,  = −0.63) with an effect size 7-fold larger than the average effect size of all the other genome-wide significant SNPs in the male analysis.
Tissue expression profiles of BMD associated genes
Among the genes containing BMD associated variants, 14 (EPDR1, ESR1, GALNT3, H19, HOXC4, HOXC5, HOXC6, IBSP, IGF2, SFRP4, SMOC1, SPP1, TNFRSF11B and ZNF423) were determined to be preferentially expressed in osteoblasts compared with other cell types based on the ENCODE RNA-seq data (Supplementary Material, Table S7). The median expression ratio for these genes comparing the reads per kilobase million (RPKM) in osteoblasts with the median of the 11 other cell types was 6.1. These findings were supported using mouse expression microarray profiles to demonstrate that many of these genes are at least moderately expressed in osteoblasts (Supplementary Material, Fig. S3).
Functional characteristics of BMD associated variants
Since >95% of the BMD associated SNPs reside in intergenic or intronic regions (Supplementary Material, Fig. S4), we prioritized SNPs for their functional importance by assessing their overlap with various epigenomic features that are associated with active and open chromatin. A Venn diagram was used to visualize the number of trait-associated SNPs overlapping each combination of regulatory elements for both BMD phenotypes (Supplementary Material, Fig. S5). In the pooled meta-analysis, we observed that 6% of SNPs for FNK BMD and 8% for SPN BMD overlap enhancer/promoter chromatin in osteoblasts, whereas 8.5% of SNPs for FNK BMD and 7% for SPN BMD overlap H3K27ac in osteoblasts, and 5% of SNPs for FNK BMD and 4% for SPN BMD overlap DHS in osteoblasts. The BMD associated SNPs were significantly enriched (P-values < 0.001) in these epigenomic features compared with all other SNPs included in the meta-analysis. The genes containing regulatory SNPs that overlap enhancer/promoter chromatin, H3K27ac, and/or DHS in osteoblasts were enriched in the following GO terms (false discovery rate; FDR < 0.05); regulation of Wnt signaling pathway (GO:0030111), skeletal system morphogenesis (GO:0048705), and positive regulation of bone resorption (GO:0045780).
Interestingly, only 2 BMD associated SNPs were observed to be significant eQTLs in osteoclasts—rs7193109 and rs3848369, both located at AXIN1, were reported to be significantly associated with the expression level of TMEM8A (FDR < 0.05), which was previously found to be differentially expressed between individuals with high/low BMD using microarray data from peripheral blood monocyte cells (13). Among other tissues in GTEx, 16% of SNPs for FNK BMD and 12% for SPN BMD were reported to be significant eQTLs in subcutaneous adipose tissue, 9% of SNPs for FNK BMD and 5% for SPN BMD were reported to be significant eQTLs in visceral adipose tissue, and 17% of SNPs for FNK BMD and 11% for SPN BMD were reported to be significant eQTLs in skeletal muscle. We observed that 10% of SNPs for FNK BMD and 7% for SPN BMD overlap a TFBS for at least one transcription factor based on the ENCODE ChIP-seq data. The FNK SNPs most frequently overlapped TFBS for POLR2A (3.7%), CTCF (2.7%), CEBPB (1.9%), MYC (1.8%) and MAX (1.7%), whereas the SPN BMD SNPs most frequently overlapped TFBS for POLR2A (4.3%), CTCF (3.1%), FOS (1.7%), RAD21 (1.7%) and MAFK (1.5%). Many of the BMD risk loci also overlap topologically associating domains (Supplementary Material, Tables S8 and S9). For instance, the novel loci LYSMD4 in men (Fig. 3A) and PIGN in women (Fig. 3B) are involved in various chromatin interactions that may potentially play a role in bone metabolic processes.
Figure 3.
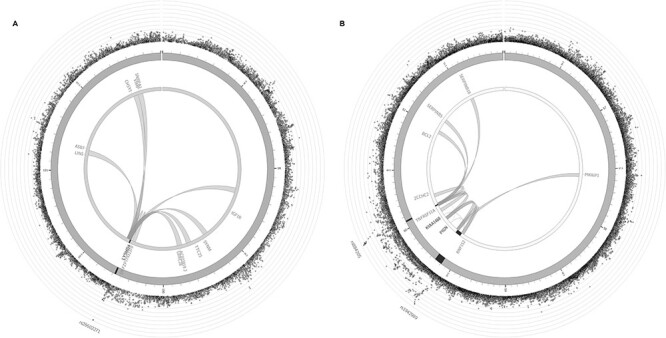
Chromatin interaction mapping in MSCs for (a) LYSMD4 risk locus, and (b) PIGN and TNFRSF11A risk loci. The most outer layer shows a Manhattan plot for the SNPs at each locus. The second layer represents the chromosome ring, with genomic risk loci highlighted in dark gray. The links illustrate the long-range chromatin interactions involving each risk locus.
Functional consequences of nonsynonymous variants
There were 29 exonic variants detected for either FNK or SPN BMD in the pooled analysis, including 10 that are synonymous and 19 that are nonsynonymous (Supplementary Material, Table S10). Several of these variants located at IBSP (rs1054629), SMG6 (rs216195 and rs216196), RHPN2 (rs28626308) and GPATCH1 (rs7259333, rs2287679, rs10416265 and rs6510356) were not detected in the GEFOS summary statistics. The nonsynonymous SNP located at RHPN2, which has amino acid change R70Q, is predicted to be deleterious/damaging based on SIFT (score = 0.011), PolyPhen-2 (score = 0.99) and CADD (score = 24). Variants with CADD score > 20 are amongst the top 1% of deleterious variants in the human genome. Based on MutPred2, the potential mechanisms of pathogenicity for this amino acid change include altered coil (P-value = 0.01), gain of strand (P-value = 0.01) and loss of helix (P-value = 0.04). Additionally, MutPred2 indicated that this amino acid change alters the mitogen activated protein kinase (MAPK) docking motif (ELME000233) of MAPK interacting molecules (e.g. MAPKs, substrates, phosphatases), and signaling mediated by MAPKs is critical for normal osteoblast and osteoclast differentiation/function (14). The nonsynonymous SNP at RHPN2 was previously detected for eBMD (7), but not in GWAS studies for DXA BMD.
Fine mapping
The statistical fine-mapping analysis for the pooled sample was able to distinguish a single causal variant with high probability of causality (posterior probability; PP > 0.5) at 10 and 11 genomic risk loci for FNK BMD and SPN BMD, respectively (Tables 4 and 5). Several potential causal variants were located at novel loci including rs7111145 (IGF2), rs34290737 (ZNF423) and rs2306363 (SIPA1). Among the annotations considered in the model, DHS and H3K27ac in osteoblasts were statistically significant (P-values < 0.05), and therefore variants that overlap these functional elements were assigned larger prior probabilities of causality than the baseline prior probability assigned to all other SNPs (Supplementary Material, Table S11).
Table 4.
High-confidence causal variants for FNK
| CHR | Gene | SNP | P-value | PP | Annotations |
|---|---|---|---|---|---|
| 11 | H19; IGF2 | rs7111145 | 1.0e−9 | 0.99 | Intergenic |
| 11 | LOC102724957 | rs7108738 | 9.8e−24 | 0.99 | Intronic H3K27ac_ob DHS_ob TFBS—EGR1 |
| 16 | MIR548AI | rs62028332 | 9.2E−9 | 0.99 | ncRNA_intronic |
| 5 | MEF2C-AS1 | rs10037512 | 2.5e−33 | 0.99 | ncRNA_intronic |
| 1 | WLS | rs2566752 | 3.7e−17 | 0.98 | ncRNA_intronic |
| 16 | FOXL1; LINC02189 | rs10048146 | 1.4e−11 | 0.93 | Intergenic EnhPro_ob H3K27ac_ob |
| 6 | CDKAL1; LINC00581 | rs9466056 | 4.3e−11 | 0.78 | Intergenic H3K27ac_ob TFBS—FOXA1, CEBPB, HNF4G, STAT1, STAT3 |
| 11 | SOX6 | rs11024028 | 4.8e−11 | 0.70 | Intronic |
| 16 | ZNF423 | rs34290737 | 6.1e−9 | 0.65 | Intronic H3K27ac_ob |
| 2 | CSRNP3; GALNT3 | rs12185748 | 7.5e−17 | 0.53 | Intergenic EnhPro_ob H3K27ac_ob DHS_ob eQTL—subcutaneous adipose, skeletal muscle, uterus |
Notes: EnhPro_ob – enhancer/promoter chromatin in osteoblast; H3K27ac_ob – H3K27ac in osteoblast; DHS_ob – DHS in osteoblast.
Table 5.
High-confidence causal variants for SPN
| CHR | Gene | SNP | P-value | PP | Annotations |
|---|---|---|---|---|---|
| 6 | CCDC170 | rs1023940 | 1.7e−16 | 0.95 | Intronic |
| 11 | SOX6 | rs11024028 | 7.3e−12 | 0.93 | Intronic |
| 11 | SIPA1 | rs2306363 | 2.7e−8 | 0.93 | UTR5, H3K27ac_ob, DHS_ob TFBS—BCL3, CHD1, CHD2, E2F1, E2F4, E2F6, EGR1, ELF1, ETS1, FOS, FOXP2, HMGN3, IRF1, KDM5B, MAX, MAZ, MXI1, MYC, PHF8, POLR2A, RBBP5, RCOR1, REST, SIN3AK20, SMARCB1, SP1, TAF1, TBP, TFAP2C, YY1, ZBTB7A eQTL—subcutaneous adipose, visceral adipose, aorta, skeletal muscle |
| 16 | FOXL1; LINC02189 | rs71390846 | 1.5e−10 | 0.87 | Intergenic, EnhPro_ob, H3K27ac_ob, DHS_ob TFBS—FOS, JUN, POLR2A |
| 16 | AXIN1 | rs10794639 | 1.4e−8 | 0.73 | Intronic, EnhPro_ob, H3K27ac_ob, DHS_ob TFBS—CHD2, E2F1, ELF1, ELK4, ESR1, FOS, FOSL2, GABPA, GATA3, JUN, JUND, MAX, MYC, POLR2A, RELA, RFX5, RUNX3, SMARCB1, SMARCC1, SMARCC2, SMC3, STAT1, STAT3, TCF7L2, TFAP2C, USF2, EBF1, ZNF217 eQTL—subcutaneous adipose, aorta, skeletal muscle |
| 17 | MEOX1; SOST | rs1828720 | 6.3e−9 | 0.73 | Intergenic, EnhPro_ob, H3K27ac_ob, DHS_ob TFBS—ZNF143, eQTL—aorta |
| 8 | COLEC10 | rs2220189 | 8.0e−26 | 0.69 | Intronic, EnhPro_ob, DHS_ob, TFBS—CEBPB |
| 6 | CDKAL1; LINC00581 | rs9466056 | 2.9e−11 | 0.67 | Intergenic, H3K27ac_ob, TFBS—CEBPB, EP300, FOXA1, HNF4G, STAT1, STAT3 |
| 10 | MPP7 | rs7088552 | 1.7e−11 | 0.63 | Intronic, H3K27ac_ob, DHS_ob |
| 20 | JAG1 | rs6040063 | 1.0e−13 | 0.60 | Intronic, EnhPro_ob, H3K27ac_ob, DHS_ob TFBS—POLR2A and ZBTB33 |
| 13 | AKAP11; LINC02341 | rs8001611 | 6.9e-25 | 0.53 | Intergenic eQTL—aorta |
Notes: EnhPro_ob – enhancer/promoter chromatin in osteoblast; H3K27ac_ob—H3K27ac in osteoblast; DHS_ob—DHS in osteoblast.
TWAS
The stratified LD score regression (LDSC) analysis indicated that the BMD heritability is enriched in several different GTEx tissues including coronary artery (FNK P-value = 0.02, SPN P-value = 7.0e−4), aorta (FNK P-value = 0.008, SPN P-value = 0.02), uterus (FNK P-value = 8.0e−4, SPN P-value = 0.004) and ovary (FNK P-value = 0.05, SPN P-value = 0.04). Interestingly, the heritability was not observed to be enriched in subcutaneous adipose tissue, visceral adipose tissue or skeletal muscle (P-values > 0.05). However, given the strong biological evidence for interactions among skeletal muscle, bone and fat (15), these tissues were combined with those identified by LDSC to perform multi-tissue TWAS analysis. There were 12 genes for FNK BMD (IBSP, GALNT3, HOXC4, LSM12, ASB16, PKDCC, HOXC6, SOST, NBR1, NTHL1, CCDC170 and SMAD5) and 16 genes for SPN BMD (PPP6R3, GAL, GPATCH1, HOXC4, HOXC6, SIPA1, GALNT3, IBSP, CBX5, CCDC170, RHPN2, C12orf10, SPP1, MAP3K12, CKAP5 and SMOC1) that were detected to have trait-associated expression levels (Table 6). Collectively, the genes identified by TWAS were enriched (FDR < 0.05) in several relevant GO terms including regulation of ossification (GO:0030278), negative regulation of BMP signaling pathway (GO:0030514), and regulation of bone mineralization (GO:0030500).
Table 6.
Genes with BMD associated expression levels identified by TWAS
| Gene | S-MultiXcan P-value | Number of tissues | Best tissue | Best tissue P-value | Trait |
|---|---|---|---|---|---|
| IBSP | 9.9e−10 | 1 | Skeletal muscle | 9.9e−10 | FNK |
| GALNT3 | 3.4e−9 | 5 | Uterus | 2.7e−9 | FNK |
| HOXC4 | 3.7e−9 | 2 | Skeletal muscle | 8.9e−10 | FNK |
| LSM12 | 6.6e−9 | 1 | Subcutaneous adipose | 6.6e−9 | FNK |
| ASB16 | 4.1e−8 | 3 | Skeletal muscle | 2.9e−9 | FNK |
| PKDCC | 4.6e−8 | 3 | Aorta | 2.4e−9 | FNK |
| HOXC6 | 3.1e−7 | 3 | Skeletal muscle | 2.2e−7 | FNK |
| SOST | 1.1e−6 | 2 | Aorta | 2.4e−7 | FNK |
| NBR1 | 1.2e−6 | 4 | Uterus | 6.7e−7 | FNK |
| NTHL1 | 1.4e−6 | 2 | Coronary artery | 1.1e−6 | FNK |
| CCDC170 | 1.5e−6 | 3 | Coronary artery | 2.6e−6 | FNK |
| SMAD5 | 1.7e−6 | 4 | Subcutaneous adipose | 7.9e−9 | FNK |
| PPP6R3 | 1.2e−16 | 1 | Ovary | 1.2e−16 | SPN |
| GAL | 4.0e−13 | 2 | Subcutaneous adipose | 5.5e−14 | SPN |
| GPATCH1 | 2.4e−10 | 5 | Subcutaneous adipose | 1.1e−10 | SPN |
| HOXC4 | 7.4e−10 | 2 | Skeletal muscle | 1.4e−10 | SPN |
| HOXC6 | 9.2e−10 | 3 | Skeletal muscle | 6.3e−9 | SPN |
| SIPA1 | 3.5e−9 | 3 | Subcutaneous adipose | 4.4e−9 | SPN |
| GALNT3 | 3.9e−8 | 5 | Uterus | 8.2e−9 | SPN |
| IBSP | 1.2e−7 | 1 | Skeletal muscle | 1.2e−7 | SPN |
| CBX5 | 1.5e−7 | 1 | Visceral adipose | 1.5e−7 | SPN |
| CCDC170 | 1.7e−7 | 3 | Coronary artery | 1.5e−7 | SPN |
| RHPN2 | 1.7e−7 | 6 | Subcutaneous adipose | 7.5e−11 | SPN |
| C12orf10 | 1.8e−7 | 1 | Aorta | 1.8e−7 | SPN |
| SPP1 | 2.9e−7 | 3 | Subcutaneous adipose | 5.2e−8 | SPN |
| MAP3K12 | 3.2e−7 | 2 | Subcutaneous adipose | 4.9e−8 | SPN |
| CKAP5 | 2.5e−6 | 2 | Skeletal muscle | 4.9e−7 | SPN |
| SMOC1 | 2.5e−6 | 3 | Aorta | 1.3e−7 | SPN |
Notes: Number of tissues refers to the number of tissues among the 7 considered in TWAS (subcutaneous adipose, visceral adipose, skeletal muscle, coronary artery, aorta, uterus, ovary) for which there are GWAS SNPs located at the given gene included in the gene expression prediction models acquired from PredictDB.
Rare variant analysis
In the SKAT rare variant meta-analysis of Caucasian and African American subjects, we identified MAML2 (P-value = 2.0e−9) to be associated with SPN BMD. On the other hand, MAML2 did not display any evidence for association with FNK BMD (P-value = 0.08). Although no other genes reached statistical significance in either the subgroup analyses or combined meta-analyses, there were several that were borderline significant including TTN (P-value = 3.4e−6) and BCL9 (P-value = 5.0e−6) in the male specific analysis for FNK BMD. Although we attempted to conduct the analysis with alternative rare variant selection criteria (e.g. high confidence loss of function and damaging missense variants), we did not detect any other genes reaching the stringent significance threshold.
Discussion
This study represents the first multiethnic WGS genetic association analysis for BMD in a large population-based sample of both Caucasian and African American subjects. Although the cost of next-generation sequencing, which is determined by choice of sample size and sequencing depth, has declined dramatically, it is still prohibitively expensive to sequence a very large sample at high depth. Therefore, WGS studies usually apply one of the following strategies, (1) single stage to sequence a small number of samples at high depth (>30×) or a larger sample size at low depth (<10×), or (2) two stages to sequence a small number of individuals at high depth followed by a larger sample at low depth. Here we sequenced all subjects at a medium depth, which has been shown to have comparable power for variant discovery and better control of type I error compared with other study designs (16).
The WGS samples were combined with other available independent samples, which were imputed by the largest available reference panel, and the summary statistics from GEFOS to conduct GWAS meta-analysis for DXA derived FNK and SPN BMD. By integrating the GWAS results with various types of epigenetic and transcriptomic information, we provide compelling evidence for the importance of numerous genetic risk loci. Many of the identified regions have been widely reported in previous GWAS studies (5,6) such as WNT4, WLS, WNT16/FAM3C/CPED1, CSRNP3/GALNT3, CCDC170/ESR1, TNFRSF11B/COLEC10 and LRP5/PPP6R3. On the other hand, we also detected several loci that may play important roles in skeletal remodeling but have not been as well established/replicated in earlier GWAS analyses. We will elaborate these novel or less well established/replicated genes in the following.
Novel BMD risk loci in combined sample
IGF2 (insulin-like growth factor 2) encodes a member of the insulin family of polypeptide growth factors, which are involved in both prenatal growth and postnatal development. It has been reported that igf2 knockout mice were observed to have a 40% reduction in birth weight compared with their wild-type littermates (17). Additionally, IGF2 influences postnatal long bone growth by regulating glucose metabolism in chondrocytes. Furthermore, IGF2 has been shown to stimulate bone morphogenic protein (BMP)-9 induced osteogenic differentiation and bone formation via the PI3K/AKT signaling pathway (18). This risk locus also contains the long noncoding RNA H19, which is up-regulated during osteogenic differentiation of MSCs and promotes bone formation through various mechanisms (19).
ZNF423 (zinc finger protein 423) encodes a nuclear protein that functions as a DNA-binding transcription factor by using distinct zinc fingers in different signaling pathways. This locus was previously detected for association with eBMD (7), but has not previously been reported for DXA BMD. ZNF423 plays an important role in the balance of osteoblast and adipocyte lineage commitment of the MSCs by inducing the expression of PPAR , potentially through amplification of the BMP signaling pathway (20). Furthermore, transcriptional repression of ZNF423 has been demonstrated to mediate a BMP-dependent osteoblast/adipocyte lineage commitment change (21).
SIPA1 (signal-induced proliferation-associated 1) encodes a GTPase-activating protein (GAP) which exhibits a specific GAP activity for Ras-related regulatory protein Rap1. Although SIPA1 has not previously been discussed in studies for osteoporosis, Rap1 is reported to regulate osteoblast differentiation by influencing ERK/p38 signaling (22). Furthermore, the loss of function of Rap1 in osteoblasts may inhibit osteogenesis through a decrease in the expression of crucial osteoblast marker genes. Other studies have shown that the osteoclast-specific deletion of Rap1 is reported to be associated with reduced bone resorption capacity (23). This locus also contains RELA, which has been shown to promote osteoclast proliferation by inhibiting a RANL-induced JNK cellular apoptosis pathway (24).
Functional characteristics
We demonstrated that numerous BMD associated genes are preferentially expressed in osteoblasts, and that the BMD associated SNPs were significantly enriched in various regulatory elements in osteoblasts, such as enhancer/promoter chromatin, H3K27ac and DHS. Despite the balance of bone building and bone resorption cells that is critical for bone health, only osteoblast-based data were considered due to the current lack of data for osteoclasts and osteocytes in ENCODE and Roadmap. Hopefully in the future, especially with the rise of single cell sequencing, similar functional information will become readily available for other bone cell types.
Many of the BMD associated SNPs overlap TFBS for transcription factors that are known to play a role in bone metabolism. POLR2A is up-regulated during osteoclast differentiation and osteoclast-specific deletion of POLR2A was shown to inhibit bone resorption in vivo (25). CEBPB mutant mice were observed to have increased bone loss and reduced expression of MafB, an inhibitor of osteoclast differentiation (26). MYC has been demonstrated to promote osteoclast formation, and knockdown of myc in osteoclasts protected mice from ovariectomy-induced bone loss (27). FOS is also essential for osteoclast formation as it regulates the balance of osteoclast/macrophage differentiation, and osteoclasts do not form in its absence (28).
Sex-specific associations
Although we were not able to identify ethnicity specific differences in the genetic determinants of BMD, we did detect several associations that demonstrated sex-specific associations. In the female analysis, we identified PDE4D, which encodes cAMP-dependent phosphodiesterase 4D, and was previously reported to be associated with BMD in an independent GWAS of Caucasian women (29). Additionally, PDE4D inhibitors have been shown to promote osteoblast proliferation and bone formation by increasing intracellular cAMP levels (30). We also detected PIGN, which is involved in glycosylphosphatidylinositol anchor biosynthesis, but has not previously been studied for its role in bone health. Chromatin interaction mapping demonstrated that PIGN interacts with TNFRSF11A, a key component of RANK/RANKL/OPG signaling, which coordinates skeletal remodeling processes. This locus is also involved in a long-range interaction with PMAIP1, which encodes the BH3-only protein Noxa, a crucial regulator of osteoclast apoptosis (31).
In the male analysis, we detected a low frequency variant with a large effect size at TRAF3IP2 (TRAF3 interacting protein 2), which is reported to influence RANKL-induced osteoclast development (32). We also identified NFIB, a member of the nuclear factor I family, which regulates osteoblast differentiation by modulating osterix expression (33). Lastly, we detected LYSMD4 (LysM domain containing 4), which influences peptidoglycan binding. This gene has not previously been detected in genetic studies for osteoporosis, but peptidoglycans are reported to induce bone resorption by stimulating the toll-like receptor and nucleotide binding oligomerization domain signaling pathways to produce inflammatory cytokines (34). LYSMD4 was also observed to interact with IGF1R, and there is substantial evidence to demonstrate that IGF-1 signaling is essential for osteoblast differentiation and bone formation (35).
Fine mapping
We performed a fine-mapping analysis to prioritize variants located within the identified risk loci, which is a critical and necessary step to better understand the biological mechanisms of disease and to reveal novel therapeutic gene targets. Although we were able to identify several high-confidence potential causal variants, the sample size was not sufficient to distinguish the variants that are most likely to have a true biological effect at the remaining risk loci due to the large number of genome-wide significant SNPs and complexity of the LD structure. Additionally, there may be many rare causal variants in a GWAS associated region, which were not considered in the fine-mapping analysis, but more complicated sampling methods are needed for their detection (36).
TWAS
Multi-tissue TWAS analysis was conducted to prioritize the genes with BMD associated expression levels, which could potentially serve as therapeutic gene targets. In addition to the novel locus SIPA1, we identified several other interesting genes which should be further investigated.
PKDCC (protein kinase domain containing, cytoplasmic) encodes a protein kinase belonging to a category of secretory pathway kinases that phosphorylate proteins and proteoglycans in the secretory pathway. Knockout experiments in mice demonstrated that Pkdcc is essential for long bone growth by regulating the differentiation of chondrocytes (37). During long bone development, round proliferative chondrocytes (RPCs) differentiate into flat proliferative chondrocytes (FPCs) and later into hypertrophic chondrocytes (HCs). In the mouse humerus, Pkdcc was highly expressed in early FPCs, and Pkdcc−/− mutant mice exhibited delayed formation of FPCs and HCs (37).
SMOC1 (secreted modular calcium-binding protein 1) encodes a glycoprotein with a calcium-dependent conformation that plays an important role in limb development. It is a BMP antagonist and an important extracellular matrix protein involved in osteoblast differentiation (38). Knockdown of SMOC1 significantly reduced bone mineralization as well as the expression of key osteoblast differentiation markers such as alkaline phosphatase, collagen type I, osteocalcin and bone sialoprotein. SMOC1 was first reported in a multiethnic GWAS for BMD (39) and was later replicated in a GWAS for osteoporotic fracture in African American women (40).
RHPN2 (Rhophilin Rho GTPase Binding Protein 2) encodes a member of the rhophilin family of Ras-homologous (Rho)-GTPase binding proteins. Rho GTPases are known to play an important role in osteoclast differentiation and function, and mice deficient for Rho GTPase signaling were observed to have increased bone mass (41). Rho GTPases are also known to influence mechano-transduction in osteoblasts (42), and there is evidence of interactions between Rho family proteins and Wnt/ -catenin signaling within cancer cells (43). Wnt signaling is crucial for the regulation of bone homeostasis (44), and conceivably, there could be similar interactions within bone cells.
An important limitation of the TWAS analysis is that GTEx does not include gene expression data for bone cells, and therefore there are no existing prediction models available in the optimal tissue for studying osteoporosis. LDSC indicated that the BMD heritability was enriched in cardiovascular and female reproductive tissues. Epidemiological studies have provided evidence that BMD is associated with risk of coronary artery disease, and that the two diseases share common risk factors such as dyslipidemia. Additional studies have reported that there is a coupling of osteogenesis and angiogenesis during bone remodeling (45). On the other hand, postmenopausal osteoporosis risk is intricately linked with estrogen level (46), and since the GWAS sample includes 65% women we retained the female reproductive tissues in the TWAS analysis. Although other GTEx tissues were not identified to be significantly enriched, LDSC is a statistical model with certain underlying assumptions, and a lack of statistical significance is not definitive evidence that a particular tissue is unimportant. There is considerable evidence that physiological wellbeing is highly dependent upon the cross talk between skeletal muscle, fat and bone (15). However, TWAS is prone to false positive associations with expression data from nonrelevant tissues due to cross cell type variation in expression levels and eQTL strengths (47). The TWAS results should be interpreted taking this into consideration, although many of the genes detected have previously been established as osteoporosis candidate genes.
Rare variation
In the rare variant association analysis, we detected MAML2 (mastermind like transcriptional coactivator 2) which encodes a protein that regulates Notch signaling. MAML2 has not previously been reported in studies for osteoporosis, but Notch signaling plays a critical role in maintaining skeletal homeostasis by influencing the activities of bone cells (48). Notch activation in undifferentiated and mature osteoblasts inhibits cell differentiation, leading to impaired bone formation. On the other hand, Notch plays a unique role in osteocytes by inducing osteoprotegerin, suppressing sclerostin and enhancing Wnt signaling. The mechanisms of Notch signaling in osteoclast differentiation are context specific, as Notch activation inhibits commitment to osteoclast differentiation, but stimulates the proliferation of committed osteoclast precursors (49). Additionally, congenital disorders of Notch function often present with severe skeletal deformities, and overactivation of Notch is associated with osteosarcoma (48).
Despite considering the largest WGS sample yet in genetic association studies for BMD, even at a depth of 22×, the significant findings were still limited, which indicates that larger samples are still needed to provide further insights into the contributions of rare variants for the osteoporosis susceptibility. Previous studies have reported that sample size plays a more important role in association testing than sequencing depth (16). It should be noted that although we did conduct separate subgroup analyses for the sake of completeness, with no significant findings detected, the extensive SKAT power analysis provided by Wu et al. (50) indicates that our sample size is not sufficient for sex/ethnicity specific comparisons. Additionally, the rare variant analysis was gene-based by design, and therefore rare intergenic variants with a potential regulatory role were excluded, which is a standard practice (51). If the sample size were large enough, all rare variants could be tested individually, although this is not typically done since single variant tests are less powerful for rare variants than for common variants with identical effect sizes (51). Lastly, it was not possible to attempt replication of the rare variant analysis findings due to the lack of available independent WGS samples with BMD phenotype information.
Conclusions
In summary, we conducted a GWAS meta-analysis for BMD and systematically prioritized the identified risk loci, including several which may be novel osteoporosis candidate genes. Although we have not validated these findings with functional mechanistic experiments, this study takes an important step toward understanding the genetic determinants of BMD. We hope that our results will stimulate future functional validation experiments to confirm the biological significance of these loci.
Materials and Methods
WGS sample
LOS is a cross-sectional study with ongoing recruitment (>17 000 subjects accumulated so far) since 2011 for investigating genetic and nongenetic determinants of osteoporosis and other musculoskeletal diseases/traits (52). Gender and race stratified random sampling were used to select 4981 unrelated subjects (2872 Caucasian and 2109 African American) from the entire LOS cohort. We excluded individuals with the following preexisting conditions relevant to bone mass development: (1) serious residual effects from cerebral vascular disease, (2) diabetes mellitus, except for easily controlled, noninsulin dependent cases, (3) chronic renal failure, (4) chronic liver failure, (5) chronic lung disease, (6) alcohol abuse, (7) corticosteroid or anticonvulsant therapy for >6 months duration, (8) evidence of other metabolic (e.g. hyperthyroidism) or inherited bone disease, (9) rheumatoid arthritis, except for minor cases that involve only hand joint and wrist, (10) collagen disorders and (11) chronic gastrointestinal diseases. All participants signed an informed-consent document before any data collection, and the study was approved by the Tulane University Institutional Review Board.
FNK and SPN BMD for each subject were measured with DXA (Hologic QDR-4500 Discovery DXA scanner, Hologic Inc., Bedford, MA, USA) by trained and certified research staff. The machine was calibrated daily using a phantom scan for quality assurance, and the accuracy of BMD measurement was assessed by the coefficient of variation for repeated measurements, which was ~1.9% for FNK BMD. Weight was measured with the participants wearing light indoor clothing using a daily calibrated balanced beam scale.
We performed WGS of the blood samples at an average read depth of 22× using a BGISEQ-500 sequencer (BGI Americas Corporation, Cambridge, MA, USA) to generate two sequencing runs of paired-end 350 bp reads. The aligned and cleaned data of each sample were mapped to the human reference genome (GRCh38/hg38) using the Burrows-Wheeler Aligner software (53) following the recommended best practices for variant analysis with the Genome Analysis Toolkit (GATK) to ensure accurate variant calling (54). Genomic variations were detected by the HaplotypeCaller of GATK, and the variant quality score recalibration method was applied to obtain high-confidence variant calls (54).
GWAS meta-analysis
The LOS samples were combined with several other independent samples to perform GWAS meta-analysis. Four of these samples were from in-house studies including 987 subjects of European ancestry from the Omaha Osteoporosis Study (55), 2283 individuals of European ancestry from the Kansas City Osteoporosis Study, 1558 subjects of Han Chinese ancestry from the China Osteoporosis Study, and an additional 500 women of Han Chinese ancestry (56). One sample was obtained from the database of Genotypes and Phenotypes (phs000386.v8.p3) including 839 African American and 393 Hispanic subjects from the Women’s Health Initiative. The GWAS results from these individual samples were combined with the summary statistics provided by the 2015 data release from GEFOS (6), which is currently the largest GWAS meta-analysis of Caucasian subjects for DXA BMD including 2882 with WGS, 3549 with whole exome sequencing, and 26 534 genotyped by microarray which were imputed using a combined UK10K/1000 Genomes Project reference panel.
To achieve higher genome coverage, GWAS array samples with available individual level genotype data (i.e. not including GEFOS summary statistics) were imputed by the most recent TOPMed reference panel (57), which is composed of >97 000 deeply sequenced genomes with an average sequencing depth of 30×. SNPs with r2 < 0.3, as estimated by Minimac (58), were considered to have a poor imputation accuracy and were excluded from the GWAS analyses. Quality control of genotype data included the following criteria: individual missingness <5%, MAF > 1%, SNP call rate > 95% and Hardy–Weinberg equilibrium P-value > 1.0 × 10⁻⁶. In each GWAS sample, SNPs were individually tested for association with FNK and SPN BMD under an additive mode of inheritance using a two-stage model. Raw BMD measurements were adjusted for age, sex, weight and the first five ancestry principal components. The ancestry principal components were estimated by EIGENSOFT (59) using an independent set of SNPs across the genome for each sample. The independent set of SNPs was selected by LD pruning using the following parameters—window size of 50, step size of 5, LD threshold of r2 < 0.01. Residual phenotypes after adjustment were normalized by inverse quantile of the standard normal distribution and subsequently used as the phenotype for GWAS.
The summary statistics of each GWAS were used as input for weighted fixed effect meta-analysis with METAL (60), where effect estimates were weighted by the standard errors. The heterogeneity in allelic effects between studies was assessed using the Cochran’s Q test and I2 statistics. SNPs with significant heterogeneity (Cochran’s Q test P-value < 0.05 or I2 > 50%) were analyzed by random effect meta-analysis using the Han and Eskin method in METASOFT (61) and the random effect results were used in place of the fixed effect results. Meta-analysis was conducted in the combined sample, as well as sex/ethnicity subgroups. The 2012 data release from GEFOS (5) was used for the sex-specific analyses since the 2015 release does not provide the sex stratified summary statistics. For all analyses, including the sex-specific analyses, only the autosomal chromosomes were considered.
Genomic risk loci
Genomic risk loci for BMD were defined using the meta-analysis summary statistics and linkage disequilibrium (LD) structure of the 1000 Genomes Project reference panel. We first identified genome-wide significant SNPs (P-value < 5e−8) that were independent from each other at r2 < 0.6. All SNPs that have r2 > 0.6 with at least one of these independent significant SNPs were identified as candidate SNPs. Independent lead SNPs were identified if they were genome-wide significant and independent from each other at r2 < 0.1. If LD blocks of the independent significant SNPs were located within <250 kb they were merged into the same risk locus. The genetic distance is not highly correlated with the LD for SNPs separated by >250 kb (62), and this is the default threshold for LD clumping in various GWAS software tools (63). Since each risk locus may contain multiple genome-wide significant SNPs located at different genes, GCTA (64) was also used to perform stepwise conditional analysis in order to identify the conditionally independent signals across the genome.
Tissue expression profiles of BMD associated genes
Total RNA-seq data from the ENCODE database (strand-specific; Cold Spring Harbor Lab; https://genome.ucsc.edu/cgi-bin/hgFileUi?db=hg19&g=wgEncodeCshlLongRnaSeq) was used to compare the RPKM in osteoblasts and 11 heterologous cell cultures for each gene mapped by BMD associated variants. The 11 nonosteoblast cell cultures included dermal fibroblasts, fetal lung fibroblasts (IMR-90), myoblasts, human mammary epithelial cells, foreskin melanocytes, dermal melanocytes, aortic endothelial cells, follicle dermal papilla cells, pericytes, saphenous vein endothelial cells and preadipocytes. Genes were considered preferentially expressed in osteoblasts if the osteoblast RPKM > 0.1 and the osteoblast RPKM/median of 11 nonosteoblast RPKM > 2. To partially validate the findings, we also examined mouse expression microarray profiles from BioGPS (https://www.biogps.org).
Functional characteristics of BMD associated SNPs
The 18-state chromatin segmentation Roadmap epigenomics data were used to identify SNPs that overlap strong promoter/enhancer chromatin in osteoblasts. Roadmap data were accessed at https://egg2.wustl.edu/roadmap/data/byFileType/chromhmmSegmentations/ChmmModels/core_K27ac/jointModel/final/. Promoter chromatin was defined by active transcription start site (state 1), whereas enhancer chromatin was characterized by flanking transcription start site upstream (state 3), genic enhancer (state 8), and active enhancer (states 9 and 10). Roadmap narrow peaks (https://egg2.wustl.edu/roadmap/data/byFileType/peaks/consolidatedImputed/narrowPeak/) were also used to identify SNPs that overlap DNase I hypersensitivity sites (DHS) and/or the histone H3 lysine-27 acetylation (H3K27ac) epigenetic mark, which are associated with open and active chromatin, in osteoblasts. SNPs that overlap transcription factor binding sites (TFBS) were identified using ChIP-seq data from ENCODE (http://genome.ucsc.edu/cgi-bin/hgTrackUi?db=hg19&g=wgEncodeRegTfbsClusteredV3), in which the peaks for 161 transcription factors in 91 cell types were combined into clusters to produce a summary display showing occupancy regions for each factor. One-sided Fisher’s exact test was used to test for enrichment (i.e. over-representation) of the BMD associated SNPs in each functional element.
To identify SNPs that influence gene expression levels, expression quantitative trait loci (eQTL) mapping was performed using eQTL data for various disease-relevant tissues from the Genotype-Tissue Expression (GTEx) project (https://gtexportal.org) as well as osteoclast-like cells differentiated from peripheral blood mononuclear cells provided by GEFOS (65). Topologically associating domains were characterized using Hi-C data for MSCs (GSE87112) to examine the long-range chromatin interactions involving each genomic risk locus. CIRCOS plots to visualize the topologically associating domains were constructed using FUMA (63).
Predicting functional consequences of nonsynonymous SNPs
Prediction of damaging nonsynonymous SNPs was conducted using three types of scores including SIFT (https://sift.bii.a-star.edu.sg/), PolyPhen-2 (http://genetics.bwh.harvard.edu/pph2/) and CADD (https://cadd.gs.washington.edu/). The machine learning based approach MutPred2 (66) was then used to predict the molecular mechanisms of pathogenicity for amino acid substitutions of interest. This tool identifies specific protein structure and functional alterations associated with a particular substitution which may affect the phenotype. Alterations with P-value < 0.05 were considered as potential mechanisms of pathogenicity.
Fine mapping
The PAINTOR Bayesian fine-mapping approach (67) was used to prioritize potential causal variants by integrating the GWAS summary statistics, LD structure and functional annotations for the SNPs located at the risk loci for each trait. The LD structure was provided by the 1000 Genomes Project reference panel. For functional annotations, we integrated overlap of the SNPs with Roadmap-derived enhancer/promoter chromatin segmentation states and narrow peaks for DHS and H3K27ac in osteoblasts.
The annotation information is incorporated as a prior probability of causality in the Bayesian framework, which improves the accuracy of fine mapping by allowing variants to be weighted differently depending on the functional elements in which they reside. PAINTOR uses a data driven approach to determine the prior probabilities of causality associated with each functional annotation. Bayes rule is applied at each fine-mapping locus to calculate the PP of each causal configuration of SNPs, and a PP of causality is computed for each SNP by performing a summation across the probabilities of each potential causal configuration. The fine-mapping analysis was conducted under the assumption of one causal variant per risk locus. We fit a baseline model without functional annotations as well as a separate model for each annotation of interest, and likelihood ratio tests were used to test the statistical significance of each functional annotation. Significant annotations were retained in the final model.
TWAS
We downloaded the gene expression profiling data for 53 tissues from GTEx and computed a t-statistic for each gene to compare the expression levels between a given tissue and all other tissues. The top 10% of genes with the highest t-statistics within each tissue were identified as the specifically expressed genes that are representative of a particular tissue type. A 100-kb window was added on either side of the transcribed region of each gene in the set of specifically expressed genes to construct a genome annotation corresponding to each tissue. The stratified LDSC approach (68) was then applied to identify tissues from GTEx in which the BMD heritability is significantly enriched. LDSC estimates the significance of the heritability enrichment for each tissue by performing a regression of the GWAS association statistics against the LD scores, defined as the sum of r2 with all other SNPs. Tissues with P-value < 0.05 were considered putative BMD relevant tissues. We applied a lenient threshold to ensure that potentially relevant tissues were not ignored.
Multi-tissue TWAS analysis was conducted among the putatively BMD relevant tissues to identify genes with BMD associated expression levels. The gene expression levels were imputed based on the GWAS summary statistics and prediction models trained using reference samples from GTEx with both genotype and gene expression measurements. The prediction models for the BMD relevant tissues were downloaded from PredictDB (http://predictdb.org/). S-PrediXcan was applied to separately perform TWAS for each relevant tissue, and the marginal effects from individual tissues were combined using S-MultiXcan to infer the joint effect sizes for each gene across the multiple tissues (69). We used a threshold of P-value < 2.5e−6 to determine statistical significance (i.e. Bonferroni correction for ~20 000 genes tested).
Rare variant analysis
The Ensembl Variant Effect Predictor (VEP) software (70) was applied to annotate the functional consequences of variants in the LOS WGS data with MAF < 1% and minor allele count > 1. The gene-based SKAT (50) variance component test was used to test the joint effects of the rare variants located within each gene region that have sequence ontology terms with moderate (missense and in-frame insertion/deletion) or high (start lost, stop lost, frameshift, stop gained and splice donor/acceptor) impact. The rare variant association analyses were conducted separately for each sex/ethnicity group using rvtests (71), and RAREMETAL (72) was applied to combine the results from different subgroups.
Conflicts of Interest statement. None declared.
Supplementary Material
Contributor Information
Jonathan Greenbaum, Tulane Center of Biomedical Informatics and Genomics, Deming Department of Medicine, Tulane University School of Medicine, Tulane University, New Orleans, LA 70112, USA.
Kuan-Jui Su, Tulane Center of Biomedical Informatics and Genomics, Deming Department of Medicine, Tulane University School of Medicine, Tulane University, New Orleans, LA 70112, USA.
Xiao Zhang, Tulane Center of Biomedical Informatics and Genomics, Deming Department of Medicine, Tulane University School of Medicine, Tulane University, New Orleans, LA 70112, USA.
Yong Liu, Tulane Center of Biomedical Informatics and Genomics, Deming Department of Medicine, Tulane University School of Medicine, Tulane University, New Orleans, LA 70112, USA; School of Basic Medical Science, Central South University, Changsha 410013, Hunan Province, PR China.
Anqi Liu, Tulane Center of Biomedical Informatics and Genomics, Deming Department of Medicine, Tulane University School of Medicine, Tulane University, New Orleans, LA 70112, USA.
Lan-Juan Zhao, Tulane Center of Biomedical Informatics and Genomics, Deming Department of Medicine, Tulane University School of Medicine, Tulane University, New Orleans, LA 70112, USA.
Zhe Luo, Tulane Center of Biomedical Informatics and Genomics, Deming Department of Medicine, Tulane University School of Medicine, Tulane University, New Orleans, LA 70112, USA.
Qing Tian, Tulane Center of Biomedical Informatics and Genomics, Deming Department of Medicine, Tulane University School of Medicine, Tulane University, New Orleans, LA 70112, USA.
Hui Shen, Tulane Center of Biomedical Informatics and Genomics, Deming Department of Medicine, Tulane University School of Medicine, Tulane University, New Orleans, LA 70112, USA.
Hong-Wen Deng, Tulane Center of Biomedical Informatics and Genomics, Deming Department of Medicine, Tulane University School of Medicine, Tulane University, New Orleans, LA 70112, USA.
Funding
This research was benefited by the partial support by grants from the National Institutes of Health (P20GM109036, R01AR069055, U19AG055373, R01AG061917).
Authors’ Contributions
J.G. conducted that data analysis and prepared the manuscript. K.S., X.Z., Y.L. and A.L. assisted with the data preprocessing and development of the analytical strategy. L.Z., Z.L. and Q.T. assisted with the preparation of in-house datasets. H.S. provided valuable suggestions throughout the study implementation. H.W.D. conceived, designed and initiated the project. All authors contributed to the manuscript revision.
References
- 1. Orwoll, E.S., Belknap, J.K. and Klein, R.F. (2001) Gender specificity in the genetic determinants of PeakBone mass. J. Bone Miner. Res., 16, 1962–1971. [DOI] [PubMed] [Google Scholar]
- 2. Recker, R.R. and Deng, H.-W. (2002) Role of genetics in osteoporosis. Endocrine, 17, 55–66. [DOI] [PubMed] [Google Scholar]
- 3. Phan, T., Xu, J. and Zheng, M.H. (2004) Interaction between osteoblast and osteoclast: impact in bone disease. Histol. Histopathol., 19, 1325–1344. [DOI] [PubMed] [Google Scholar]
- 4. Kanis, J.A., Borgstrom, F., De Laet, C., Johansson, H., Johnell, O., Jonsson, B., Oden, A., Zethraeus, N., Pfleger, B. and Khaltaev, N. (2005) Assessment of fracture risk. Osteoporos. Int., 16, 581–589. [DOI] [PubMed] [Google Scholar]
- 5. Estrada, K., Styrkarsdottir, U., Evangelou, E., Hsu, Y.H., Duncan, E.L., Ntzani, E.E., Oei, L., Albagha, O.M., Amin, N., Kemp, J.P. et al. (2012) Genome-wide meta-analysis identifies 56 bone mineral density loci and reveals 14 loci associated with risk of fracture. Nat. Genet., 44, 491–501. [DOI] [PMC free article] [PubMed] [Google Scholar]
- 6. Zheng, H.F., Forgetta, V., Hsu, Y.H., Estrada, K., Rosello-Diez, A., Leo, P.J., Dahia, C.L., Park-Min, K.H., Tobias, J.H., Kooperberg, C. et al. (2015) Whole-genome sequencing identifies EN1 as a determinant of bone density and fracture. Nature, 526, 112–117. [DOI] [PMC free article] [PubMed] [Google Scholar]
- 7. Morris, J.A., Kemp, J.P., Youlten, S.E., Laurent, L., Logan, J.G., Chai, R.C., Vulpescu, N.A., Forgetta, V., Kleinman, A., Mohanty, S.T. et al. (2019) An atlas of genetic influences on osteoporosis in humans and mice. Nat. Genet., 51, 258–266. [DOI] [PMC free article] [PubMed] [Google Scholar]
- 8. Yang, T.L., Shen, H., Liu, A., Dong, S.S., Zhang, L., Deng, F.Y., Zhao, Q. and Deng, H.W. (2020) A road map for understanding molecular and genetic determinants of osteoporosis. Nat. Rev. Endocrinol., 16, 91–103. [DOI] [PMC free article] [PubMed] [Google Scholar]
- 9. He, P., Meng, X.H., Zhang, X., Lin, X., Zhang, Q., Jiang, R.L., Schiller, M.R., Deng, F.Y. and Deng, H.W. (2020) Identifying pleiotropic SNPs associated with femoral neck and heel bone mineral density. Front. Genet., 11, 772. [DOI] [PMC free article] [PubMed] [Google Scholar]
- 10. Styrkarsdottir, U., Thorleifsson, G., Sulem, P., Gudbjartsson, D.F., Sigurdsson, A., Jonasdottir, A., Jonasdottir, A., Oddsson, A., Helgason, A., Magnusson, O.T. et al. (2013) Nonsense mutation in the LGR4 gene is associated with several human diseases and other traits. Nature, 497, 517–520. [DOI] [PubMed] [Google Scholar]
- 11. Younes, N., Syed, N., Yadav, S.K., Haris, M., Abdallah, A.M. and Abu-Madi, M. (2021) A whole-genome sequencing association study of low bone mineral density identifies new susceptibility loci in the phase I Qatar biobank cohort. J Pers Med, 11, 34. [DOI] [PMC free article] [PubMed] [Google Scholar]
- 12. Kemp, J.P., Medina-Gomez, C., Estrada, K., Pourcain, B.S., Heppe, D.H.M., Warrington, N.M., Oei, L., Ring, S.M., Kruithof, C.J., Timpson, N.J. et al. (2014) Phenotypic dissection of bone mineral density reveals skeletal site specificity and facilitates the identification of novel loci in the genetic regulation of bone mass attainment. PLoS Genet., 10, e100423. [DOI] [PMC free article] [PubMed] [Google Scholar]
- 13. Zhang, H., Feng, J., Lin, Z., Wang, S., Wang, Y., Dai, S., Kong, W., Wang, Y. and Zhang, Z. (2020) Identification and analysis of genes underlying bone mineral density by integrating microarray data of osteoporosis. Front. Cell Dev. Biol., 8, 798. [DOI] [PMC free article] [PubMed] [Google Scholar]
- 14. Rodriguez-Carballo, E., Gamez, B. and Ventura, F. (2016) p38 MAPK Signaling in osteoblast differentiation. Front. Cell Dev. Biol., 4, 40. [DOI] [PMC free article] [PubMed] [Google Scholar]
- 15. Kirk, B., Feehan, J., Lombardi, G. and Duque, G. (2020) Muscle, bone, and fat crosstalk: the biological role of myokines, osteokines, and adipokines. Curr. Osteoporos. Rep., 18, 388–400. [DOI] [PubMed] [Google Scholar]
- 16. Xu, C., Zhang, R., Shen, H. and Deng, H.W. (2020) Medium-coverage DNA sequencing in the design of the genetic association study. Eur. J. Hum. Genet., 28, 1459–1466. [DOI] [PMC free article] [PubMed] [Google Scholar]
- 17. Randhawa, R. and Cohen, P. (2005) The role of the insulin-like growth factor system in prenatal growth. Mol. Genet. Metab., 86, 84–90. [DOI] [PubMed] [Google Scholar]
- 18. Chen, L., Jiang, W., Huang, J., He, B.C., Zuo, G.W., Zhang, W., Luo, Q., Shi, Q., Zhang, B.Q., Wagner, E.R. et al. (2010) Insulin-like growth factor 2 (IGF-2) potentiates BMP-9-induced osteogenic differentiation and bone formation. J. Bone Miner. Res., 25, 2447–2459. [DOI] [PMC free article] [PubMed] [Google Scholar]
- 19. Silva, A.M., Moura, S.R., Teixeira, J.H., Barbosa, M.A., Santos, S.G. and Almeida, M.I. (2019) Long noncoding RNAs: a missing link in osteoporosis. Bone Res, 7, 10. [DOI] [PMC free article] [PubMed] [Google Scholar]
- 20. Gupta, R.K., Arany, Z., Seale, P., Mepani, R.J., Ye, L., Conroe, H.M., Roby, Y.A., Kulaga, H., Reed, R.R. and Spiegelman, B.M. (2010) Transcriptional control of preadipocyte determination by Zfp423. Nature, 464, 619–623. [DOI] [PMC free article] [PubMed] [Google Scholar]
- 21. Addison, W.N., Fu, M.M., Yang, H.X., Lin, Z., Nagano, K., Gori, F. and Baron, R. (2014) Direct transcriptional repression of Zfp423 by Zfp521 mediates a bone morphogenic protein-dependent osteoblast versus adipocyte lineage commitment switch. Mol. Cell. Biol., 34, 3076–3085. [DOI] [PMC free article] [PubMed] [Google Scholar]
- 22. Wu, Y., Zhou, J., Li, Y., Zhou, Y., Cui, Y., Yang, G. and Hong, Y. (2015) Rap1A regulates osteoblastic differentiation via the ERK and p38 mediated Signaling. PLoS One, 10, e0143777. [DOI] [PMC free article] [PubMed] [Google Scholar]
- 23. Zou, W., Izawa, T., Zhu, T., Chappel, J., Otero, K., Monkley, S.J., Critchley, D.R., Petrich, B.G., Morozov, A., Ginsberg, M.H. et al. (2013) Talin1 and Rap1 are critical for osteoclast function. Mol. Cell. Biol., 33, 830–844. [DOI] [PMC free article] [PubMed] [Google Scholar]
- 24. Vaira, S., Alhawagri, M., Anwisye, I., Kitaura, H., Faccio, R. and Novack, D.V. (2008) RelA/p65 promotes osteoclast differentiation by blocking a RANKL-induced apoptotic JNK pathway in mice. J. Clin. Invest., 118, 2088–2097. [DOI] [PMC free article] [PubMed] [Google Scholar]
- 25. Liu, C., Han, Y., Zhao, X., Li, B., Xu, L., Li, D. and Li, G. (2021) POLR2A blocks osteoclastic bone resorption and protects against osteoporosis by interacting with CREB1. J. Cell. Physiol., 236, 5134–5146. [DOI] [PubMed] [Google Scholar]
- 26. Smink, J.J., Begay, V., Schoenmaker, T., Sterneck, E., de Vries, T.J. and Leutz, A. (2009) Transcription factor C/EBPbeta isoform ratio regulates osteoclastogenesis through MafB. EMBO J., 28, 1769–1781. [DOI] [PMC free article] [PubMed] [Google Scholar]
- 27. Bae, S., Lee, M.J., Mun, S.H., Giannopoulou, E.G., Yong-Gonzalez, V., Cross, J.R., Murata, K., Giguere, V., van der Meulen, M. and Park-Min, K.H. (2017) MYC-dependent oxidative metabolism regulates osteoclastogenesis via nuclear receptor ERRalpha. J. Clin. Invest., 127, 2555–2568. [DOI] [PMC free article] [PubMed] [Google Scholar]
- 28. Boyce, B.F., Yamashita, T., Yao, Z., Zhang, Q., Li, F. and Xing, L. (2005) Roles for NF-KB and c-Fos in osteoclasts. J. Bone Miner. Metab., 23, 11–15. [DOI] [PubMed] [Google Scholar]
- 29. Reneland, R.H., Mah, S., Kammerer, S., Hoyal, C.R., Marnellos, G., Wilson, S.G., Sambrook, P.N., Spector, T.D., Nelson, M.R. and Braun, A. (2005) Association between a variation in the phosphodiesterase 4D gene and bone mineral density. BMC Med. Genet., 6, 9. [DOI] [PMC free article] [PubMed] [Google Scholar]
- 30. Wakabayashi, S., Tsutsumimoto, T., Kawasaki, S., Kinoshita, T., Horiuchi, H. and Takaoka, K. (2002) Involvement of phosphodiesterase isozymes in osteoblastic differentiation. J. Bone Miner. Res., 17, 249–256. [DOI] [PubMed] [Google Scholar]
- 31. Idrus, E., Nakashima, T., Wang, L., Hayashi, M., Okamoto, K., Kodama, T., Tanaka, N., Taniguchi, T. and Takayanagi, H. (2011) The role of the BH3-only protein Noxa in bone homeostasis. Biochem. Biophys. Res. Commun., 410, 620–625. [DOI] [PubMed] [Google Scholar]
- 32. Xiu, Y., Xu, H., Zhao, C., Li, J., Morita, Y., Yao, Z., Xing, L. and Boyce, B.F. (2014) Chloroquine reduces osteoclastogenesis in murine osteoporosis by preventing TRAF3 degradation. J. Clin. Invest., 124, 297–310. [DOI] [PMC free article] [PubMed] [Google Scholar]
- 33. Lee, D.S., Choung, H.W., Kim, H.J., Gronostajski, R.M., Yang, Y.I., Ryoo, H.M., Lee, Z.H., Kim, H.H., Cho, E.S. and Park, J.C. (2014) NFI-C regulates osteoblast differentiation via control of osterix expression. Stem Cells, 32, 2467–2479. [DOI] [PubMed] [Google Scholar]
- 34. Kishimoto, T., Kaneko, T., Ukai, T., Yokoyama, M., Ayon Haro, R., Yoshinaga, Y., Yoshimura, A. and Hara, Y. (2012) Peptidoglycan and lipopolysaccharide synergistically enhance bone resorption and osteoclastogenesis. J. Periodontal Res., 47, 446–454. [DOI] [PubMed] [Google Scholar]
- 35. Crane, J.L., Zhao, L., Frye, J.S., Xian, L., Qiu, T. and Cao, X. (2013) IGF-1 Signaling is essential for differentiation of mesenchymal stem cells for peak bone mass. Bone Res, 1, 186–194. [DOI] [PMC free article] [PubMed] [Google Scholar]
- 36. Navon, O., Sul, J.H., Han, B., Conde, L., Bracci, P.M., Riby, J., Skibola, C.F., Eskin, E. and Halperin, E. (2013) Rare variant association testing under low-coverage sequencing. Genetics, 194, 769–779. [DOI] [PMC free article] [PubMed] [Google Scholar]
- 37. Imuta, Y., Nishioka, N., Kiyonari, H. and Sasaki, H. (2009) Short limbs, cleft palate, and delayed formation of flat proliferative chondrocytes in mice with targeted disruption of a putative protein kinase gene, Pkdcc (AW548124). Dev. Dyn., 238, 210–222. [DOI] [PubMed] [Google Scholar]
- 38. Choi, Y.-A., Lim, J., Kim, K.M., Acharya, B., Cho, J.-Y., Bae, Y.-C., Shin, H.-I., Kim, S.-Y. and Park, E.K. (2010) Secretome analysis of human BMSCs and identification of SMOC1 as an important ECM protein in osteoblast differentiation. J. Proteome Res., 9, 2946–2956. [DOI] [PubMed] [Google Scholar]
- 39. Zhang, L., Choi, H.J., Estrada, K., Leo, P.J., Li, J., Pei, Y.-F., Zhang, Y., Lin, Y., Shen, H., Liu, Y.-Z. et al. (2013) Multistage genome-wide association meta-analyses identified two new loci for bone mineral density. Hum. Mol. Genet., 23, 1923–1933. [DOI] [PMC free article] [PubMed] [Google Scholar]
- 40. Taylor, K.C., Evans, D.S., Edwards, D.R.V., Edwards, T.L., Sofer, T., Li, G., Liu, Y., Franceschini, N., Jackson, R.D., Giri, A. et al. (2016) A genome-wide association study meta-analysis of clinical fracture in 10,012 African American women. Bone Rep, 5, 233–242. [DOI] [PMC free article] [PubMed] [Google Scholar]
- 41. Touaitahuata, H., Blangy, A. and Vives, V. (2014) Modulation of osteoclast differentiation and bone resorption by rho GTPases. Small GTPases, 5, e28119. [DOI] [PMC free article] [PubMed] [Google Scholar]
- 42. Arnsdorf, E.J., Tummala, P., Kwon, R.Y. and Jacobs, C.R. (2009) Mechanically induced osteogenic differentiation – the role of RhoA, ROCKII and cytoskeletal dynamics. J. Cell Sci., 122, 546–553. [DOI] [PMC free article] [PubMed] [Google Scholar]
- 43. Esufali, S. and Bapat, B. (2004) Cross-talk between Rac1 GTPase and dysregulated Wnt signaling pathway leads to cellular redistribution of beta-catenin and TCF/LEF-mediated transcriptional activation. Oncogene, 23, 8260–8271. [DOI] [PubMed] [Google Scholar]
- 44. Baron, R. and Kneissel, M. (2013) WNT signaling in bone homeostasis and disease: from human mutations to treatments. Nat. Med., 19, 179–192. [DOI] [PubMed] [Google Scholar]
- 45. Grosso, A., Burger, M.G., Lunger, A., Schaefer, D.J., Banfi, A. and Di Maggio, N. (2017) It takes two to tango: coupling of angiogenesis and Osteogenesis for bone regeneration. Front. Bioeng. Biotechnol., 5, 68. [DOI] [PMC free article] [PubMed] [Google Scholar]
- 46. Riggs, B.L. (2000) The mechanisms of estrogen regulation of bone resorption. J. Clin. Investig., 106, 1203–1204. [DOI] [PMC free article] [PubMed] [Google Scholar]
- 47. Wainberg, M., Sinnott-Armstrong, N., Mancuso, N., Barbeira, A.N., Knowles, D.A., Golan, D., Ermel, R., Ruusalepp, A., Quertermous, T., Hao, K. et al. (2019) Opportunities and challenges for transcriptome-wide association studies. Nat. Genet., 51, 592–599. [DOI] [PMC free article] [PubMed] [Google Scholar]
- 48. Zanotti, S. and Canalis, E. (2016) Notch Signaling and the skeleton. Endocr. Rev., 37, 223–253. [DOI] [PMC free article] [PubMed] [Google Scholar]
- 49. Ashley, J.W., Ahn, J. and Hankenson, K.D. (2015) Notch signaling promotes osteoclast maturation and resorptive activity. J. Cell. Biochem., 116, 2598–2609. [DOI] [PMC free article] [PubMed] [Google Scholar]
- 50. Wu, M.C., Lee, S., Cai, T., Li, Y., Boehnke, M. and Lin, X. (2011) Rare-variant association testing for sequencing data with the sequence kernel association test. Am. J. Hum. Genet., 89, 82–93. [DOI] [PMC free article] [PubMed] [Google Scholar]
- 51. Lee, S., Abecasis, G.R., Boehnke, M. and Lin, X. (2014) Rare-variant association analysis: study designs and statistical tests. Am. J. Hum. Genet., 95, 5–23. [DOI] [PMC free article] [PubMed] [Google Scholar]
- 52. He, H., Liu, Y., Tian, Q., Papasian, C.J., Hu, T. and Deng, H.W. (2016) Relationship of sarcopenia and body composition with osteoporosis. Osteoporos. Int., 27, 473–482. [DOI] [PubMed] [Google Scholar]
- 53. Li, H. and Durbin, R. (2009) Fast and accurate short read alignment with burrows-Wheeler transform. Bioinformatics, 25, 1754–1760. [DOI] [PMC free article] [PubMed] [Google Scholar]
- 54. McKenna, A., Hanna, M., Banks, E., Sivachenko, A., Cibulskis, K., Kernytsky, A., Garimella, K., Altshuler, D., Gabriel, S., Daly, M. et al. (2010) The genome analysis toolkit: a MapReduce framework for analyzing next-generation DNA sequencing data. Genome Res., 20, 1297–1303. [DOI] [PMC free article] [PubMed] [Google Scholar]
- 55. Xiong, D.H., Liu, X.G., Guo, Y.F., Tan, L.J., Wang, L., Sha, B.Y., Tang, Z.H., Pan, F., Yang, T.L., Chen, X.D. et al. (2009) Genome-wide association and follow-up replication studies identified ADAMTS18 and TGFBR3 as bone mass candidate genes in different ethnic groups. Am. J. Hum. Genet., 84, 388–398. [DOI] [PMC free article] [PubMed] [Google Scholar]
- 56. Gong, R., Xiao, H.-M., Zhang, Y.-H., Zhao, Q., Su, K.-J., Lin, X., Mo, C.-L., Zhang, Q., Du, Y.-T., Lyu, F.-Y. et al. (2021) Identification and functional characterization of metabolites for bone mass in Peri−/post menopausal Chinese women. J. Clin. Endocrinol. Metab., 106, e3159–e3177. [DOI] [PMC free article] [PubMed] [Google Scholar]
- 57. Taliun, D., Harris, D.N., Kessler, M.D., Carlson, J., Szpiech, Z.A., Torres, R., Taliun, S.A.G., Corvelo, A., Gogarten, S.M., Kang, H.M. et al. (2021) Sequencing of 53,831 diverse genomes from the NHLBI TOPMed program. Nature, 590, 290–299. [DOI] [PMC free article] [PubMed] [Google Scholar]
- 58. Fuchsberger, C., Abecasis, G.R. and Hinds, D.A. (2015) minimac2: faster genotype imputation. Bioinformatics, 31, 782–784. [DOI] [PMC free article] [PubMed] [Google Scholar]
- 59. Price, A.L., Patterson, N.J., Plenge, R.M., Weinblatt, M.E., Shadick, N.A. and Reich, D. (2006) Principal components analysis corrects for stratification in genome-wide association studies. Nat. Genet., 38, 904–909. [DOI] [PubMed] [Google Scholar]
- 60. Willer, C.J., Li, Y. and Abecasis, G.R. (2010) METAL: fast and efficient meta-analysis of genomewide association scans. Bioinformatics, 26, 2190–2191. [DOI] [PMC free article] [PubMed] [Google Scholar]
- 61. Han, B. and Eskin, E. (2011) Random-effects model aimed at discovering associations in meta-analysis of genome-wide association studies. Am. J. Hum. Genet., 88, 586–598. [DOI] [PMC free article] [PubMed] [Google Scholar]
- 62. Shifman, S., Kuypers, J., Kokoris, M., Yakir, B. and Darvasi, A. (2003) Linkage disequilibrium patterns of the human genome across populations. Hum. Mol. Genet., 12, 771–776. [DOI] [PubMed] [Google Scholar]
- 63. Watanabe, K., Taskesen, E., van Bochoven, A. and Posthuma, D. (2017) Functional mapping and annotation of genetic associations with FUMA. Nat. Commun., 8, 1826. [DOI] [PMC free article] [PubMed] [Google Scholar]
- 64. Yang, J., Lee, S.H., Goddard, M.E. and Visscher, P.M. (2011) GCTA: a tool for genome-wide complex trait analysis. Am. J. Hum. Genet., 88, 76–82. [DOI] [PMC free article] [PubMed] [Google Scholar]
- 65. Mullin, B.H., Zhu, K., Xu, J., Brown, S.J., Mullin, S., Tickner, J., Pavlos, N.J., Dudbridge, F., Walsh, J.P. and Wilson, S.G. (2018) Expression quantitative trait locus study of bone mineral density GWAS variants in human osteoclasts. J. Bone Miner. Res., 33, 1044–1051. [DOI] [PubMed] [Google Scholar]
- 66. Pejaver, V., Urresti, J., Lugo-Martinez, J., Pagel, K.A., Lin, G.N., Nam, H.J., Mort, M., Cooper, D.N., Sebat, J., Iakoucheva, L.M. et al. (2020) Inferring the molecular and phenotypic impact of amino acid variants with MutPred2. Nat. Commun., 11, 5918. [DOI] [PMC free article] [PubMed] [Google Scholar]
- 67. Kichaev, G., Yang, W.Y., Lindstrom, S., Hormozdiari, F., Eskin, E., Price, A.L., Kraft, P. and Pasaniuc, B. (2014) Integrating functional data to prioritize causal variants in statistical fine-mapping studies. PLoS Genet., 10, e1004722. [DOI] [PMC free article] [PubMed] [Google Scholar]
- 68. Finucane, H.K., Reshef, Y.A., Anttila, V., Slowikowski, K., Gusev, A., Byrnes, A., Gazal, S., Loh, P.R., Lareau, C., Shoresh, N. et al. (2018) Heritability enrichment of specifically expressed genes identifies disease-relevant tissues and cell types. Nat. Genet., 50, 621–629. [DOI] [PMC free article] [PubMed] [Google Scholar]
- 69. Barbeira, A.N., Pividori, M., Zheng, J., Wheeler, H.E., Nicolae, D.L. and Im, H.K. (2019) Integrating predicted transcriptome from multiple tissues improves association detection. PLoS Genet., 15, e1007889. [DOI] [PMC free article] [PubMed] [Google Scholar]
- 70. McLaren, W., Gil, L., Hunt, S.E., Riat, H.S., Ritchie, G.R., Thormann, A., Flicek, P. and Cunningham, F. (2016) The Ensembl variant effect predictor. Genome Biol., 17, 122. [DOI] [PMC free article] [PubMed] [Google Scholar]
- 71. Zhan, X., Hu, Y., Li, B., Abecasis, G.R. and Liu, D.J. (2016) RVTESTS: an efficient and comprehensive tool for rare variant association analysis using sequence data. Bioinformatics, 32, 1423–1426. [DOI] [PMC free article] [PubMed] [Google Scholar]
- 72. Feng, S., Liu, D., Zhan, X., Wing, M.K. and Abecasis, G.R. (2014) RAREMETAL: fast and powerful meta-analysis for rare variants. Bioinformatics, 30, 2828–2829. [DOI] [PMC free article] [PubMed] [Google Scholar]
Associated Data
This section collects any data citations, data availability statements, or supplementary materials included in this article.