

Abstract
Introduction:
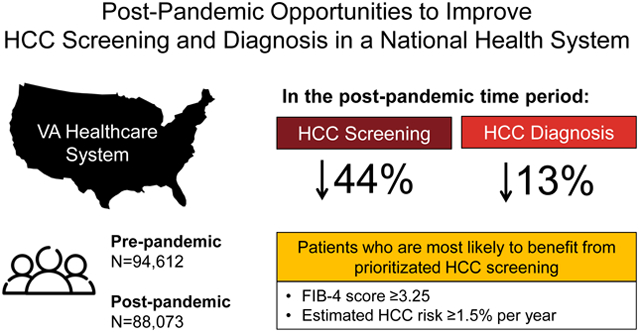
We evaluated the COVID-19 pandemic’s impact on HCC screening and diagnosis among patients with cirrhosis in the Veterans Health Administration.
Methods:
Rates and predictors of screening and diagnosis were reviewed 9/1/2019-2/29/2020 (“pre-COVID-19”,N=94,612) and 4/1/2020-9/30/2020 (“post-COVID-19”,N=88,073).
Results:
Screening and diagnosis rates declined 44% and 13% respectively after COVID-19. Screening declined irrespective of liver disease severity, but diagnosis declined only in MELD-Na<20 or FIB-4<3.25. FIB-4≥3.25 and HCC risk ≥1.5%/year strongly predicted HCC diagnosis, but only moderately predicted receipt of screening.
Discussion:
Screening and diagnosis rates declined post-pandemic. Prioritizing screening for patients at greatest risk for HCC may reduce delays in diagnosis.
Keywords: Surveillance, liver cancer, cirrhosis, Veterans
Graphical Abstract
Introduction
COVID-19 has led to challenges in hepatocellular carcinoma (HCC) screening among patients with cirrhosis. Professional societies suggest that HCC screening can be briefly deferred during the pandemic (1). However, consequences of deferred screening may include delayed diagnosis and more advanced HCC at diagnosis.(2) Thus, efforts to prioritize HCC screening among patients at higher risk of developing HCC have been proposed.(3, 4) We aimed to assess the impact of the pandemic on HCC screening and diagnosis rates, and identify patients at higher risk for missed screening, in a national health system.
Methods
This quality improvement study was approved by the U.S. Veterans Affairs (VA) healthcare system. We identified all Veterans with cirrhosis receiving care at VA facilities using the Cirrhosis-Dashboard (Methods, Supplemental Digital Content [SDC] 1).(5–7) Electronic patient data were obtained for two 6-month time periods before and after the pandemic declaration on March 1, 2020: 9/1/2019-2/29/2020 (“pre-COVID-19”) and 4/1/2020-/30/2020 (“post-COVID-19”). After exclusions (Figure, SDC 2), we obtained an analytic study cohort of 94,612 and 88,073 patients potentially eligible for HCC screening in the pre/post-COVID-19 time periods, respectively. We compared the number of patients who underwent imaging considered adequate for HCC screening (ultrasound, contrast-enhanced CT or MRI ± AFP) or had a new HCC diagnosis (ICD10 22.0) between the time periods. We performed additional analyses by annual HCC risk (<1.5% vs. ≥1.5% vs. unknown) estimated by a validated HCC risk calculator developed for Veterans(8, 9), MELD-Na score (≥20 vs. <20), FIB-4 score (≥3.25 vs. <3.25), and platelet count (<150k vs. ≥150k).(5) As 84,133 patients were in both time periods, overlapping samples Chi-square and t-tests, and multivariable logistic regression with intragroup correlation, adjusting for covariates determined a priori(5), were used for statistical analysis (Methods, SDC 1). Stata v.16 (StataCorp LP, College Station, TX) was used for analysis.
Results
Patient characteristics are summarized in Table 1. The post-COVID-19 cohort (vs. pre-COVID-19) was older with a lower proportion of MELD-Na ≤15, and a greater proportion of missing data.
Table 1.
Characteristics of U.S. VA enrollees with cirrhosis eligible for HCC screening who were included in the electronic Cirrhosis-Dashboard during the pre-COVID-19 and post-COVID-19 study periods
| Characteristic | Pre-COVID-19 time period (9/1/2019-/29/2020) N=94,612 |
Post-COVID-19 time period (4/1/2020-9/30/2020) N=88,073 |
P-value* |
|---|---|---|---|
| Age (years) (%) | |||
| Mean (SD) | 66.6 (9.24) | 67.0 (9.21) | <0.001 |
| <65 | 34,162 (36.1) | 30,196 (34.3) | <0.001 |
| 65–75 | 49,124 (51.9) | 46,899 (53.3) | <0.001 |
| >75 | 11,326 (12.0) | 10,978 (12.5) | 0.001 |
| Sex (%) | |||
| Male | 90,756 (95.9) | 84,384 (95.8) | 0.23 |
| Female | 3,856 (4.08) | 3,689 (4.19) | 0.23 |
| Race (%) | |||
| White | 67,484 (71.3) | 62,563 (71.0) | 0.17 |
| Black | 19,645 (20.8) | 18,428 (20.9) | 0.40 |
| Asian/Pacific Islander | 1,245 (1.32) | 1,164 (1.32) | 0.92 |
| Other | 1,161 (1.23) | 1,071 (1.22) | 0.83 |
| Unknown | 5,077 (5.37) | 4,847 (5.50) | 0.20 |
| Ethnicity (%) | |||
| Hispanic | 7,381 (7.80) | 6,922 (7.86) | 0.65 |
| Non-Hispanic | 84,275 (89.1) | 78,357 (89.0) | 0.47 |
| Unknown | 2,956 (3.12) | 2,794 (3.17) | 0.56 |
| Diabetesa (%) | |||
| Yes | 45,791 (48.4) | 42,255 (48.0) | 0.05 |
| No | 48,821 (51.6) | 45,818 (52.0) | 0.05 |
| Alcohol use disordera (%) | |||
| Yes | 48,808 (51.6) | 45,333 (51.5) | 0.64 |
| No | 45,804 (48.4) | 42,740 (48.5) | 0.64 |
| CKD (%) | |||
| Yes | 16,672 (17.6) | 15,299 (17.4) | 0.16 |
| No | 69,868 (73.9) | 60,764 (69.0) | <0.001 |
| Missing | 8,072 (8.53) | 12,010 (13.6) | <0.001 |
| Etiology of cirrhosis (%) | |||
| ALD | 29,206 (30.9) | 27,001 (30.7) | 0.33 |
| HBV | 1,513 (1.60) | 1,493 (1.70) | 0.11 |
| HCV (cured) | 30,735 (32.5) | 28,782 (32.7) | 0.38 |
| HCV (active) | 2,217 (2.34) | 2,186 (2.48) | 0.06 |
| HBV+HCV | 556 (0.59) | 546 (0.62) | 0.38 |
| NAFLD | 21,844 (23.1) | 20,054 (22.8) | 0.10 |
| Cryptogenic | 5,999 (6.34) | 5,642 (6.41) | 0.57 |
| Other | 2,542 (2.69) | 2,369 (2.69) | 0.97 |
| BMI (kg/m 2 ) (%) | |||
| Underweight (<18.5) | 1,792 (1.89) | 1,740 (1.98) | 0.21 |
| Normal (18.5–24.9) | 21,104 (22.3) | 19,866 (22.6) | 0.20 |
| Overweight (25–29.9) | 30,706 (32.5) | 28,486 (32.3) | 0.61 |
| Obese (≥30) | 40,318 (42.6) | 37,071 (42.1) | 0.02 |
| Missing | 692 (0.73) | 910 (1.03) | <0.001 |
| Fibrosis 4 (FIB-4) scoreb (%) | |||
| <3.25 | 57,001 (60.3) | 49,213 (55.9) | <0.001 |
| ≥3.25 | 25,621 (27.1) | 22,448 (25.5) | <0.001 |
| Missing | 11,990 (12.7) | 16,412 (18.6) | <0.001 |
| MELD-Na score (%) | |||
| ≤10 | 19,967 (21.1) | 15,772 (17.9) | <0.001 |
| 11–15 | 18,387 (19.4) | 16,160 (18.4) | <0.001 |
| 16–20 | 6,868 (7.26) | 6,360 (7.22) | 0.76 |
| 21–25 | 2,909 (3.07) | 2,636 (2.99) | 0.31 |
| 26–30 | 1,511 (1.60) | 1,463 (1.66) | 0.28 |
| ≥31 | 1,228 (1.30) | 1,178 (1.34) | 0.46 |
| Missing | 43,742 (46.2) | 44,504 (50.5) | <0.001 |
| Platelet count (K/μL) | |||
| <150,000 | 32,738 (34.6) | 28,966 (32.9) | <0.001 |
| >150,000 | 51,699 (54.6) | 44,733 (50.8) | <0.001 |
| Missing | 10,175 (10.8) | 14,374 (16.3) | <0.001 |
| INR | |||
| ≥1. | 6,934 (7.33) | 6,382 (7.25) | 0.50 |
| <1.5 | 44,677 (47.2) | 37,999 (43.1) | <0.001 |
| Missing | 43,001 (45.5) | 43,692 (49.6) | 0.03 |
| AST (U/L) | |||
| ≥40 | 21,512 (22.7) | 18,415 (20.9) | <0.001 |
| <40 | 63,296 (66.9) | 55,591 (63.1) | <0.001 |
| Missing | 9,804 (10.4) | 14,067 (16.0) | <0.001 |
| ALT (U/L) | |||
| ≥40 | 17,909 (18.9) | 15,453 (17.6) | <0.001 |
| <40 | 67,156 (71.0) | 58,755 (66.7) | <0.001 |
| Missing | 9,547 (10.1) | 13,865 (15.7) | <0.001 |
| Bilirubin (mg/dL) | |||
| ≥2 | 5,780 (6.11) | 5,449 (6.19) | 0.49 |
| <2 | 78,246 (82.7) | 67,919 (77.1) | <0.001 |
| Missing | 10,586 (11.2) | 14,705 (16.7) | <0.001 |
| Albumin (g/dL) | |||
| <3.5 | 18,876 (20.0) | 17,254 (19.6) | 0.05 |
| ≥3.5 | 65,951 (68.7) | 56,161 (63.8) | <0.001 |
| Missing | 10,785 (11.4) | 14,658 (16.6) | <0.001 |
| Sodium (mEq/L) | |||
| ≤135 | 13,592 (14.4) | 13,079 (14.9) | 0.004 |
| >135 | 72,797 (76.9) | 62,740 (71.2) | <0.001 |
| Missing | 8,223 (8.69) | 12,254 (13.9) | <0.001 |
| Creatinine (mg/dL) | |||
| >1 | 41,477 (43.8) | 37,127 (42.2) | <0.001 |
| ≤1 | 45,289 (47.9) | 39,247 (44.6) | <0.001 |
| Missing | 7,846 (8.29) | 11,699 (13.3) | <0.001 |
ALD: Alcohol-associated liver disease. ALT: Alanine aminotransferase. AST: Aspartate aminotransferase. BMI: Body mass index. CKD: Chronic kidney disease. HBV: Hepatitis B virus. HCC: Hepatocellular carcinoma. HCV: Hepatitis C virus. NAFLD: Nonalcoholic fatty liver disease.
P-value considered significant if <0.05.
Includes past or present history of comorbidities.
FIB-4 score was calculated as: [age(years)*AST(U/L)] / [platelet count(109/L)* √ALT (U/L)]
Receipt of HCC screening declined 44% (39% to 22%) in the post-COVID-19 time period (P<0.001, Table 2). Receipt of all forms of screening (AFP only, ultrasound ± AFP, CT or MRI ± AFP) declined significantly post-pandemic. HCC screening declined irrespective of estimated annual HCC risk, MELD-Na, FIB-4, and platelet count (P<0.001; Figure, SDC 3).
Table 2.
Comparison of the pre-COVID-19 and post-COVID-19 time periods with respect to the rates of HCC screening and HCC diagnosis overall and by liver disease severity and estimated annual risk of HCC among U.S. VA enrollees with cirrhosis eligible for HCC screening
| Pre-COVID-19 (9/1/2019-/29/2020) |
Post-COVID-19 (4/1/2020-9/30/2020) |
P-value* | |
|---|---|---|---|
| ALL PATIENTS | N=94,612 | N=88,073 | |
| HCC screening (%) | |||
| None | 52,177 (55.2) | 65,116 (73.9) | <0.001 |
| AFP only | 5,523 (5.84) | 3,396 (3.86) | <0.001 |
| US, CT, or MRI ± AFP | 36,912 (39.0) | 19,561 (22.2) | <0.001 |
| US ± AFP | 27,304 (28.9) | 14,440 (16.4) | <0.001 |
| CT or MRI ± AFP | 9,608 (10.2) | 5,121 (5.81) | <0.001 |
| New HCC diagnosis (%) | 1,431 (1.51) | 1,169 (1.33) | <0.001 |
| FIB-4 ≥3.25 | n=25,621 | n=22,448 | |
| HCC screening (%) | |||
| None | 11,315 (44.2) | 14,419 (64.2) | <0.001 |
| AFP only | 1,915 (7.47) | 1,198 (5.34) | <0.001 |
| US, CT, or MRI ± AFP | 12,391 (48.4) | 6,831 (30.4) | <0.001 |
| US ± AFP | 9,177 (35.8) | 4,950 (22.1) | <0.001 |
| CT or MRI ± AFP | 3,214 (12.5) | 1,881 (8.38) | <0.001 |
| New HCC diagnosis (%) | 644 (2.51) | 592 (2.64) | 0.40 |
| FIB-4 <3.25 | n=57,001 | n=49,213 | |
| HCC screening (%) | |||
| None | 30,215 (53.0) | 35,239 (71.6) | <0.001 |
| AFP only | 3,451 (6.05) | 2,129 (4.33) | <0.001 |
| US, CT, or MRI ± AFP | 23,335 (40.9) | 11,845 (24.1) | <0.001 |
| US ± AFP | 17,145 (30.1) | 8,758 (17.8) | <0.001 |
| CT or MRI ± AFP | 6,190 (10.9) | 3,087 (6.27) | <0.001 |
| New HCC diagnosis (%) | 730 (1.28) | 528 (1.07) | 0.001 |
| FIB-4 Missing | n=11,990 | n=16,412 | |
| HCC screening (%) | |||
| None | 10,647 (88.8) | 15,458 (94.2) | <0.001 |
| AFP only | 157 (1.31) | 69 (0.42) | <0.001 |
| US, CT, or MRI ± AFP | 1,186 (9.89) | 885 (5.39) | <0.001 |
| US ± AFP | 982 (8.19) | 732 (4.46) | <0.001 |
| CT or MRI ± AFP | 204 (1.70) | 153 (0.93) | <0.001 |
| New HCC diagnosis (%) | 57 (0.48) | 49 (0.30) | 0.01 |
| MELD-Na ≥20 | n=5,731 | n=5,355 | |
| HCC screening (%) | |||
| None | 2,455 (42.8) | 3,559 (66.5) | <0.001 |
| AFP only | 336 (5.86) | 238 (4.44) | <0.001 |
| US, CT, or MRI ± AFP | 2,940 (51.3) | 1,558 (29.1) | <0.001 |
| US ± AFP | 2,369 (41.3) | 1,240 (23.2) | <0.001 |
| CT or MRI ± AFP | 571 (10.0) | 318 (5.94) | <0.001 |
| New HCC diagnosis (%) | 166 (2.90) | 183 (3.43) | 0.13 |
| MELD-Na <20 | n=45,139 | n=38,214 | |
| HCC screening (%) | |||
| None | 15,615 (34.6) | 21,565 (56.4) | <0.001 |
| AFP only | 3,652 (8.09) | 2,474 (6.47) | <0.001 |
| US, CT, or MRI ± AFP | 25,872 (57.3) | 14,175 (37.1) | <0.001 |
| US ± AFP | 18,676 (41.4) | 10,145 (26.6) | <0.001 |
| CT or MRI ± AFP | 7,196 (15.9) | 4,030 (10.6) | <0.001 |
| New HCC diagnosis (%) | 1,077 (2.39) | 820 (2.15) | 0.02 |
| MELD-Na Missing | n=43,742 | n=44,504 | |
| HCC screening (%) | |||
| None | 34,107 (78.0) | 39,992 (89.9) | <0.001 |
| AFP only | 1,535 (3.51) | 684 (1.54) | <0.001 |
| US, CT, or MRI ± AFP | 8,100 (18.5) | 3,828 (8.60) | <0.001 |
| US ± AFP | 6,259 (14.3) | 3,055 (6.86) | <0.001 |
| CT or MRI ± AFP | 1,841 (4.21) | 773 (1.74) | <0.001 |
| New HCC diagnosis (%) | 188 (0.43) | 166 (0.37) | 0.18 |
| Platelet <150k | n=32,738 | n=28,966 | |
| HCC screening (%) | |||
| None | 14,623 (44.7) | 18,412 (63.6) | <0.001 |
| AFP only | 2,402 (7.34) | 1,612 (5.57) | <0.001 |
| US, CT, or MRI ± AFP | 15,713 (48.0) | 8,942 (30.9) | <0.001 |
| US ± AFP | 11,761 (35.9) | 6,567 (22.7) | <0.001 |
| CT or MRI ± AFP | 3,952 (12.1) | 2,375 (8.20) | <0.001 |
| New HCC diagnosis (%) | 581 (1.77) | 4.99 (1.72) | 0.62 |
| Platelet ≥150k | n=51,699 | n=44,733 | |
| HCC screening (%) | |||
| None | 28,369 (54.9) | 33,060 (73.9) | <0.001 |
| AFP only | 3,015 (5.83) | 1,739 (3.89) | <0.001 |
| US, CT, or MRI ± AFP | 20,315 (39.3) | 9,934 (22.2) | <0.001 |
| US ± AFP | 14,801 (28.6) | 7,306 (16.3) | <0.001 |
| CT or MRI ± AFP | 5,514 (10.7) | 2,628 (5.87) | <0.001 |
| New HCC diagnosis (%) | 800 (1.55) | 627 (1.40) | 0.06 |
| Platelet Missing | n=10,175 | n=14,374 | |
| HCC screening (%) | |||
| None | 9,185 (90.3) | 13,644 (94.9) | <0.001 |
| AFP only | 106 (1.04) | 45 (0.31) | <0.001 |
| US, CT, or MRI ± AFP | 884 (8.69) | 685 (4.77) | <0.001 |
| US ± AFP | 742 (7.29) | 567 (3.94) | <0.001 |
| CT or MRI ± AFP | 142 (1.40) | 118 (0.82) | <0.001 |
| New HCC diagnosis (%) | 50 (0.49) | 43 (0.30) | 0.01 |
| Estimated Annual HCC Risk ≥1.5% ** | n=22,699 | n=20,196 | |
| HCC screening (%) | |||
| None | 10,134 (44.7) | 13,206 (65.4) | <0.001 |
| AFP only | 1,661 (7.32) | 1,035 (5.12) | <0.001 |
| US, CT, or MRI ± AFP | 10,904 (48.0) | 5,955 (29.5) | <0.001 |
| US ± AFP | 8,137 (35.9) | 4,322 (21.40) | <0.001 |
| CT or MRI ± AFP | 2,767 (12.2) | 1,633 (8.09) | <0.001 |
| New HCC diagnosis (%) | 543 (2.39) | 497 (2.46) | 0.65 |
| Estimated Annual HCC Risk <1.5% ** | n=45,310 | n=39,094 | |
| HCC screening (%) | |||
| None | 23,801 (52.5) | 27,753 (71.0) | <0.001 |
| AFP only | 2,763 (6.10) | 1,694 (4.33) | <0.001 |
| US, CT, or MRI ± AFP | 18,746 (41.4) | 9,647 (24.7) | <0.001 |
| US ± AFP | 13,812 (30.5) | 7,167 (18.3) | <0.001 |
| CT or MRI ± AFP | 4,934 (10.9) | 2,480 (6.34) | <0.001 |
| New HCC diagnosis (%) | 470 (1.04) | 362 (0.93) | 0.10 |
| Estimated Annual HCC Risk - Unable to Calculate ** | n=26,603 | n=28,783 | |
| HCC screening (%) | |||
| None | 18,242 (68.9) | 24,157 (83.9) | <0.001 |
| AFP only | 1,099 (4.13) | 667 (2.32) | <0.001 |
| US, CT, or MRI ± AFP | 7,262 (27.3) | 3,959 (13.8) | <0.001 |
| US ± AFP | 5,355 (20.1) | 2,951 (10.3) | <0.001 |
| CT or MRI ± AFP | 1,907 (7.17) | 1,008 (3.50) | <0.001 |
| New HCC diagnosis (%) | 418 (1.57) | 310 (1.08) | <0.001 |
AFP: Alpha fetoprotein. CT: Computed tomography. HCC: Hepatocellular carcinoma. MRI: Magnetic resonance imaging. US: Ultrasound.
P-value considered significant if <0.05.
Estimated by a validated HCC risk calculator developed for Veterans.
New HCC diagnosis declined 13% (1.5% to 1.3%) in the post-COVID-19 time period (P<0.001, Table 2). Patients with unknown HCC risk (P<0.001), MELD-Na<20 (P=0.02), FIB-4<3.25 (P=0.001), and missing FIB-4 (P=0.01) or platelet (P=0.01) values were less likely to be diagnosed with HCC post-pandemic (Figure, SDC 3).
Independent predictors of failure to undergo screening included: being in the post-COVID-19 (vs. pre-COVID-19) time period, age >75 years, unknown race (vs. white), chronic kidney disease, active-HCV or cryptogenic cirrhosis (vs. alcohol-associated liver disease [ALD]), high MELD-Na scores, and unknown annual HCC risk (vs. low risk). Independent predictors of HCC diagnosis included: age >65 years, unknown race (vs. white), underweight or missing BMI, diabetes, any non-ALD etiology of cirrhosis (vs. ALD), high FIB-4 scores, thrombocytopenia, high MELD-Na scores, and high annual HCC risk (vs. low risk). Patients with missing data were less likely to receive screening or an HCC diagnosis (Table 3).
Table 3.
Predictors of receiving HCC screening* and new HCC diagnosis among U.S. VA enrollees with cirrhosis eligible for screening during the study period
| HCC Screening* (N=182,685) | HCC Diagnosis (N=182,685) | |||||||||
|---|---|---|---|---|---|---|---|---|---|---|
| Unadjusteda OR | Adjusteda,b OR | Unadjusteda OR | Adjusteda,b OR | |||||||
| Characteristic | Screened (%) | 95% CI | P-value | 95% CI | P-value | Diagnosed with HCC (%) | 95% CI | P-value | 95% CI | P-value |
| Time period | ||||||||||
| Pre-COVID-19 | 36,912 (39.0) | 1 | - | 1 | - | 1,431 (1.51) | 1 | - | 1 | - |
| Post-COVID-19 | 19,561 (22.2) | 0.45 (0.44–0.45) | <0.001 | 0.46 (0.45–0.47) | <0.001 | 1,169 (1.33) | 0.88 (0.81–0.95) | 0.001 | 0.91 (0.84–0.99) | 0.02 |
| Age | ||||||||||
| <65 | 19,811 (30.8) | 1 | - | 1 | - | 644 (1.00) | 1 | - | 1 | - |
| 65–75 | 31,111 (32.4) | 1.08 (1.05–1.11) | <0.001 | 1.05 (1.02–1.08) | 0.001 | 1,501 (1.56) | 1.57 (1.43–1.72) | <0.001 | 1.37 (1.25–1.51) | <0.001 |
| >75 | 5,551 (24.9) | 0.75 (0.71–0.78) | <0.001 | 0.82 (0.78–0.86) | <0.001 | 455 (2.04) | 2.06 (1.83–2.33) | <0.001 | 1.73 (1.50–1.98) | <0.001 |
| Sex | ||||||||||
| Male | 54,222 (31.0) | 1 | - | 1 | - | 2,551 (1.46) | 1 | - | 1 | - |
| Female | 2,251 (29.8) | 0.95 (0.89–1.01) | 0.09 | 1.00 (0.94–1.07) | 0.90 | 49 (0.65) | 0.44 (0.33–0.59) | <0.001 | 0.53 (0.40–0.70) | <0.001 |
| Race | ||||||||||
| White | 39,744 (30.6) | 1 | - | 1 | - | 1,838 (1.41) | 1 | - | 1 | - |
| Black | 12,483 (32.8) | 1.11 (1.08–1.14) | <0.001 | 1.08 (1.05–1.12) | <0.001 | 522 (1.37) | 0.97 (0.88–1.07) | 0.54 | 0.89 (0.80–0.99) | 0.04 |
| Asian/PI | 860 (35.7) | 1.26 (1.14–1.40) | <0.001 | 1.21 (1.08–1.34) | 0.001 | 46 (1.91) | 1.36 (1.01–1.83) | 0.04 | 1.35 (1.00–1.83) | 0.05 |
| Other | 625 (28.0) | 0.88 (0.79–0.99) | 0.03 | 0.92 (0.82–1.04) | 0.17 | 28 (1.25) | 0.89 (0.61–1.29) | 0.53 | 1.00 (0.68–1.45) | 0.98 |
| Unknown | 2,761 (27.8) | 0.88 (0.83–0.93) | <0.001 | 0.92 (0.86–0.98) | 0.01 | 166 (1.67) | 1.19 (1.01–1.39) | 0.04 | 1.20 (0.99 −1.45) | 0.06 |
| Ethnicity | ||||||||||
| Non-Hispanic | 50,119 (30.8) | 1 | - | 1 | - | 2,288 (1.41) | 1 | - | 1 | - |
| Hispanic | 4,699 (32.9) | 1.10 (1.05–1.15) | <0.001 | 1.08 (1.03–1.13) | 0.001 | 226 (1.58) | 1.13 (0.98–1.29) | 0.09 | 1.03 (0.89–1.19) | 0.67 |
| Unknown | 1,655 (28.8) | 0.91 (0.85–0.97) | 0.007 | 1.01 (0.93–1.09) | 0.85 | 86 (1.50) | 1.06 (0.86–1.32) | 0.58 | 0.97 (0.75–1.26) | 0.84 |
| BMI | ||||||||||
| Underweight | 903 (25.6) | 0.89 (0.81–0.97) | 0.009 | 0.92 (0.84–1.01) | 0.09 | 79 (2.24) | 1.21 (0.96–1.53) | 0.11 | 1.34 (1.05–1.70) | 0.02 |
| Normal | 11,414 (27.9) | 1 | - | 1 | - | 760 (1.86) | 1 | - | 1 | - |
| Overweight | 18,207 (30.8) | 1.15 (1.11–1.19) | <0.001 | 1.10 (1.06–1.13) | <0.001 | 843 (1.42) | 0.76 (0.69–0.84) | <0.001 | 0.75 (0.67–0.83) | <0.001 |
| Obese | 25,713 (33.2) | 1.29 (1.25–1.33) | <0.001 | 1.17 (1.13–1.21) | <0.001 | 786 (1.13) | 0.61 (0.55–0.67) | <0.001 | 0.62 (0.55–0.69) | <0.001 |
| Missing | 236 (14.7) | 0.45 (0.38–0.52) | <0.001 | 0.99 (0.84–1.18) | 0.93 | 42 (2.62) | 1.42 (1.04–1.95) | 0.03 | 1.95 (1.41–2.71) | <0.001 |
| Diabetes | ||||||||||
| No | 27,266 (28.8) | 1 | - | 1 | - | 1,291 (1.36) | 1 | - | 1 | - |
| Yes | 29,207 (33.2) | 1.23 (1.20–1.26) | <0.001 | 1.11 (1.08–1.14) | <0.001 | 1.309 (1.49) | 1.09 (1.01–1.18) | 0.03 | 1.11 (1.02–1.22) | 0.02 |
| Alcohol use disorder |
|
|||||||||
| No | 27,093 (30.6) | 1 | - | 1 | - | 1,434 (1.62) | 1 | - | 1 | - |
| Yes | 29,380 (31.2) | 1.03 (1.00–1.05) | 0.02 | 0.98 (0.94–1.02) | 0.25 | 1,166 (1.24) | 0.76 (0.70–0.82) | <0.001 | 0.98 (0.87–1.10) | 0.70 |
| CKD | ||||||||||
| No | 45,914 (35.2) | 1 | - | 1 | - | 1,894 (1.45) | 1 | - | 1 | - |
| Yes | 9,771 (30.6) | 0.81 (0.79–0.84) | <0.001 | 0.87 (0.84–0.90) | <0.001 | 622 (1.95) | 1.35 (1.23–1.48) | <0.001 | 0.98 (0.88–1.09) | 0.72 |
| Missing | 788 (3.92) | 0.08 (0.07–0.08) | <0.001 | 0.22 (0.20–0.25) | <0.001 | 84 (0.42) | 0.29 (0.23–0.36) | <0.001 | 0.71 (0.52–0.96) | 0.03 |
| Etiology of cirrhosis |
|
|||||||||
| ALD | 16,369 (29.1) | 1 | - | 1 | - | 482 (0.86) | 1 | - | 1 | - |
| HBV | 1,377 (45.8) | 2.06 (1.88–2.25) | <0.001 | 2.03 (1.85–2.23) | <0.001 | 41 (1.36) | 1.60 (1.16–2.20) | 0.004 | 1.67 (1.20–2.32) | 0.002 |
| HCV (cured) | 20,813 (35.0) | 1.31 (1.27–1.35) | <0.001 | 1.37 (1.32–1.42) | <0.001 | 1,025 (1.72) | 2.03 (1.82–2.26) | <0.001 | 2.37 (2.09–2.68) | <0.001 |
| HCV (active) | 785 (17.8) | 0.53 (0.48–0.58) | <0.001 | 0.58 (0.53–0.64) | <0.001 | 129 (2.93) | 3.49 (2.86–4.25) | <0.001 | 3.52 (2.87–4.31) | <0.001 |
| HBV+HCV | 430 (39.0) | 1.56 (1.35–1.80) | <0.001 | 1.60 (1.38–1.86) | <0.001 | 20 (1.81) | 2.14 (1.36–3.36) | 0.001 | 2.45 (1.55–3.86) | <0.001 |
| NAFLD | 12,569 (30.0) | 1.04 (1.01–1.08) | 0.02 | 0.96 (0.91–1.01) | 0.09 | 618 (1.48) | 1.73 (1.54–1.95) | <0.001 | 1.72 (1.45–2.04) | <0.001 |
| Cryptogenic | 2,327 (20.0) | 0.61 (0.57–0.64) | <0.001 | 0.77 (0.71–0.83) | <0.001 | 222 (1.91) | 2.25 (1.91–2.64) | <0.001 | 2.08 (1.69–2.56) | <0.001 |
| Other | 1,803 (36.7) | 1.41 (1.31–1.52) | <0.001 | 1.38 (1.27–1.49) | <0.001 | 63 (1.28) | 1.50 (1.15–1.96) | 0.003 | 1.44 (1.09–1.91) | 0.01 |
| FIB-4 score | ||||||||||
| <3.25 | 35,180 (33.1) | 1 | - | 1 | - | 1,258 (1.18) | 1 | - | 1 | - |
| ≥3.25 | 19,222 (40.0) | 1.35 (1.31–1.38) | <0.001 | 1.46 (1.42–1.50) | <0.001 | 1,236 (2.57) | 2.20 (2.03–2.38) | <0.001 | 2.26 (2.08–2.45) | <0.001 |
| Missing | 2,071 (7.29) | 0.16 (0.15–0.17) | <0.001 | 0.35 (0.33–0.38) | <0.001 | 106 (0.37) | 0.31 (0.26–0.38) | <0.001 | 0.36 (0.28–0.48) | <0.001 |
| Platelet count | ||||||||||
| ≥150k | 30,249 (31.4) | 1 | - | 1 | - | 1,427 (1.48) | 1 | - | 1 | - |
| <150k | 24,655 (40.0) | 1.46 (1.42–1.49) | <0.001 | 1.49 (1.46–1.53) | <0.001 | 1,080 (1.75) | 1.19 (1.10–1.28) | <0.001 | 1.20 (1.11–1.30) | <0.001 |
| Missing | 1,569 (6.39) | 0.15 (0.14–0.16) | <0.001 | 0.39 (0.36–0.42) | <0.001 | 93 (0.38) | 0.25 (0.21–0.31) | <0.001 | 0.35 (0.26–0.47) | <0.001 |
| MELD-Na score | ||||||||||
| <20 | 40,047 (48.1) | 1 | - | 1 | - | 1,897 (2.28) | 1 | - | 1 | - |
| ≥20 | 4,498 (40.6) | 0.74 (0.71–0.77) | <0.001 | 0.81 (0.77–0.85) | <0.001 | 349 (3.15) | 1.40 (1.24–1.57) | <0.001 | 1.36 (1.19–1.54) | <0.001 |
| Missing | 11,928 (13.5) | 0.17 (0.16–0.17) | <0.001 | 0.22 (0.21–0.23) | <0.001 | 354 (0.40) | 0.17 (0.15–0.19) | <0.001 | 0.19 (0.17–0.21) | <0.001 |
| Estimated annual HCC risk c | ||||||||||
| <1.5% | 28,393 (33.6) | 1 | - | 1 | - | 832 (0.99) | 1 | - | 1 | - |
| ≥1.5% | 16,859 (39.3) | 1.28 (1.24–1.31) | <0.001 | 1.43 (1.39–1.47) | <0.001 | 1,040 (2.42) | 2.50 (2.28–2.74) | <0.001 | 2.31 (2.10–2.54) | <0.001 |
| Unable to calculate | 11,221 (20.3) | 0.50 (0.49–0.52) | <0.001 | 0.58 (0.55–0.60) | <0.001 | 728 (1.31) | 1.34 (1.21–1.48) | <0.001 | 1.44 (1.26–1.64) | <0.001 |
ALD: Alcohol-associated liver disease. BMI: Body mass index. CKD: Chronic kidney disease. HBV: Hepatitis B virus. HCC: Hepatocellular carcinoma. HCV: Hepatitis C virus. NAFLD: Nonalcoholic fatty liver disease. PI: Pacific Islander.
Ultrasound or CT or MRI ± AFP
Multivariable models were performed using logistic regression with intragroup correlation.
Adjusted for age, sex, race, ethnicity, BMI, diabetes, alcohol use disorder, CKD, etiology of cirrhosis, and FIB-4 score. FIB-4 score not adjusted when analyzing platelet counts or estimated annual HCC risk to avoid risk of over-adjustment.
Estimated by a validated HCC risk calculator for Veterans.
Discussion
In this large nationwide cohort of Veterans with cirrhosis, HCC screening and diagnosis rates declined post-pandemic by 44% and 13% respectively. The pandemic’s negative impact on screening rates is similar to findings reported from other clinical settings.(10–12) Importantly, we also found a decline in the HCC diagnosis rate in a national health system.
Position papers have recommended prioritizing HCC screening for patients at higher risk of HCC to minimize adverse consequences during the pandemic.(3, 4, 13, 14) We found that patients with a FIB-4 score ≥3.25 and a high HCC risk of ≥1.5%/year, based on an internally validated HCC risk calculator(8, 9) that estimates patients’ annual risk of HCC in HCV-, ALD-, and NAFLD-cirrhosis, were most likely to develop HCC. However, despite the high HCC risk, these patients were not substantially more likely to receive screening. Thus, one strategy for prioritization is to offer screening for individuals with a high FIB-4 score or high annual HCC risk to optimize screening efforts.
We also found a relatively small decline in the HCC diagnosis rate despite a much greater reduction in the HCC screening rate. In addition, while screening declined irrespective of liver disease severity, HCC diagnosis declined only in patients with less severe liver disease (low FIB-4 or MELD-Na). Our findings suggest that VA providers may have been prioritizing HCC screening for patients with more advanced liver disease or at greater risk of developing HCC, even before and after the pandemic. As an effort to guide post-pandemic screening prioritization, the aforementioned HCC risk calculator(8, 9) was also integrated into the Cirrhosis-Dashboard after March 2020. However, post-pandemic HCC screening rates declined similarly irrespective of risk category. Although further studies are needed to evaluate the long-term effects of implementing such a calculator, our early data suggests there was minimal change in risk-based HCC screening at least during the first 6 months post-pandemic.
Despite our large cohort size, our study has several limitations. Veterans are predominantly male. We also defined HCC diagnosis based on when HCC was first established within the VA system. Some HCC cases may have been diagnosed earlier, outside of the VA. Lastly, as the Cirrhosis-Dashboard does not capture all HCC screening performed outside of the VA, screening rates may have been underestimated.
COVID-19 had an unfavorable impact on HCC screening and more importantly, diagnosis rates. Patients with a high FIB-4 score and a high estimated annual risk of HCC would benefit most from targeted efforts to improve access to HCC screening. Our early findings suggest that despite the implementation of an HCC risk calculator, patients at higher risk for HCC were not substantially more likely to receive screening; thus, there is room for improvement. Although the pandemic has presented new challenges to delivering cirrhosis care, it has also provided new opportunities to optimize HCC screening and diagnosis among patients with cirrhosis.
Supplementary Material
Acknowledgements:
Financial Support:
This study was supported in part by NIH T32DK007742 to NJK and by the Department of Veterans Affairs, CSR&D grant COVID19-8900-11 to GNI. Grant funders were not involved in the study design, data collection, analysis, interpretation of the data, or the writing of this manuscript.
Footnotes
Potential Competing Interests: None
References
- 1.AASLD. Clinical Best Practice Advice for Hepatology and Liver Transplant Providers During the COVID-19 Pandemic: AASLD Expert Panel Consenus Statemtn; 2020. [DOI] [PMC free article] [PubMed]
- 2.Tapper EB, Asrani SK. The COVID-19 pandemic will have a long-lasting impact on the quality of cirrhosis care. J Hepatol 2020;73:441–445. [DOI] [PMC free article] [PubMed] [Google Scholar]
- 3.Mehta N, Parikh N, Kelley RK, et al. Surveillance and Monitoring of Hepatocellular Carcinoma During the COVID-19 Pandemic. Clin Gastroenterol Hepatol 2020. [DOI] [PMC free article] [PubMed] [Google Scholar]
- 4.Boettler T, Newsome PN, Mondelli MU, et al. Care of patients with liver disease during the COVID-19 pandemic: EASL-ESCMID position paper. JHEP Rep 2020;2:100113. [DOI] [PMC free article] [PubMed] [Google Scholar]
- 5.Kim NJ, Jacob DA, Ioannou GN, et al. Rates and Predictors of Undergoing Different Hepatocellular Carcinoma Screening Tests in Patients With Cirrhosis. Am J Gastroenterol 2020. [DOI] [PubMed] [Google Scholar]
- 6.Aby ES, Winters AC, Lin J, et al. A Telephone and Mail Outreach Program Successfully Increases Uptake of Hepatocellular Carcinoma Surveillance. Hepatol Commun 2020;4:825–833. [DOI] [PMC free article] [PubMed] [Google Scholar]
- 7.Rogal SS, Yakovchenko V, Gonzalez R, et al. The Hepatic Innovation Team Collaborative: A Successful Population-Based Approach to Hepatocellular Carcinoma Surveillance. Cancers (Basel) 2021;13. [DOI] [PMC free article] [PubMed] [Google Scholar]
- 8.Ioannou GN, Green P, Kerr KF, et al. Models estimating risk of hepatocellular carcinoma in patients with alcohol or NAFLD-related cirrhosis for risk stratification. J Hepatol 2019;71:523–533. [DOI] [PMC free article] [PubMed] [Google Scholar]
- 9.Ioannou GN, Green PK, Beste LA, et al. Development of models estimating the risk of hepatocellular carcinoma after antiviral treatment for hepatitis C. J Hepatol 2018;69:1088–1098. [DOI] [PMC free article] [PubMed] [Google Scholar]
- 10.Mahmud N, Kaplan DE, Goldberg DS, et al. Changes in Hepatocellular Carcinoma Surveillance and Risk Factors for Non-Completion in the VHA Cohort During the COVID-19 Pandemic. Gastroenterology 2021. [DOI] [PMC free article] [PubMed] [Google Scholar]
- 11.Toyoda H, Huang DQ, Le MH, et al. Liver Care and Surveillance: The Global Impact of the COVID-19 Pandemic. Hepatol Commun 2020. [DOI] [PMC free article] [PubMed] [Google Scholar]
- 12.Amaddeo G, Brustia R, Allaire M, et al. Impact of COVID-19 on the management of hepatocellular carcinoma in a high-prevalence area. JHEP Rep 2021;3:100199. [DOI] [PMC free article] [PubMed] [Google Scholar]
- 13.Zeng G, Gill US, Kennedy PTF. Prioritisation and the initiation of HCC surveillance in CHB patients: lessons to learn from the COVID-19 crisis. Gut 2020. [DOI] [PMC free article] [PubMed] [Google Scholar]
- 14.Boettler T, Marjot T, Newsome PN, et al. Impact of COVID-19 on the care of patients with liver disease: EASL-ESCMID position paper after 6 months of the pandemic. JHEP Rep 2020;2:100169. [DOI] [PMC free article] [PubMed] [Google Scholar]
Associated Data
This section collects any data citations, data availability statements, or supplementary materials included in this article.