

Abstract
Primary airway epithelial cells (pAECs) cultivated at air-liquid interface (ALI) conditions are widely used as surrogates for human in vivo epithelia. To extend the proliferative capacity and to enable serially passaging of pAECs, conditional reprogramming (cr) has been employed in recent years. However, ALI epithelia derived from cr cells often display functional changes with increasing passages. This highlights the need for thorough validation of the ALI cultures for the respective application. In our study, we evaluated the use of serially passaged cr nasal epithelial cells (crNECs) as a model to study SARS-CoV-2 infection and effects on ion and water transport. NECs were obtained from healthy individuals and cultivated as ALI epithelia derived from passages 1, 2, 3, and 5. We compared epithelial differentiation, ion and water transport, and infection with SARS-CoV-2 between passages. Our results show that epithelia maintained major differentiation characteristics and physiological ion and water transport properties through all passages. However, the frequency of ciliated cells, short circuit currents reflecting epithelial Na+ channel (ENaC) and cystic fibrosis transmembrane conductance regulator (CFTR) activity and expression of aquaporin 3 and 5 decreased gradually over passages. crNECs also expressed SARS-CoV-2 receptors angiotensin converting enzyme 2 (ACE2) and transmembrane serin2 protease 2 (TMPRSS2) across all passages and allowed SARS-CoV-2 replication in all passages. In summary, we provide evidence that passaged crNECs provide an appropriate model to study SARS-CoV-2 infection and also epithelial transport function when considering some limitations that we defined herein.
Keywords: airway epithelial culture, conditional reprogramming, nasal epithelial cells, SARS-CoV-2
INTRODUCTION
Airway diseases rank among the most frequent causes of disease and death worldwide (1). Besides prevalent chronic inflammatory diseases such as asthma or chronic obstructive pulmonary disease (COPD) (1–3), emerging respiratory viruses, like SARS-CoV-2, cause health issues of global significance (4–6). Epithelia lining the air-facing surfaces along the airway tree are key players in the onset and progression of airway diseases (7–9). Airway epithelia are covered by a thin fluid layer, the apical surface liquid (ASL) (10, 11). Adjustment of ASL volume is essential for efficient mucociliary clearance and gas exchange (12) and depends on regulated, transepithelial ion and water transport. In particular, sodium resorption via epithelial Na+ channel (ENaC) and chloride secretion via cystic fibrosis transmembrane conductance regulator (CFTR) and calcium dependent chloride channels critically regulate ASL volume by balancing resorption and secretion of ions and water, respectively (12, 13). Transepithelial water transport is also dependent on epithelial expression of aquaporin (AQP) channels (14, 15). Finally, ASL volume homeostasis depends on the integrity of the tight junctions that form the paracellular diffusion barrier to separate the apical and basolateral compartment and prevent leakage of high molecular weight proteins into the ASL (16). Not surprisingly, dysregulated transepithelial ion and water transport or epithelia integrity accounts for the pathogenesis of inflammatory and infectious diseases (17–19). Severely dysregulated airway epithelial fluid homeostasis has been described in viral infection, for instance with influenza virus (20, 21). Apart from direct pathogen effects, accompanying cytokine- and chemokine-driven inflammation modulates ion transport and barrier function (22–24). Recently, it was proposed that SARS-CoV-2 infection may lead to dysbalanced ion transport as a consequence of impaired ENaC function (25–27). Although such ENaC dysfunction would result in lung edema in severe SARS-CoV-2 infection, this has yet to be demonstrated experimentally.
Mechanistic insights into the onset and progression of epithelial dysfunction are required to facilitate development of targeted therapies to counteract infection- and inflammation-induced lung pathologies. In this context, cell cultures derived from primary airway epithelial cells (pAECs) are widely used to study epithelial functions (28). These pAECs are cultivated at air-liquid interface (ALI) conditions to obtain differentiated epithelia that mimic cellular composition and functional properties of airway epithelia in vivo. (29–31). Nasal epithelial cells (NECs) line the most proximal airways at the anatomic entry for airborne noxae and pathogens. Primary NECs (pNECs) can be obtained noninvasively from both healthy and diseased subjects for research purposes (32–35) and display a useful model to study the pathogenesis of infectious and inflammatory airway diseases. Recently, NEC cultures have been discussed as a suitable model to study aspects of SARS-CoV-2 infection (36). A major limitation for such studies is the relatively small cell number obtained from single donors via nasal brushings. Passaging and expansion of cells are often required to obtain sufficient cells to generate ALI cultures to perform functional studies. However, under conventional culture conditions, proliferation of pAECs (including pNECs) is limited to three to four population doublings (37). With further expansion, pAECs slow proliferation and lose their ability to differentiate. Within the last decade, conditional reprogramming (CR) has been established to improve pNEC expansion (37–39). Cr depends on the coculture of epithelial cells with postmitotic embryonic mouse fibroblasts of the NIH-3T3 cell line and the ROCK inhibitor Y-27632. The method successfully increases proliferation capacity of pAECs and extends the number of population doublings (28, 38, 39).
A suitable model to investigate viral infection and its effect on airway epithelial functions requires a well-differentiated epithelium reconstituting the main morphological and functional properties of the epithelium in vivo. Importantly, pAECs proliferated under cr conditions (crAECs) keep the ability to differentiate under ALI conditions following removal of feeder cells and Y-27362 and maintain main lineage characteristics (37–40). However, Gentzsch et al. (41) reported morphological changes and a decrease of CFTR currents in higher passages of crNECs, indicating that multiple passaging may suppress differentiation. Furthermore, expression of specific receptors for viral infection and/or cytokines and chemokines is required for functional studies of viral infection and inflammation. crAECs have been reported to generate a physiologic antiviral response on exposure to double-stranded RNA mimicking viral infection (40). Yet, this issue has not been studied comprehensively and further studies, including direct viral infection, are required.
Within this study, we therefore evaluated the use of passaged crNECs as a suitable in vitro model of the nasal epithelium and its use to study the effects of SARS-CoV-2 viral infection on epithelial function. We investigated cell differentiation, barrier function, ion and water transport, and susceptibility to infection with SARS-CoV-2 and provide the first comparative analysis of these epithelial functions in ALI cultures derived from either pNECs or crNECs passaged more than five times.
MATERIALS AND METHODS
Cell Culture and Conditional Reprogramming of Nasal Epithelial Cells
See appendix for detailed cell culture protocol. Briefly, NIH-3T3 cells (Kerafast, Boston, MA) were mitotically inactivated using mitomycin C (Merck, Darmstadt, Germany) 4 µg/mL and used as feeder cells for NECs. Isolation of NECs was approved by the Ethics Committee of Ulm University, and written consent was obtained from all donors. Cells were obtained from 11 healthy individuals (6 female and 5 male) aged between 23 and 51 yr via brushing of inferior turbinates using Cytobrush Plus GT (CooperSurgical, The Hague, the Netherlands). For quantification of population doublings, half the cells collected from each donor were proliferated under conventional culture conditions (pNECs) or under cr conditions (crNECs) as described previously (41). Briefly, crNECs were proliferated in the presence of feeder cells and Y-27632 10 μM (Tocris Bioscience, Bristol, UK) to subconfluence and passaged every 7th day. Feeder cells were removed by differential trypsinization, and the number of crNECs was determined using a Neubauer counting chamber. For functional investigations, crNECs were differentiated on Transwell filter inserts (Corning, Wiesbaden, Germany) under ALI conditions. Experiments were performed at day 24 after ALI from cells of the passages 1, 2, 3, and 5.
Transepithelial Electrical Resistance
Transepithelial electrical resistance (TEER) was determined via impedance spectroscopy using the cellZscope (NanoAnalytics, Münster, Germany) as described previously (15, 24, 42). For measurements, the basal electrode was covered with 500 µL of cell culture medium (ALI medium). After inserting filter inserts, 100 µL of ALI medium was added to the apical surface, and the apical electrode was placed into the apical liquid. The measurements were performed immediately after positioning of apical electrodes. Data acquisition and analysis were performed using the software package provided with the instrument (NanoAnalytics, Münster, Germany).
ASL Measurement
ASL volumes of epithelia cultivated at ALI conditions were determined using the deuterium oxide (D2O) dilution method as described previously (15, 43). Briefly, 25 µL of D2O containing 0.9% NaCl was added to apical surface of epithelia and got mixed up with ASL. Afterward, the mixture was analyzed via attenuated total reflection midinfrared spectroscopy using an α II FT-IR spectrometer (Bruker, Ettlingen, Germany) to measure water concentrations in D2O. ASL volumes were calculated as described previously (15, 43). To measure water resorption rates, 25 µL of 0.9% NaCl solution was added to the apical surface of epithelia, and epithelia were incubated at 37°C, 5% CO2, and 95% humidity for 8 h. The remaining volume got mixed up with 25-µL D2O with 0.9% NaCl, and water concentration was measured as described above. Resorption rates were calculated as follows: (ASL8 h – ASLALI)/incubation time with ASL8 h = ASL after 8 h and ASLALI = ASL at ALI conditions.
Ussing Chamber
Transepithelial ion transport was investigated in Ussing chamber experiments as short-circuit currents (ISC) using the easy mount Ussing chamber system (Physiological Instruments, San Diego, CA), a custom-made amplifier (Boehringer Ingelheim, Biberach, Germany), and LabView software package (National Instruments, Munich, Germany). Ion channel activity was modulated after ISC reached a steady state using the following compounds: amiloride 100 µM, forskolin (FSK) 50 µM, and CFTRinh-172 100 µM (all from Merck, Darmstadt, Germany). ISC responses to the added compounds are given as ΔISC (difference between ISC before and after compound addition). See appendix for more details.
qRT-PCR
Semiquantitative qPCR was performed from total RNA isolated from epithelia cultured at ALI conditions using Quantitect RT-PCR primer assays (Qiagen, Hilden, Germany). Primer sequence for SARS-CoV-2 nucleocapsid was as follows: forward: taatcagacaaggaactgatta; reverse: cgaaggtgtgacttccatg. See appendix for detailed protocol.
Immunocytochemistry
Immunocytochemistry in ALI cultures was performed using the following primary antibodies: anti-ZO1 (Cat. No. ab99462, abcam, Cambridge, UK; RRID:AB_10673205), anti-acetylated α-tubulin (Cat. No. T7451, Sigma Aldrich via Merck; RRID:AB_609894), anti-AQP3 (Cat. No. ab125219, abcam, Cambridge, UK; RRID:AB_11000698), anti-AQP5 (Cat. No. ab92320, abcam, Cambridge, UK; RRID:AB_2049171), anti-FOXJ1 (Cat. No. 14–9965-82, Thermo Fisher Scientific, Dreieich, Germany; RRID:AB_1548835), anti-MUC5AC (Cat. No. MA1-21907, Thermo Fisher Scientific, Dreieich, Germany; RRID:AB_560214), and anti-p63 (Cat. No. ab124762, abcam, Cambridge, UK; RRID:AB_10971840). Primary antibodies were diluted 1:300 in PBS containing 0.5% BSA and 0.1% Triton-X-100, and cells were incubated with primary antibodies for 1 h at room temperature. Secondary antibodies were Alexa Fluor 488 donkey anti-rabbit IgG, Alexa Fluor 568 donkey anti-goat IgG, and Alexa Fluor 647 donkey anti-mouse IgG (all from Thermo Fisher Scientific, Dreieich, Germany). Hoechst 33342 (Thermo Fisher Scientific, Dreieich, Germany) was used for nuclear staining. Secondary antibodies were diluted 1:800 in PBS containing 0.5% BSA and 0.1% Triton-X-100, and cells were incubated with secondary antibodies for 30 min at room temperature. Images were acquired on an inverted confocal microscope (Leica TCS SP5, Leica, Germany) using a ×40 lens (Leica HCX PL APO CS ×40 1.25 oil). Four images of different, randomly selected areas were taken from each individual filter. Images represent sections with 250–500 cells each. Image analysis was performed using latest version of ImageJ software (NIH, Bethesda, MD). Total cell number or the number of cells reaching the surface was determined in maximum projections of z-series by counting from Hoechst or ZO-1 staining, respectively. The number of cells positive for FOXJ1, TP63, AQP3, AQP5, MUC5AC, and acetylated α-tubulin was counted accordingly and normalized to total cell number (FOXJ1, TP63) or surface cell number (remaining). Values obtained from four images of one filter were averaged for further analysis. See appendix for detailed protocol.
Infection with SARS-CoV-2
CR nasal epithelial cells of passages 1–3 and 5 (P1, P2, P3, and P5) were cultivated as ALI epithelia and infected with SARS-CoV-2 Viral isolate BetaCoV/France/IDF0372/2020 [multiplicity of infection (MOI) 1, 6 h]. Forty-eight hours after infection, cells were harvested for microscopy and qRT-PCR analysis.
Statistical Analysis
GraphPad Prism was used for statistical analysis. As data sets were not normally distributed according to Anderson-Darling test, data are presented as box plots showing median, quartiles (boxes), and minimum/maximum (whiskers). Data within the text are given as median [interquartile range (IQR)], as indicated. Data sets were compared using appropriate nonparametric tests and when necessary, P values were corrected for multiple comparisons. Number of replicates reflects the number of individual ALI epithelia, if not indicated different. Experiments were performed from ALI epithelia derived from at least six different donors (three donors for SARS-CoV-2 experiments).
RESULTS
Proliferation of Passaged pNECs and crNECs
It has been reported that cr increases the proliferative capacity of pAECs compared with conventional culture techniques (36, 37, 41). To confirm this effect in our experimental setup, population doublings were determined in pNECs cultured under conventional or cr conditions, respectively (Fig. 1A). Consistent with published literature, population doublings of pNECs increased with a median of 7.07 (IQR 3.29) cumulative population doublings until day 21 and growth ceased between days 21 and 28 when cultured under conventionally conditions. Due to proliferation stop, growth curve of conventional NECs ends at day 28. In contrast, number of cumulative population doublings of crNECs continuously increased in a near-linear manner until day 35 with median 15.02 (IQR 2.55) and 17.27 (IQR 1.43) population doublings at days 28 and 35, respectively. Population doublings after the first 7 days did not differ between conventionally and cr-cultured NEC. However, they were significantly lower for conventional NECs from day 14 onward with P = 0.0093, P = 0.0046, and P = 0.0023 for days 14, 21, and 28, respectively (multiple Mann-Whitney tests with Bonferroni correction for multiple comparisons; Fig. 1B). This shows that the cr protocol used in the present study overcomes pNEC proliferation limitations within the investigated 35 days, equivalent to five passages.
Figure 1.
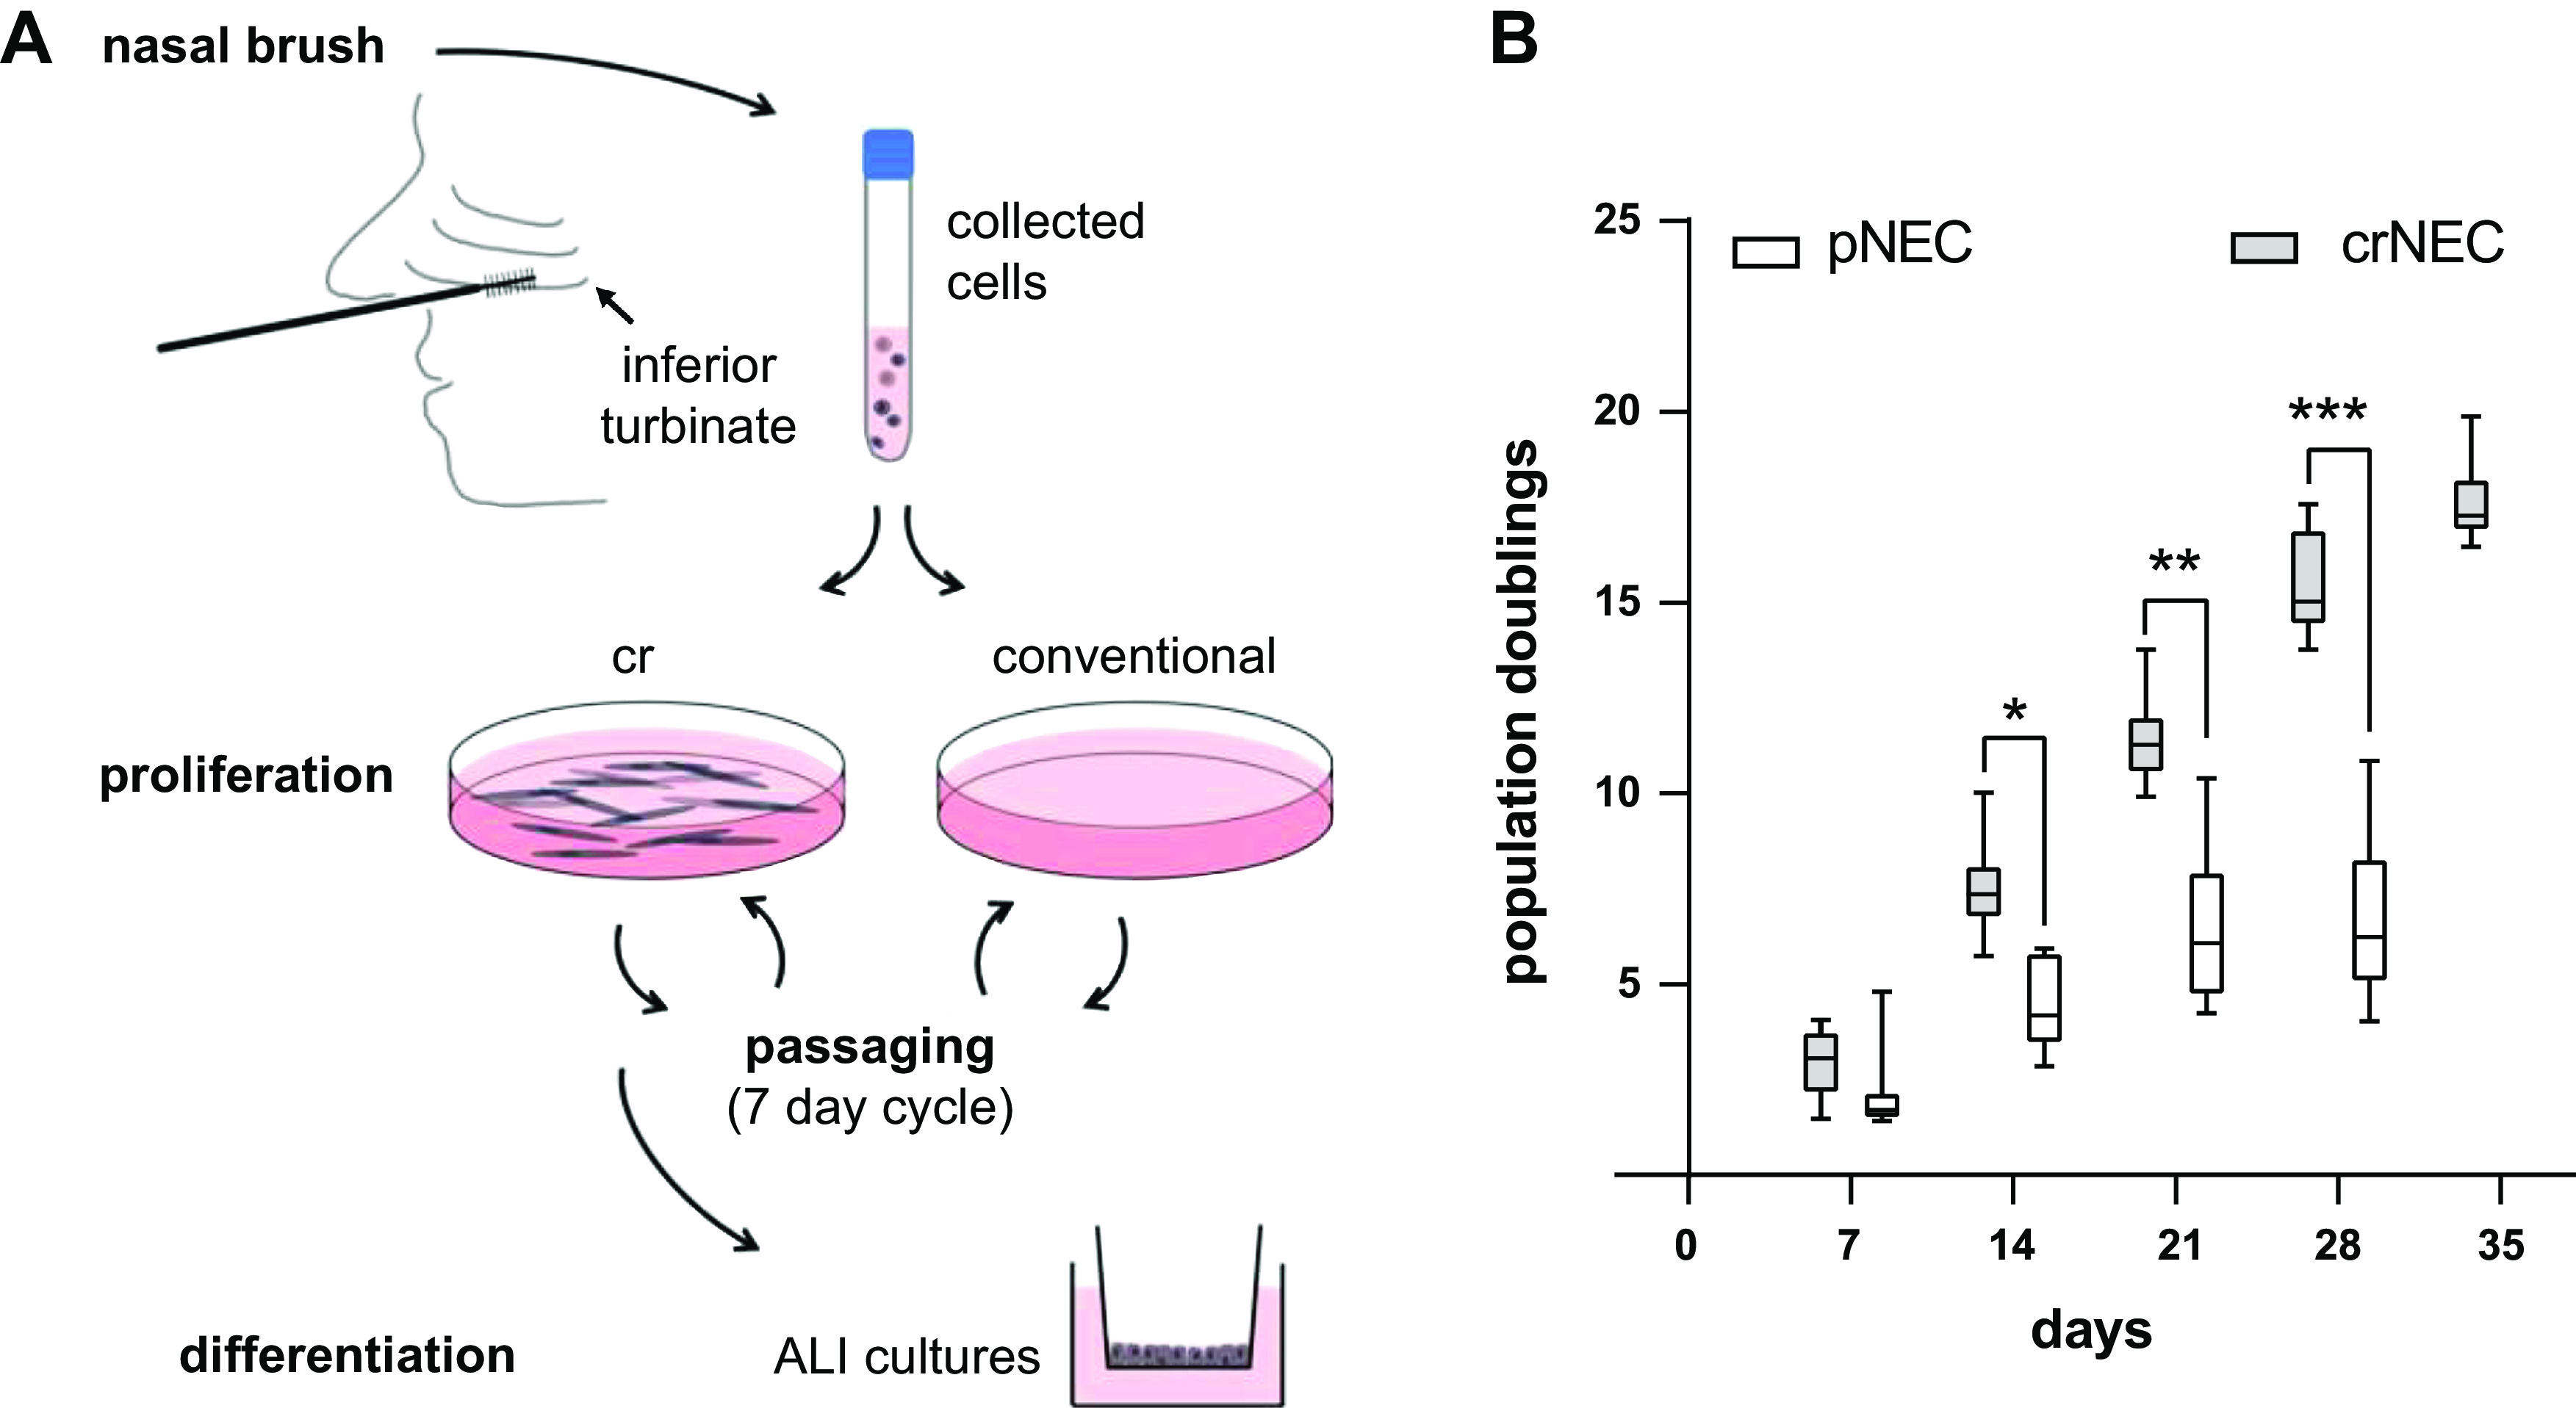
A: schematically summarizes the culture protocol of nasal epithelial cells (NECs). NECs were obtained via brushing from the inferior nasal turbinate of healthy individuals. For growth curves, half of the cell sample was cultured at conventional culture conditions and half using conditional reprogramming (cr) in the presence of mitotically inactivated embryonic mouse fibroblasts (3T3-J2) as feeder cells and the ROCK inhibitor Y-27632 (10 µM). Cells were passaged in a 7-day cycle until passage 5. For generation of air-liquid interface (ALI) epithelia, NECs were proliferated at cr conditions (crNECs) and differentiated at ALI on porous filter membranes at passages 1, 2, 3, and 5. B: primary NECs cultured at conventional conditions (pNEC) and crNECs were passaged after 7, 14, 21, 28, and 35 days, respectively. Cell counts of passaged cells were used to calculate number of population doublings from the seeded cell amount. The graph shows cumulative population doublings at the indicated total culture time. Box plots give data as median, percentiles (box), and minimum/maximum (whiskers). Growth of conventionally cultured NECs ceased between days 21 and 28. In contrast, cr continuously proliferated until day 35. Cumulative population doublings of conventionally cultured cells were significantly reduced compared with cr after 14, 21, and 28 days (P = 0.0093, P = 0.0046, and P = 0.0023 for days 14, 21, and 28; multiple Mann–Whitney tests with Bonferroni correction for multiple comparisons; n = 7 donors). *P < 0.05, **P < 0.01, and ***P < 0.001.
Differentiation Capacity of crNECs over Several Passages
Functional properties of the airway epithelium depend on epithelial cell differentiation cellular composition to recapitulate distinct cell type characteristic for the airway epithelium (8, 44). We therefore investigated markers for the main cell types of airway epithelia in ALI cultured of passaged crNEC: ciliated cells (FOXJ1+, acetylated α-tubulin+), mucus secreting cells (MUCAC+, MUC5B+), and basal cells (p63+). RT-PCR experiments revealed that FOXJ1 transcription levels decreased in crNECs from passage 3 onward when compared with passage 1 (P = 0.0120 and P < 0.0001 for passages 3 and 5, respectively; Fig. 2A). Transcription levels for MUC5AC and MUC5B increased in crNECs of passages 5 (P < 0.0001) and 3 (P = 0.0002), respectively (Fig. 2, B and C). Expression of the proliferation marker P63 did not differ significantly between passages (Fig. 2D). We also investigated expression on the protein level and frequency of individual cell types within epithelia using immunocytochemistry. Markers of ciliated, mucus secreting, and basal cells were detected in all investigated passages (Fig. 3E), indicating that pNECs maintain the ability to differentiate into characteristic cell types of airway epithelia (Fig. 2E). However, in accordance with RT-PCR data, the proportion of cells expressing the transcription factor FOXJ1 and acetylated α-tubulin (markers for ciliated cells) decreased in passage 5 epithelia compared with passage 1 epithelia (P = 0.0062 and P = 0.0005, respectively; Fig. 2, F and G). The number of mucus positive cells, as indicated by positive staining for MUC5AC (Fig. 2H), and P63-positive cells (Fig. 2I) did not differ between epithelia of different passages. In contrast, MUC5AC transcription levels were elevated in passage 5 epithelia. Altogether, this data indicate a decline in the number of ciliated cells for higher passages of crNECs without significant changes of the number of mucus secreting and proliferating cells.
Figure 2.
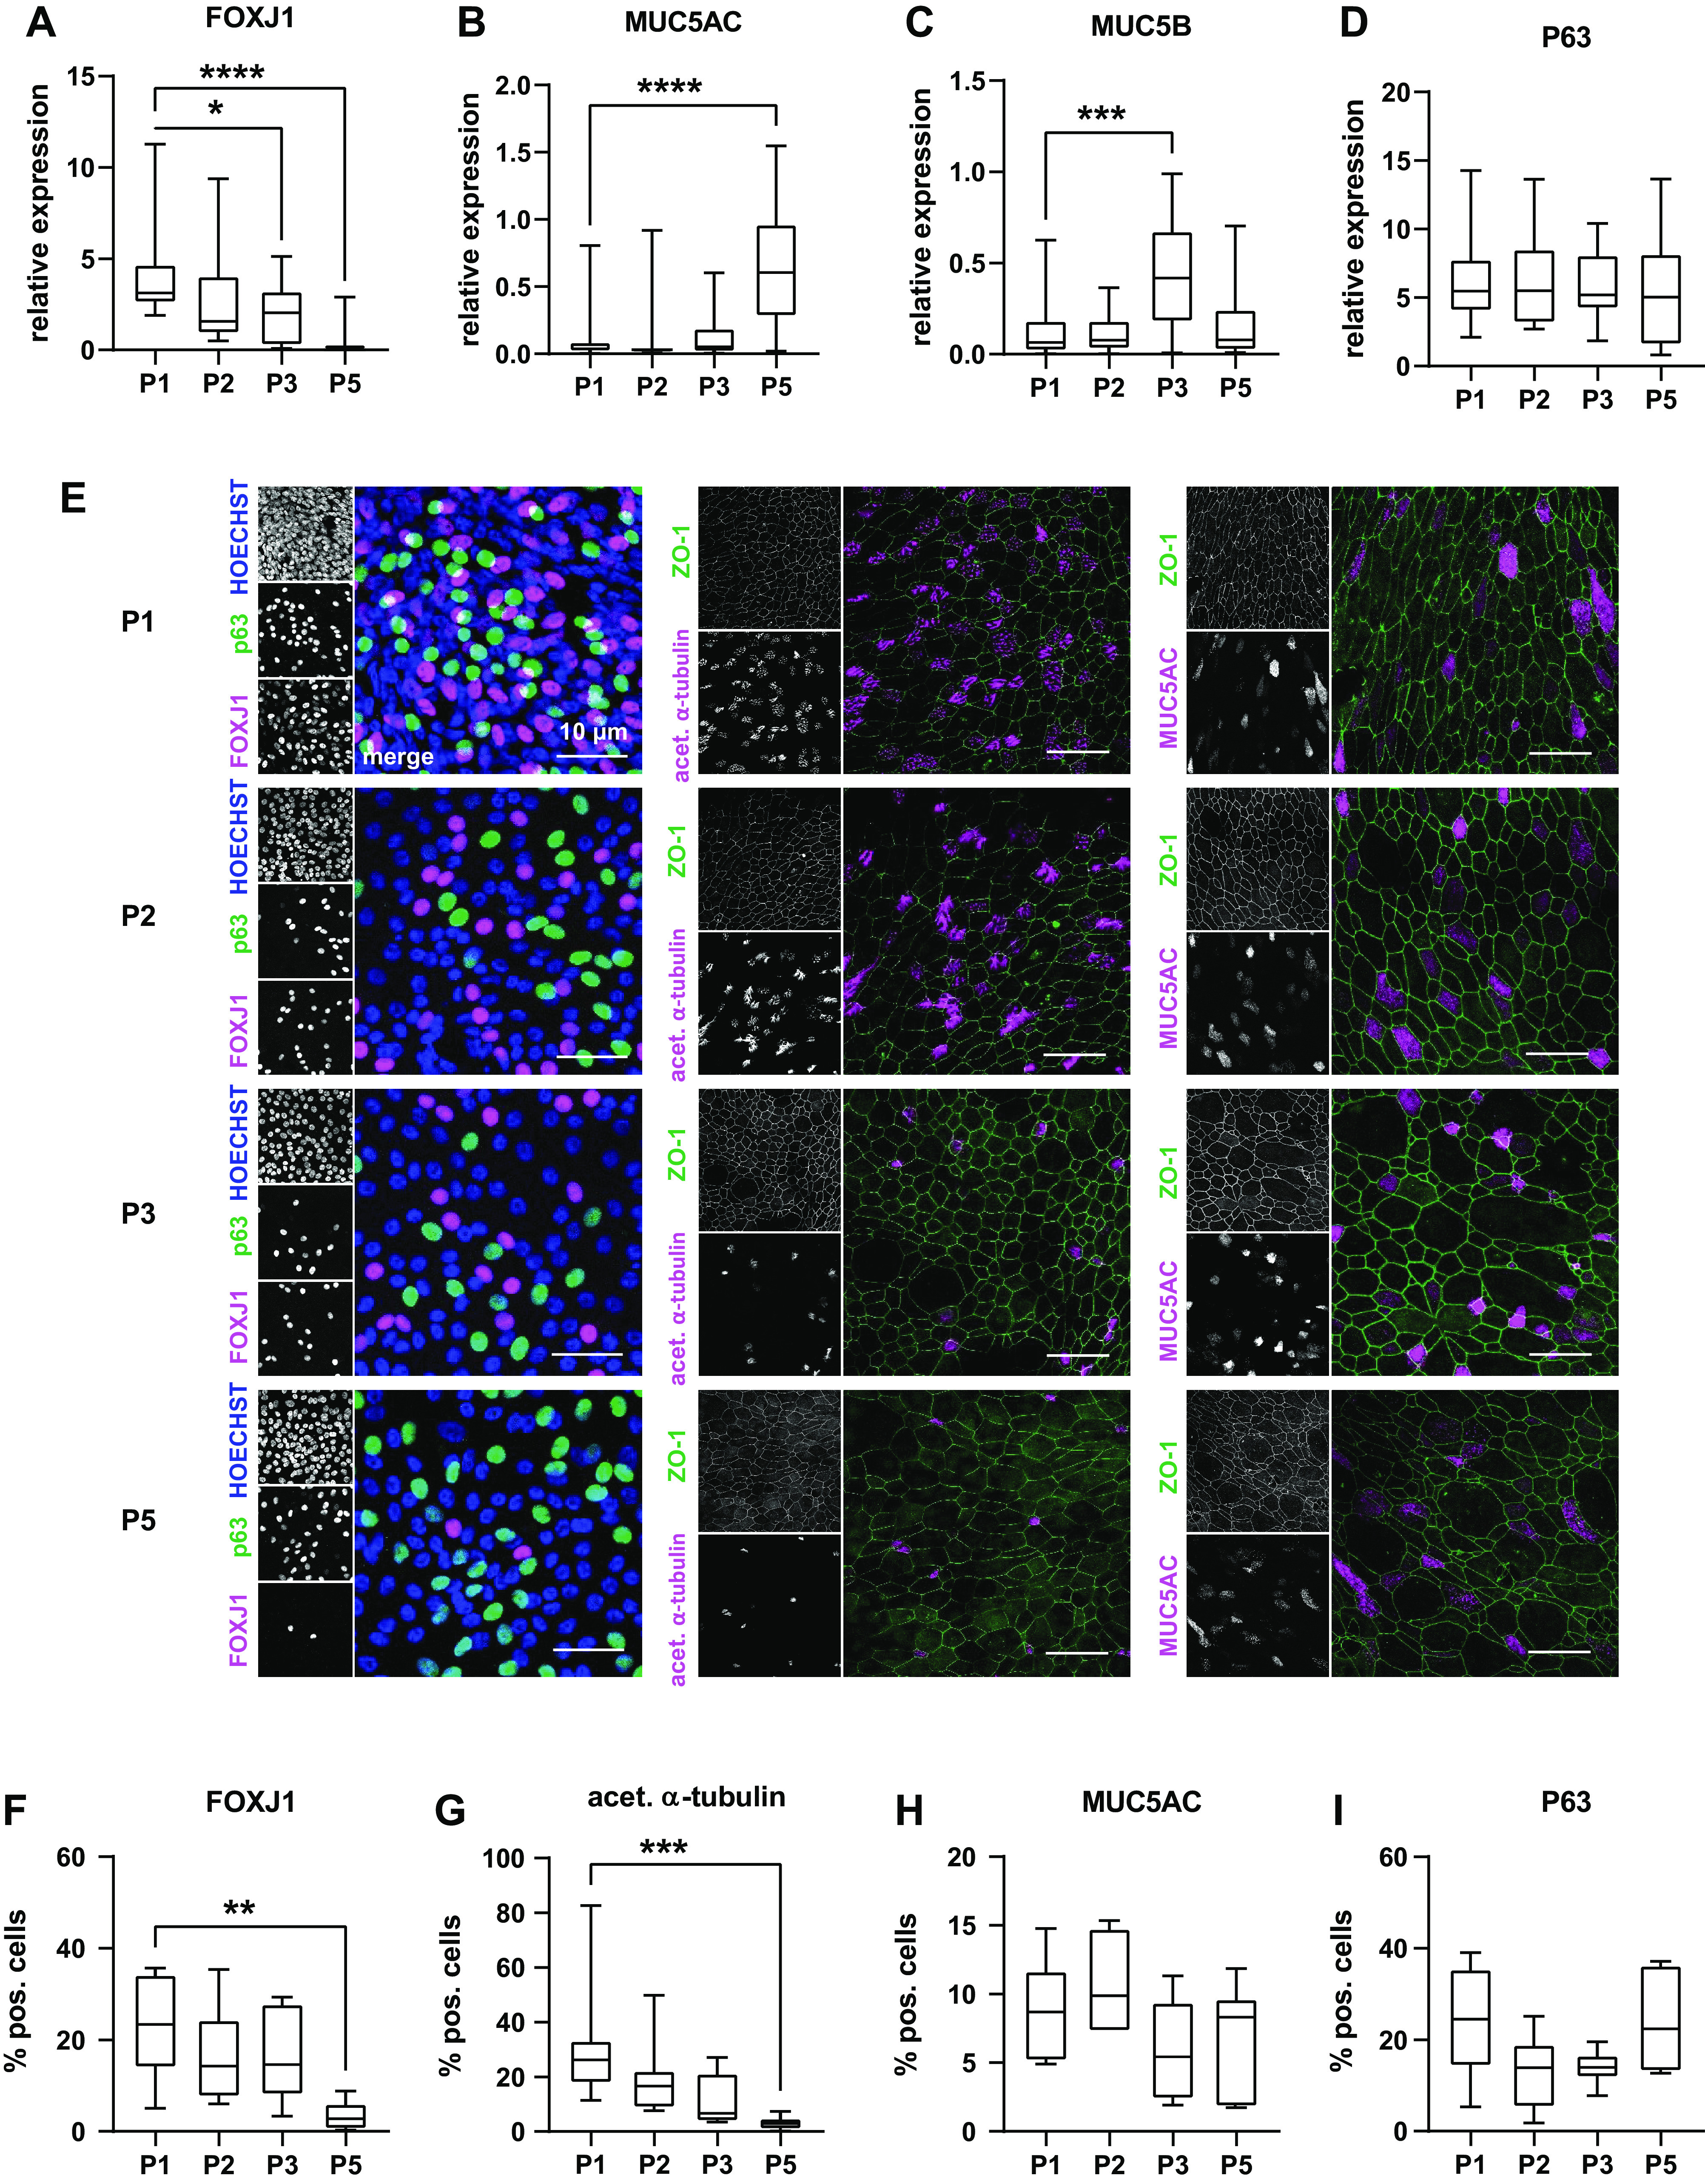
CR nasal epithelial cells of passages 1–3 and 5 (P1, P2, P3, and P5) were cultivated at ALI. A–D: expression of differentiation markers reflecting the main cell types of airway epithelia was determined using semiquantitative qPCR of whole cell lysates. Box plots give data as median, percentiles (box) and minimum/maximum (whiskers). Results are given as relative expression to the housekeeping gene HMBS. Expression levels of respective genes at P2, P3, and P5 were compared with P1 using Kruskal–Wallis test with Dunn’s correction for multiple comparisons. We used FOXJ1 (A) as marker for ciliated cells, MUC5AC (B) and MUC5B (C) as markers for mucus secreting cells, and P63 (D) as marker for basal cells. FOXJ1 was downregulated in P3 and P5 (P = 0.0120 and P < 0.0001). Transcription levels increased in P5 for MUC5AC and P3 for MUC5B (P < 0.001 and P = 0.0002). P63 expression (D) did not differ between passages. (n = 18–24 replicates from 6 donors). E: immunocytochemistry experiments were used to determine frequency of ciliated cells (FOXJ1+, acetylated α-tubulin+), mucus secreting cells (MUCAC+), and basal cells (p63+). P63 and FOXJ1 were counterstained with the nuclear dye Hoechst 33342, the other markers with ZO-1 (F). Images give maximum z-projections of representative sections representing 250–500 cells each. F–I: immunocytochemistry images were analyzed for the percentage of cell positive for differentiation markers of total cell number determined from the respective counterstaining. Box plots give data as median, percentiles (box), and minimum/maximum (whiskers). Abundance of cell types at P2, P3, and P5 were compared with P1 using Kruskal–Wallis test with Dunn’s correction for multiple comparisons. In line with RT-PCR data, number of FOXJ1+ cells (F) decreased at P5 (P = 0.0062). Similarly, number of acetylated α-tubulin+ cells (G) was reduced at P5 (P = 0.0005), indicating decline of ciliated cells. Number of MUCAC+ cells (H) representing mucus secreting cells and P63+ cells (I) representing basal cells did not differ between passages. n = 6–8 donors. ALI, air-liquid interface; CR, conditional reprogramming. *P < 0.05, **P < 0.01, ***P < 0.001, and ****P < 0.0001.
Figure 3.
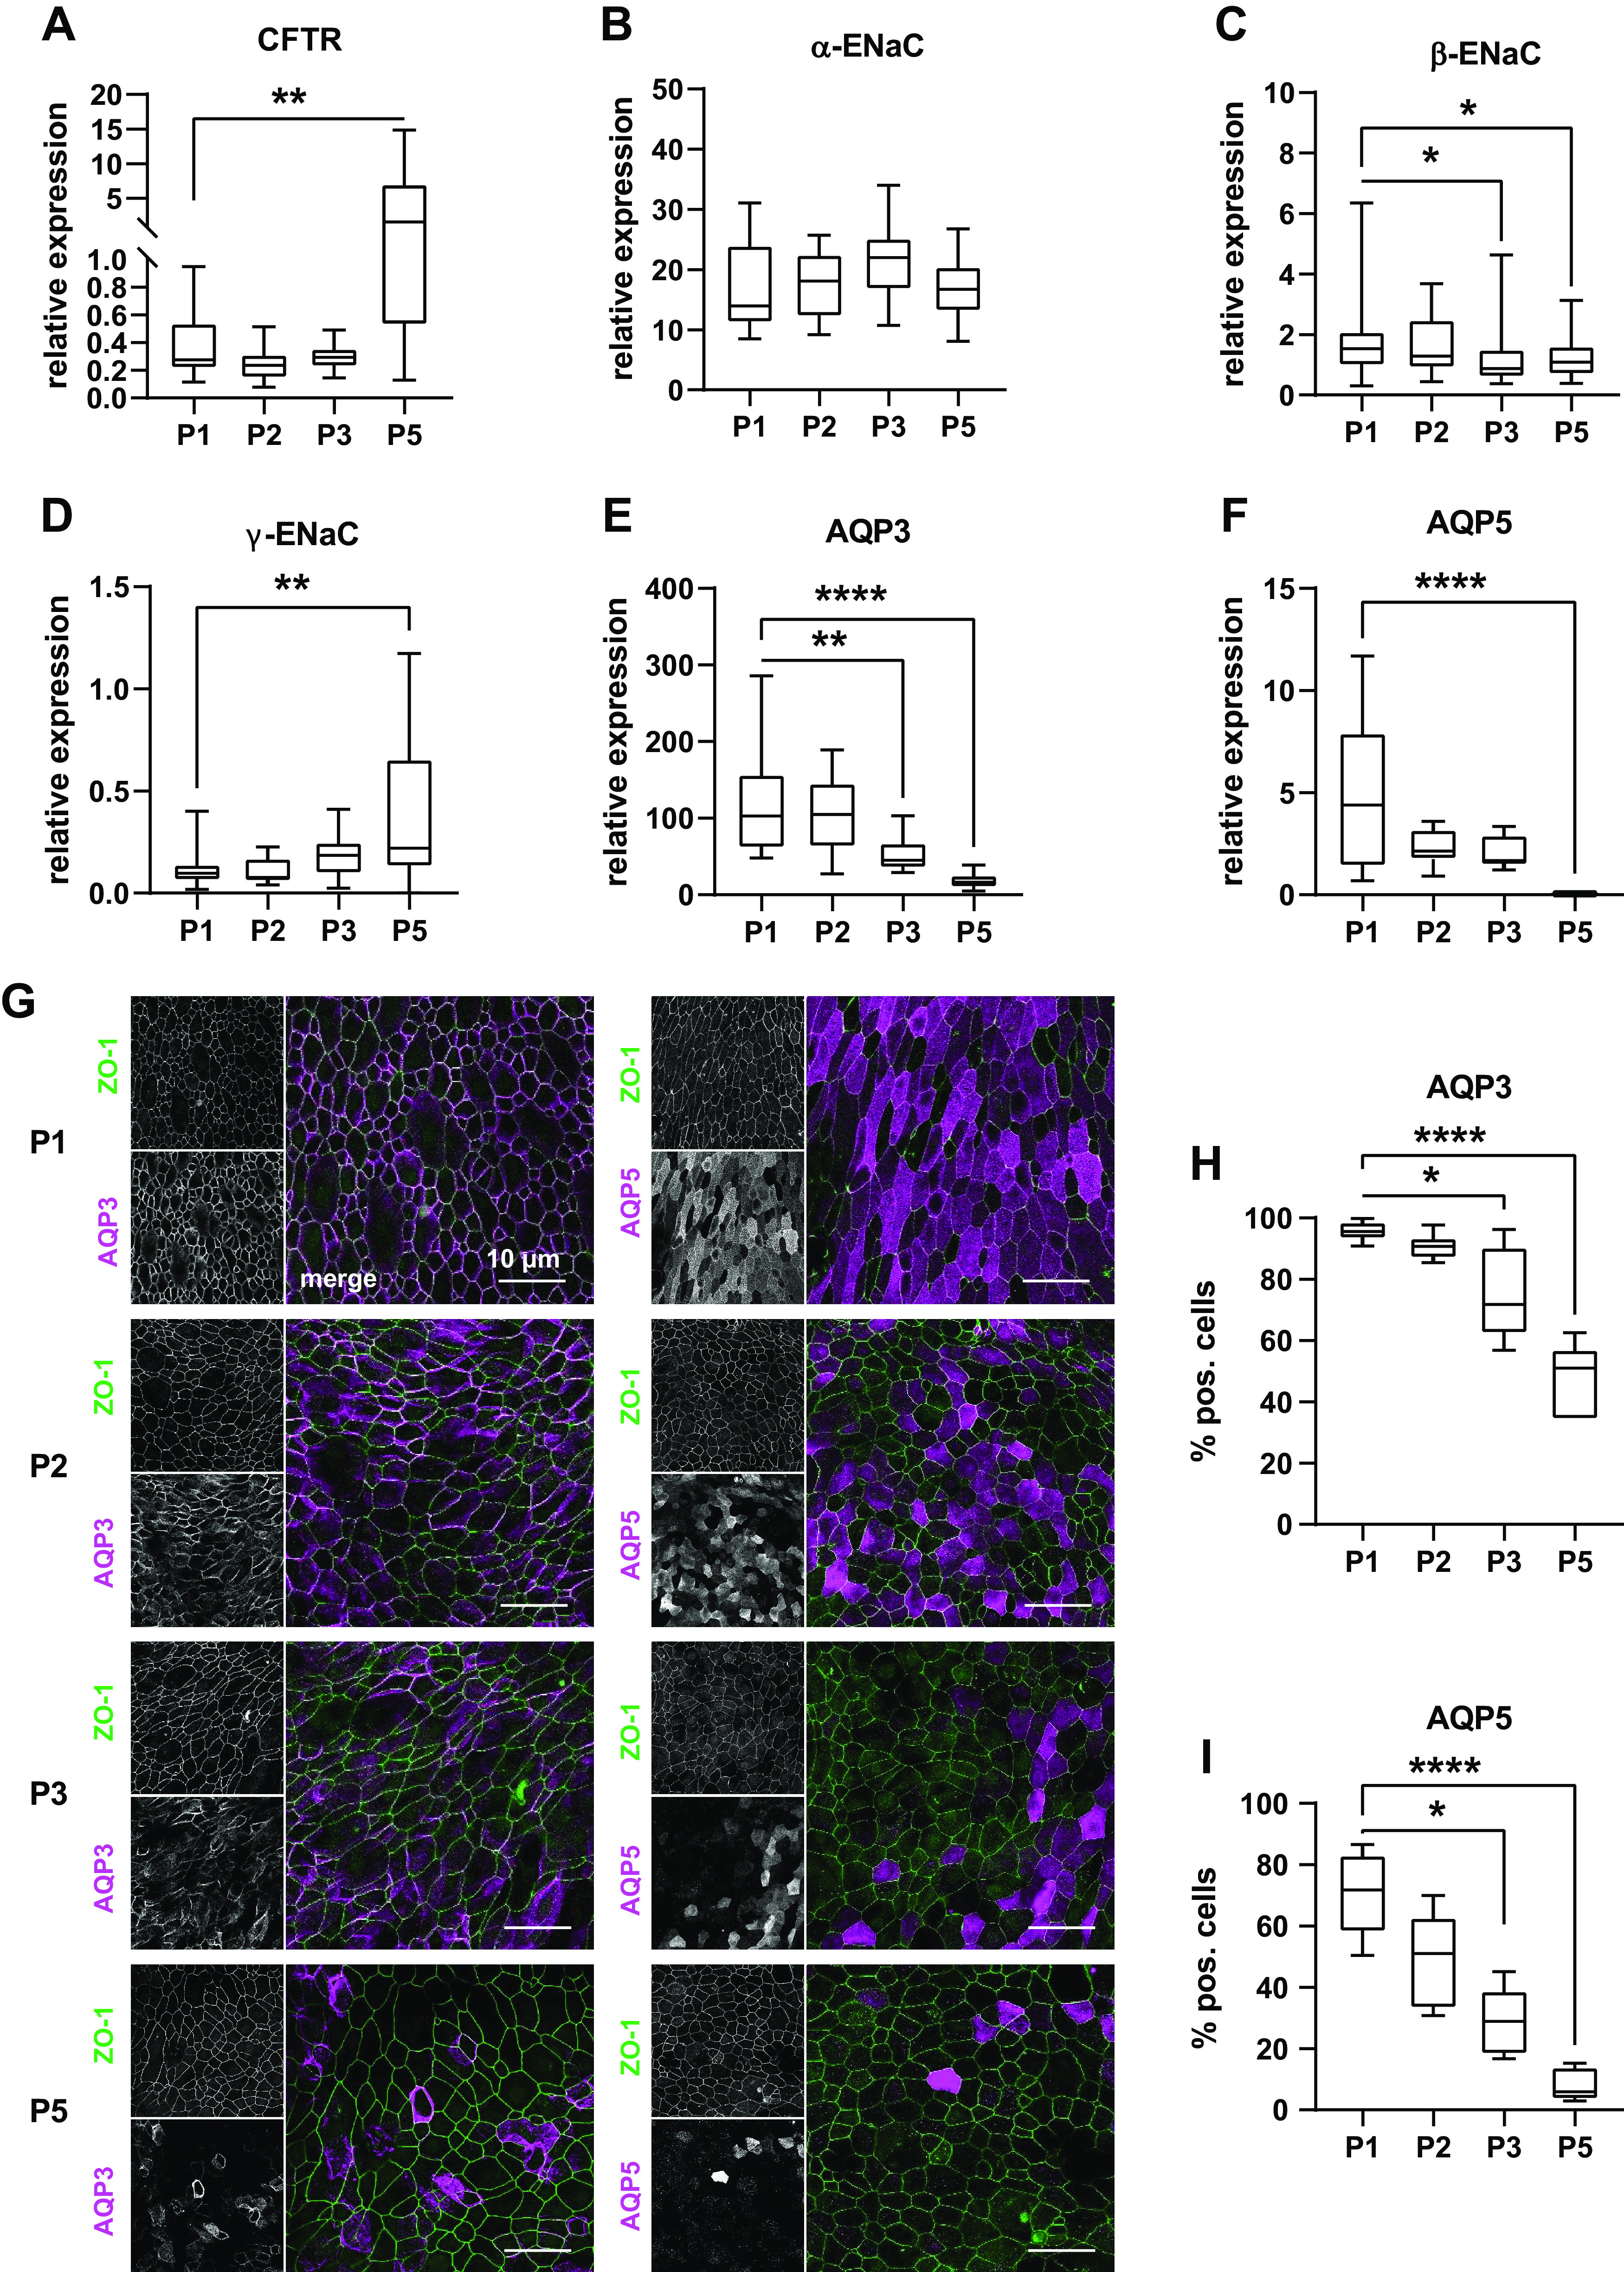
A–F: expression of ion channels and aquaporins (AQP) was determined in ALI epithelia of cr nasal epithelial cells of the passages 1–3 and 5 (P1, P2, P3, and P5) using semiquantitative qPCR of whole cell lysates. Box plots give data as median, percentiles (box), and minimum/maximum (whiskers). Results are given as relative expression to the housekeeping gene HMBS. Expression levels of P2, P3, and P5 were compared with P1 data using Kruskal–Wallis test with Dunn’s correction for multiple comparisons. CFTR expression (A) was upregulated in P5 epithelia (P = 0.0018). α-subunit of ENaC (B) expression did not differ between passages; however, β-subunit expression (C) decreased at P3 and P5 (P = 0.0129 and P = 0.0403) and γ-subunits expression (D) increased at P5 (P = 0.0022). AQP3 (E) expression was reduced at P3 and P5 (P = 0.0012; P < 0.0001) as well as AQP5 expression (F; P = 0.0156 and P < 0.0001 for P3 and P5, respectively), n = 18–25 replicates from 6 donors. G–I: immunocytochemistry experiments were used to further investigate decrease of AQP expression on protein level. AQP3 and AQP5 were counterstained with ZO-1 (G). Images give maximum z-projections of representative sections representing 250–500 cells each. H and I: immunocytochemistry images were analyzed for the percentage of cell positive for differentiation markers of total cell number determined from the respective counterstaining. Box plots give data as median, percentiles (box), and minimum/maximum (whiskers). Abundance of cell types at P2, P3, and P5 were compared with P1 using Kruskal–Wallis test with Dunn’s correction for multiple comparisons. In line with RT-PCR data, number of AQP3+ cells (H) decreased at P3 and P5 (P = 0.0315 and P < 0.0001). Similarly, number of AQP5+ cells (I) was reduced at P3 and P5 (P = 0.0165 and P < 0.0001). n = 6–8 donors. ALI, air-liquid interface; CR, conditional reprogramming. *P < 0.05, **P < 0.01, and ****P < 0.0001.
Ion and Water Transport of crNEC
Next, we investigated the effect of serial passaging on ion and water transport. Besides CFTR- and ENaC-mediated ion transport (45, 46), ASL adjustment of airway epithelia also depends on AQP-mediated water transport (14, 15). Hence, we analyzed expression levels of CFTR, ENaC subunits, as well as AQP3 plus AQP5, the most abundant APQ isoforms in conducting airway epithelia (14, 47). CFTR expression levels did not differ between crNEC epithelia of passages 1–3 but increased in passage 5 (P = 0.0018; Fig. 3A). For passage 5 data of CFTR expression levels, we observed high interdonor variability as reflected by the relatively high IQR. Expression levels of ENaC subunits showed slight decrease of β-subunit transcripts in passages 3 and 5 compared with passage 1 (P = 0.0129 and P = 0.0403, respectively; Fig. 3C). ENaC γ-subunit transcripts increased in passage 5 compared with passage 1 (P = 0.0022; Fig. 3D). Again, we noticed relatively high interdonor variability and correspondent high IQR. AQP3 expression gradually decreased over passages with significant lower transcript levels in passages 3 and 5 epithelia compared with passage 1 (P = 0.0012 and P < 0.0001, respectively; Fig. 3E). For AQP5, we observed a similar trend over passages with significant reduction of expression levels for passage 5 (P < 0.0001; Fig. 3F). In immunocytochemistry experiments, AQP3 and AQP5 were detected in the apical and basolateral membranes, respectively (Fig. 3G). In line with RT-PCR data, the number of AQP3+ and AQP5+ cells markedly decreased over passages (Fig. 3, H and I). Frequency of AQP3+ cells significantly declined from 95.6% (IQR 5.4%) in passage 1 epithelia to median 71.7% (IQR 28.1%) and 51.0% (IQR 22.8%) in passages 3 and 5, respectively (P = 0.0315 and P < 0.0001). Similarly, median frequency of AQP5+ cells was 71.7% (IQR 25.0%) at passage 1 and decreased to 28.89% (IQR 20.72%) and 5.8% (IQR 10.5%) at passages 3 and 5, respectively (P = 0.0156 and P < 0.0001).
TEER was measured as functional correlate for epithelial integrity and barrier function (Fig. 4A). Median TEER of passage 1 epithelia was 599 Ω·cm2 (IQR 234 Ω·cm2). TEER was stable until passage 3, but dropped in passage 5 epithelia to a median of 177 Ω·cm2 (IQR 173 Ω·cm2; P < 0.0001). Ion transport measurements in Ussing chamber experiments (Fig. 4B) revealed a decrease of amiloride sensitive short-circuit current (ISC) as well as forskolin activated ISC and CFTRinh-172-sensitive ISC over passages (Fig. 4, C and D) with significant reduction of ISC in passages 3 and 5 epithelia compared with respective ISC of passage 1 epithelia (P = 0.0011 and P < 0.0001 for amiloride sensitive ISC at passages 3 and 5; P = 0.0203 and P < 0.0001 for forskolin activated ISC at passages 3 and 5; P < 0.0001 for CFTRinh-172-sensitive ISC at both passages 3 and 5).
Figure 4.
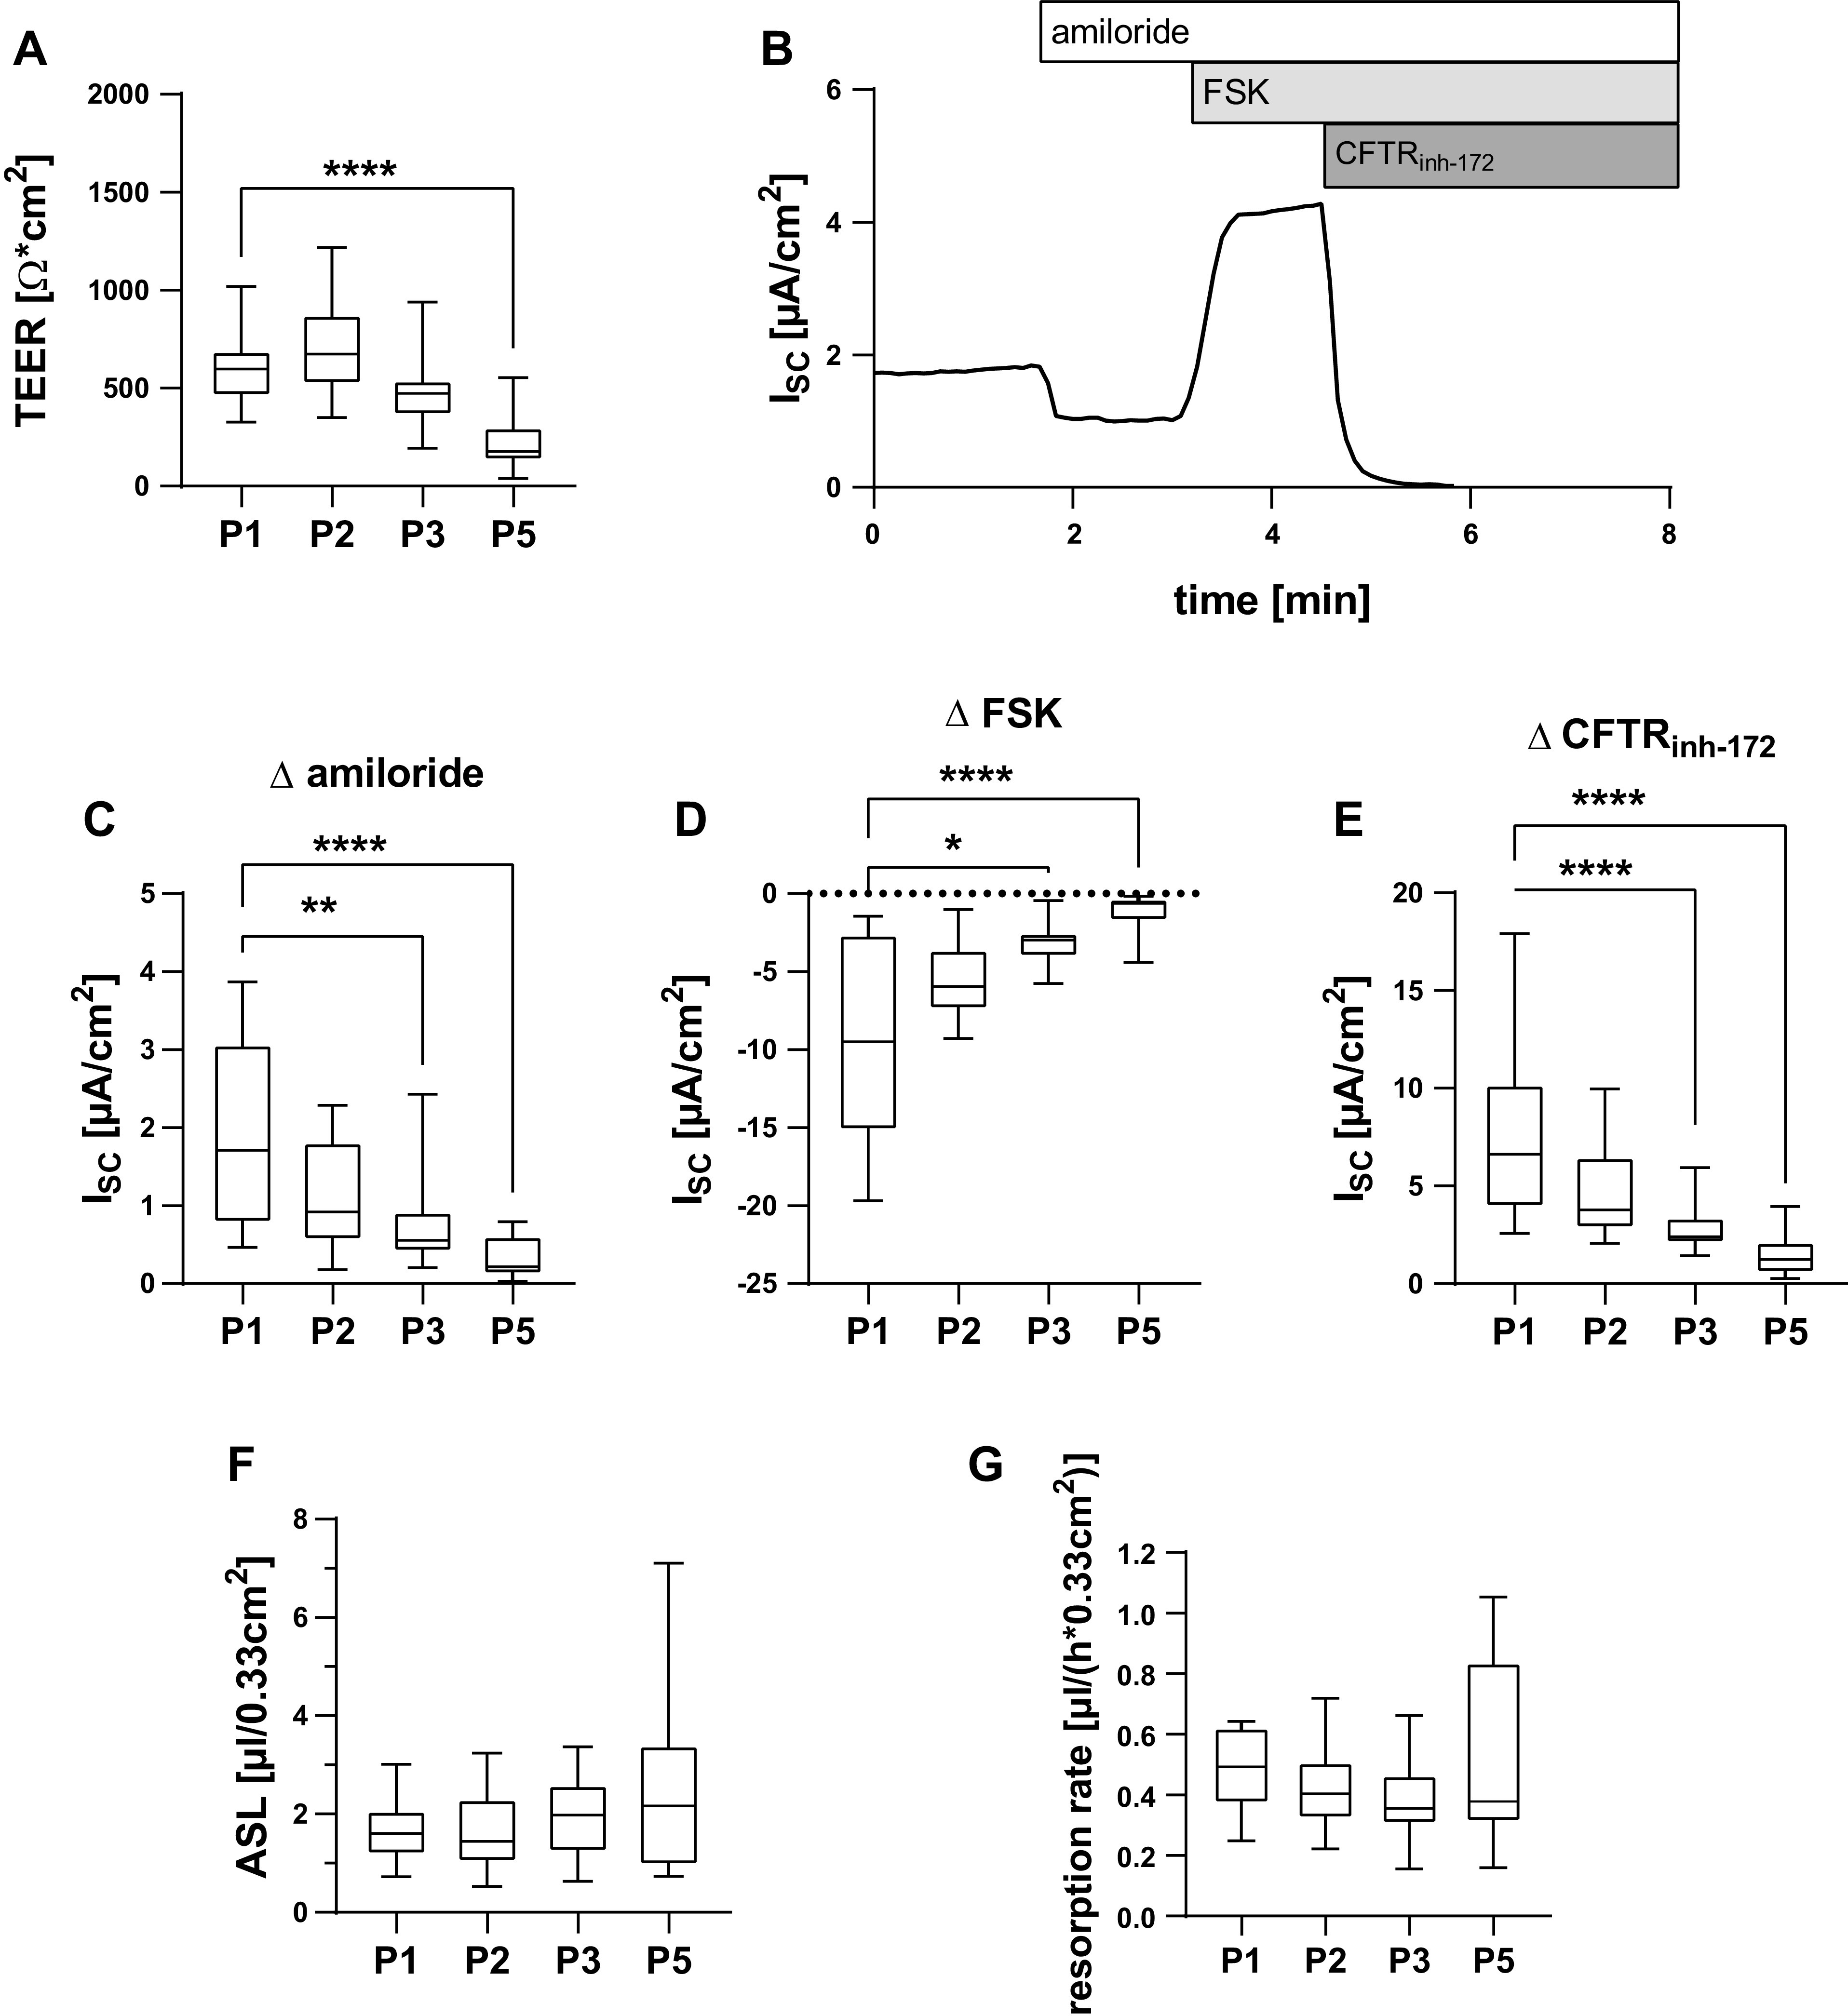
cr nasal epithelial cells of the passages 1–3 and 5 (P1, P2, P3, and P5) were cultivated as ALI epithelia and analyzed for functional properties. Box plots give data as median, percentiles (box), and minimum/maximum (whiskers). Results of P2, P3, and P5 were compared with respective P1 data using Kruskal–Wallis test with Dunn’s correction for multiple comparisons. A: transepithelial electrical resistance (TEER) was measured using impedance spectroscopy. TEER was reduced at P5 (P < 0.0001). n = 24–30 replicates from 6 donors. B–E: short circuit currents (ISC) were determined in Ussing chamber experiments. Representative Ussing chamber measurement. B: ISC response to amiloride (30 µM), forskolin (FSK, 50 µM), and CFTRinh-172 (100 µM). Amiloride-sensitive ISC (C), FSK-sensitive ISC (D), and CFTRinh-172-sensitive ISC (E) were reduced at P3 and P5 (P = 0.0011 and P < 0.0001 for amiloride; P = 0.203 and P < 0.0001 for FSK; P < 0.0001 for P3 and P5 for CFTRinh-172). n = 16–26 from 5 donors. F: ASL volumes were determined using deuterium oxide dilution and did not differ between passages. n = 19–25 replicates from 6 donors. G: epithelia were apically exposed to 25 µL of NaCl 0.9% solution and incubated for 8 h. y-axis gives resorption rates per hours calculated from the difference between remaining ASL volumes after 8 h and baseline ASL volumes. Resorption rates did not differ between passages. n = 15–20 replicates from 5 donors. ALI, air-liquid interface; ASl, apical surface liquid; cr, conditional reprogramming. *P < 0.05, **P < 0.01, and ****P < 0.0001.
We suspected that the observed changes of ion channel function and AQP expression could impact ASL volume homeostasis and water resorption. However, median ASL volumes were 1.60 µL/0.33 cm2 (IQR 0.89 µL/0.33 cm2), 1.44 µL/0.33 cm2 (IQR 1.28 µL/0.33 cm2), 1.98 µL/0.33 cm2 (IQR 2.08 µL/0.33 cm2), and 2.17 µL/0.33 cm2 (IQR 2.45 µL/0.33 cm2) for passages 1, 2, 3, and 5 epithelia and did not differ significantly between passages (Fig. 4F). Similarly, the number of passages did not affect reabsorption of excessive volumes after apical addition of 25 µL of saline within 8 h (Fig. 4F). Median resorption rates were 0.49 µL/(h × 0.33cm2) [IQR 0.25 µL/(h × 0.33cm2)], 0.40 µL/(h × 0.33cm2) [IQR 0.18 µL/(h × 0.33cm2)], 0.35 µL/(h × 0.33cm2) [IQR 0.16 µL/(h × 0.33cm2)], and 0.37 µL/(h × 0.33cm2) [IQR 0.52 µL/(h × 0.33cm2)] for passages 1, 2, 3, and 5 epithelia, respectively. Therefore, ASL volume regulation remains intact despite decreasing ion channel activity at passages 3 and 5.
Infectibility of Passaged cr-NECs with SARS-CoV-2
It was recently proposed that crNECs could constitute a suitable model to study infection with SARS-CoV-2 coronavirus- and infection-related host responses to identify novel therapeutic targets (36, 48). To assess the susceptibility of crNEC epithelia to SARS-CoV-2 infection, we measured expression levels of the primary viral receptor ACE2 (49) and the serine protease TMPRSS2, which is important for efficient virus entry (50). ACE2 was expressed in epithelia of all passages. However, expression levels gradually decreased over passages with significant reduction in epithelia of passages 3 and 5 (P = 0.0045 and P < 0.0001, respectively; Fig. 5A). TMPRSS2 transcript levels remained stable between passages (Fig. 5B). To assess the impact of passages on virus infection, epithelia were infected with SARS-CoV-2 for 48 h. Immunocytochemistry experiments cells staining positive for the SARS-CoV-2 nucleocapsid protein in all virus exposed epithelia (Fig. 6A). Some infected cells formed syncytia, especially in passage 1 epithelia. Z-series imaging revealed that SARS-CoV-2 nucleocapsid protein was always detected in apically localized cells within the epithelium (Fig. 6B). To quantify SARS-CoV-2 replication in the epithelium, we determined expression levels of nucleocapsid protein using qRT-PCR from whole cell RNA. We detected high levels of nucleocapsid protein transcripts in all infected epithelia. However, expression levels of passage 1 epithelia were approximately 15-fold higher compared with epithelia of passages 2, 3, and 5 (P = 0.0043, P = 0.0012, and P = 0.0206; Fig. 6C). This demonstrates that infectibility of cr-NECs with SARS-CoV-2 markedly decreases in crNEC epithelia with increasing passages. However, epithelia of higher passages are still steadily infectible up to passage 5.
Figure 5.

Expression of the SARS-CoV-2 receptor ACE2 (A) and the coreceptor TMPRSS2 (B) was determined in ALI epithelia of CR nasal epithelial cells of the passages 1–3 and 5 (P1, P2, P3, and P5) using semiquantitative qPCR of whole cell lysates. Box plots give data as median, percentiles (box), and minimum/maximum (whiskers). Results are given as relative expression to the housekeeping gene HMBS. Expression levels of P2, P3, and P5 were compared with P1 data. ACE expression decreased in P3 and P5 epithelia (P = 0.0045 and P < 0.0001; Kruskal–Wallis test with Dunn’s correction for multiple comparisons; n = 15–18 replicates from 5 donors). TMPRSS expression did not differ between passages. ALI, air-liquid interface; CR, conditional reprogramming. **P < 0.01 and ****P < 0.0001.
Figure 6.
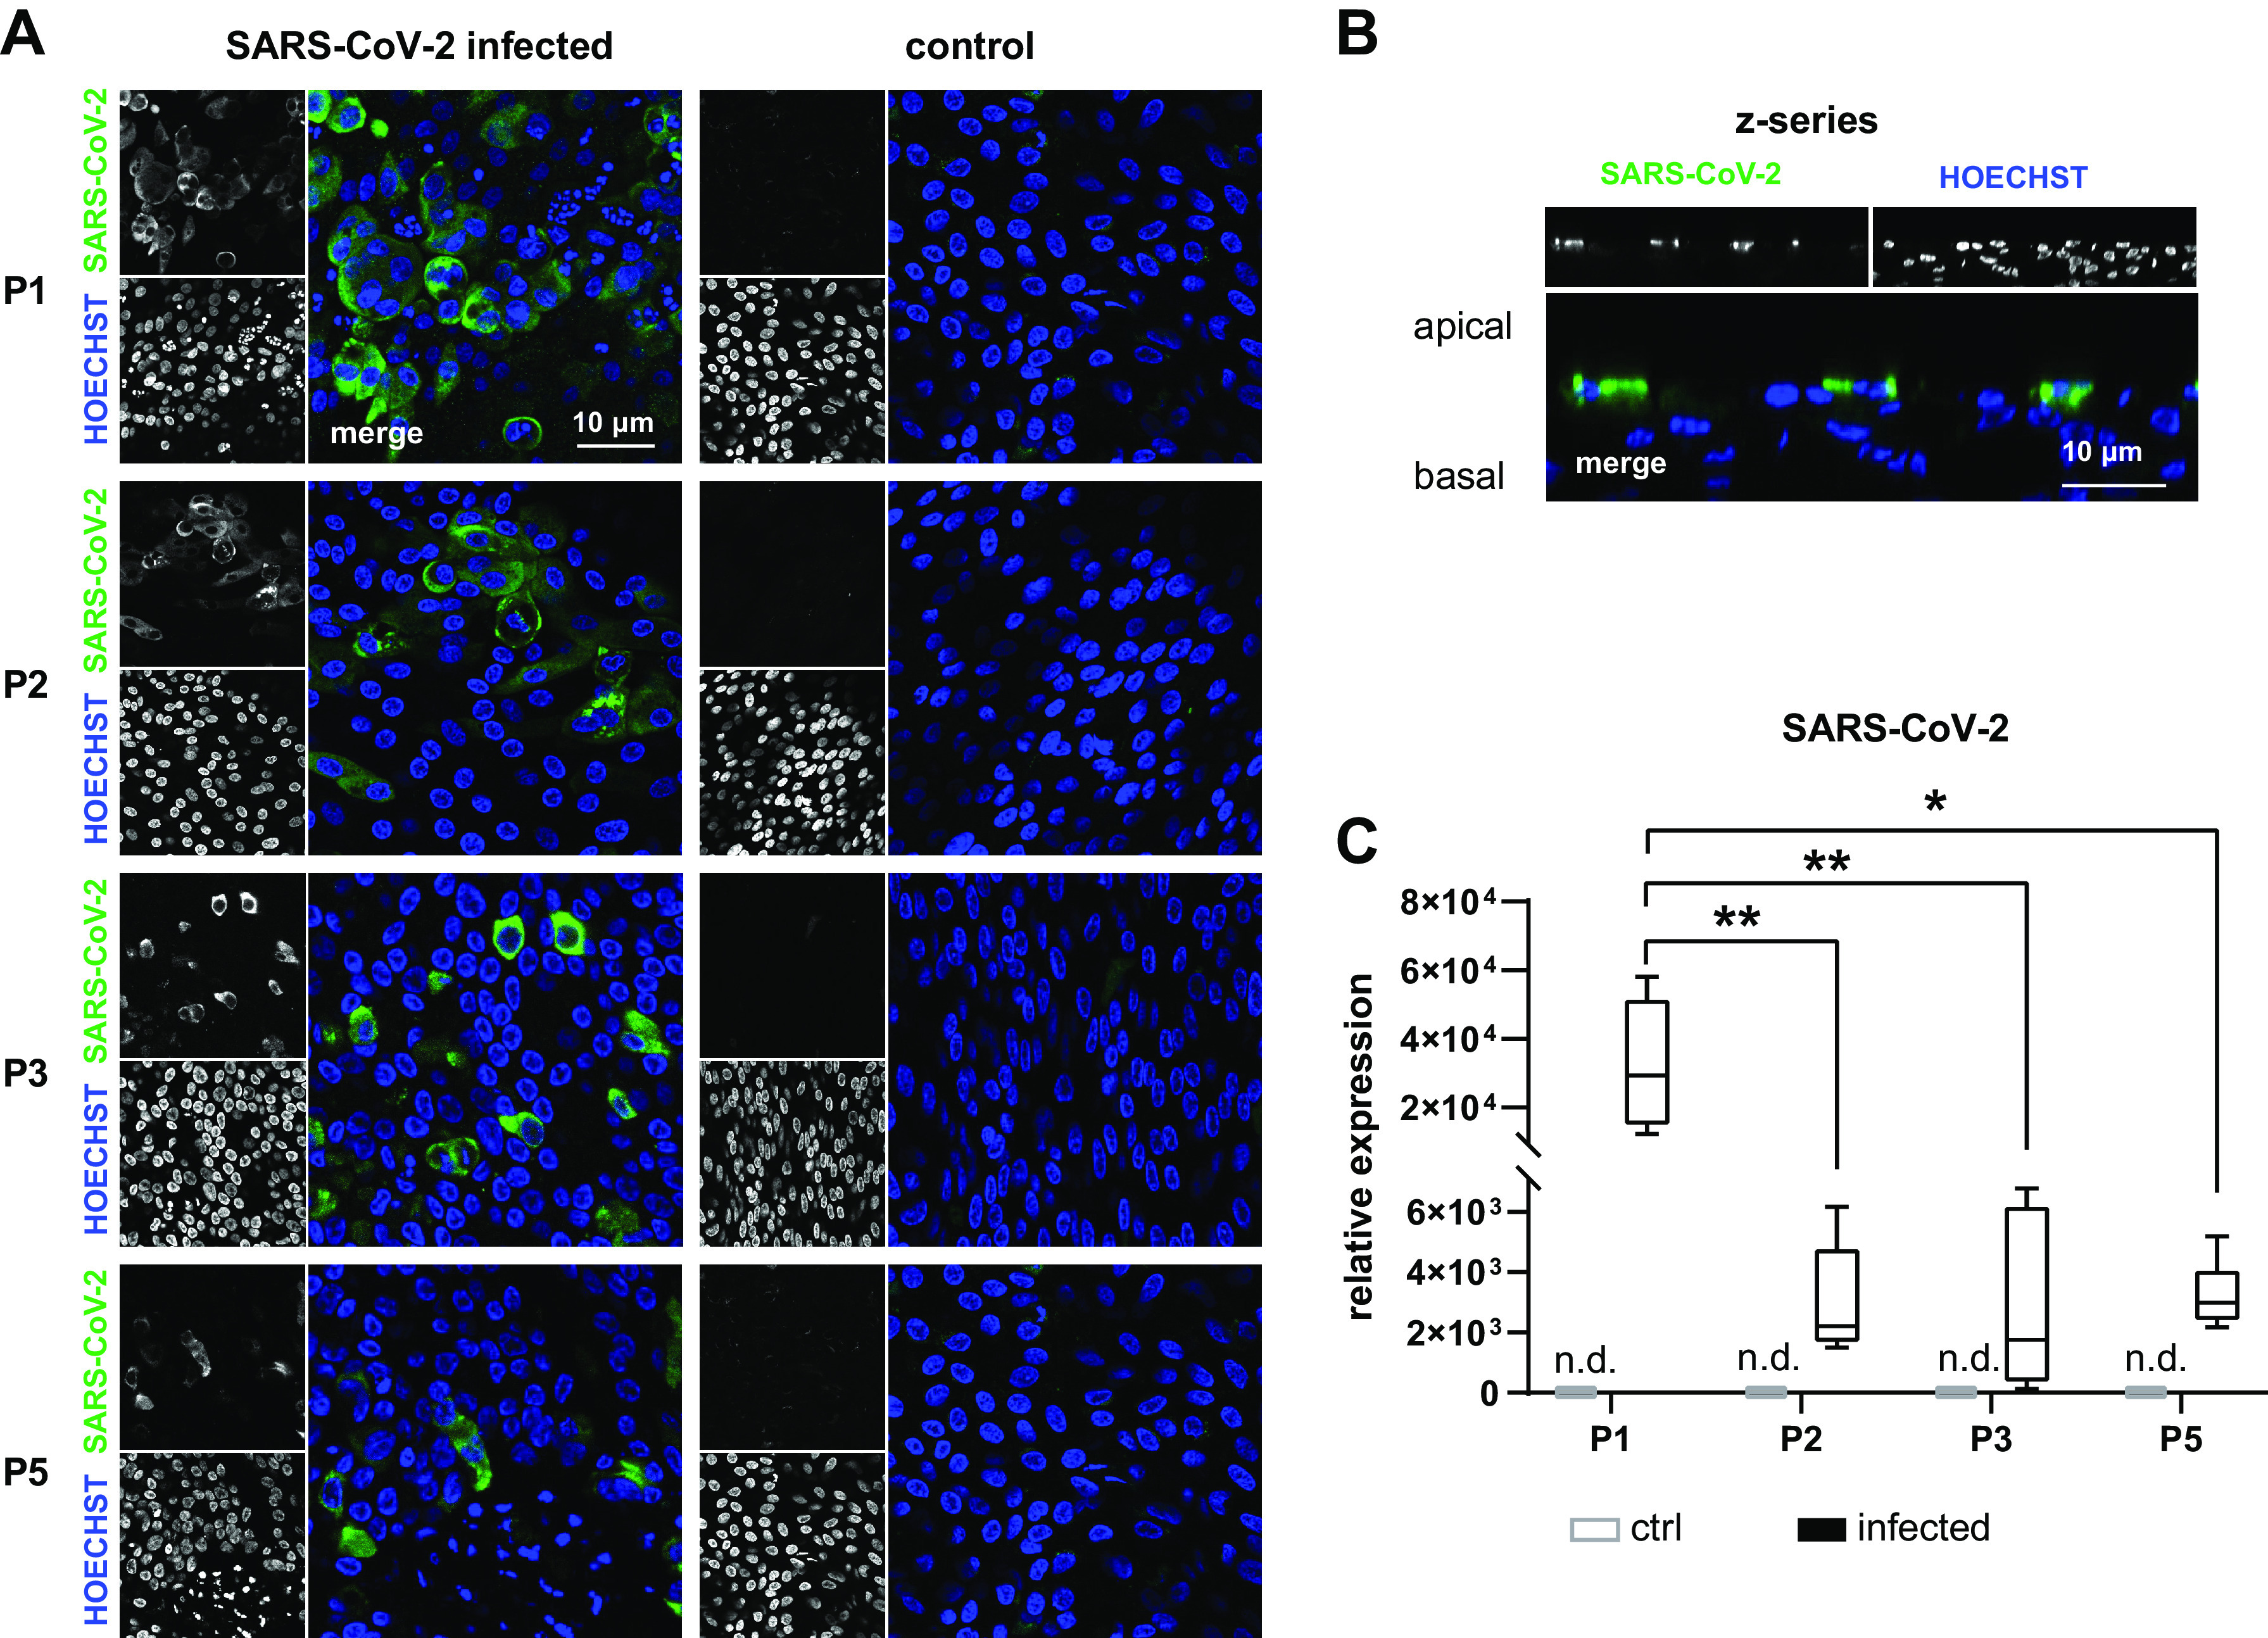
cr nasal epithelial cells of the passages 1–3 and 5 (P1, P2, P3, and P5) were cultivated as ALI epithelia and infected with SARS-CoV-2 for 48 h. A and B: immunocytochemistry experiments with staining of SARS-CoV-2 nucleocapsid protein and nuclear counterstaining with Hoechst 33342 confirmed infection of cells in all passages (A). Z-series shows infection of only apically localized cells (B). Virus replication was quantified using semiquantitative qPCR of whole cell lysates. Box plots give data as median, percentiles (box), and minimum/maximum (whiskers). Results are given as relative expression to the housekeeping gene Hh. Expression levels of P2, P3, and P5 were compared with P1 data. Transcript levels encoding for SARS-CoV-2 nucleocapsid protein were lower at P2, P3, and P5 compared with P1 (P = 0.0034; P = 0.0012 and P = 0.0206). In uninfected cells (control), PCR products were not detected (n.d.) (C). n = 6–9 replicates from 3 donors. ALI, air-liquid interface; cr, conditional reprogramming. *P < 0.05 and **P < 0.01.
DISCUSSION
Previous studies demonstrated that CR using mitotically inactivated fibroblast feeder cells and the ROCK inhibitor Y-27632 induce a stem cell-like phenotype and increase proliferative capacity of primary epithelial cells from many tissues (39, 51). The approach was successfully applied to AECs inducing rapid and continuous proliferation in both bronchial and nasal AECs (37, 38, 40). In accordance with those findings, our results show that cr culture of NECs facilitates proliferation and increases the number of population doublings compared with conventionally cultured cells and maintains replicative potential in serially passaged cells.
Tissue-specific differentiation is commonly regarded crucial for a cellular model supposed to reflect in vivo mechanisms of infection and epithelial functions. The ability to differentiate under ALI conditions after serially passaging is one of the major advantages of cr culture technique for AECs (28). We investigated markers for ciliated cells, mucus secreting cells, and basal cells, as they represent the most frequent cell types in human airway epithelia (44). Serially passaged NECs maintained the ability to differentiate into epithelia containing ciliated and mucus secreting cells as it has been demonstrated by others (38–40, 52). However, changes of differentiation of ALI epithelia over several passages have hardly been reported. Our results show that the frequency of ciliated cells gradually decreases over passages, most obvious for passage 5. The number of mucus secreting cells remained stable over passages. However, increased mRNA levels of MUC5B and MUC5AC for passages 3 and 5, respectively, indicate that mucus secretion might also be affected. Loss of differentiation is well-known from conventional AEC culture after three to four population doublings (53). Although cr definitely prolongs the ability of AECs to proliferate, decrease of epithelial height and number of ciliated cells has also been described for higher passages of cr bronchial cells (41). It appears possible that the loss of ciliated cells we observed results from dedifferentiation of cells. However, all cells showed regular tight junctions which indicate completeness of epithelial polarization. This makes significant fraction of dedifferentiated cells rather unlikely. Notably, several pathogen and cytokine receptors are located in the motile cilia of the airway epithelium as reported for TGFβ1 (54), CX3CR1 (55), and ACE2 (56). Therefore, it must be considered that ALI cultures derived from passages higher than P3 may be less reliable in representing physiological responses to pathogens and inflammatory mediators.
We systematically compared ion and water transport properties of crNECs over passages 1–5. We observed decrease of both ENaC and CFTR activity from passage 3 upward. However, RT-PCR data of ion channel expression did not reflect those functional alterations as CFTR and γ-ENaC subunit mRNA expression levels were even up-regulated in some donors in passage 5 epithelia. Possible explanations for this discrepancy include differences in protein translation, turnover, or trafficking. Gradual decrease of both ENaC and CFTR activity was described in P5 and P10 epithelia compared with P2 of crAECs by Gentzsch et al. (41). Although passage numbers of this study are not directly comparable to our protocol as the authors used bronchial cells and a different frequency of passaging, the results show similar changes of bioelectrical properties with increasing passage number. Interestingly, culture of crNECs with reduced oxygen concentration (2–7%) partially prevented decrease of ion channel activity for higher passages (57). Future studies aiming on the fine-tuning of CR culture conditions might further reduce limitations of ALI epithelia derived from crNEC.
We observed loss of ciliated cells with increasing passage number concomitant with decline of amiloride-sensitive and CFTR-inh172-sensitive short-circuit current. This indicates that ciliated cells contribute to short-circuit currents. However, a recent study using single-cell RNA sequencing reported infrequent and low CFTR expression in ciliated cells, but dominating expression in secretory cells (58). Probably, loss of ciliated cells solely does not explain the observed alterations of ion transport. Despite gradual reduction of ion channel activity over passages, we observed no differences regarding ASL volumes. Obviously, even reduced ion transport capacity suffices to maintain ASL volume homeostasis. However, in passage 5, range of ASL volumes was enlarged compared with passages 1–3, indicating altered ASL volume regulation at higher passages in some donors. Regarding decreased ENaC activity over passages, one would expect reduced water resorption in contrast to our findings as ENaC is considered the main driving force of water resorption in airway epithelia (12, 13). It was previously shown that partial pharmacologic blockade of ENaC hardly affected water resorption rates in NCI-H441 epithelia. Instead, ENaC activity had to be inhibited almost completely to be rate limiting for resorption (43). In addition, water resorption in airway epithelia is, to a certain extent, amiloride insensitive, and the underlying transport mechanisms are not fully understood (43, 59, 60). Theoretically, ion channels not considered in our study can contribute to volume resorption and compensate for decreased ENaC activity.
We included the analysis of AQP3 and AQP5 in our study, as these are the most frequently expressed AQP in the epithelium of human conducting airways (47). Although contribution of AQP to ASL regulation remains elusive (14), increasing evidence suggests involvement in disease pathogenesis including viral infection. For instance, altered airway AQP expression has been found in patients with lung edema (61), in mouse lungs after adenovirus infection (62) and pig airways after infection with the porcine reproductive and respiratory syndrome virus (63). We previously demonstrated that AQP3 limits transport rates of amiloride sensitive resorption in a lung edema model in NCI-H441 and primary human tracheal epithelial cells (15). AQP5 is involved in mucus secretion of submucosal glands where it mediates water secretion across the apical membrane (47, 64). Therefore, we consider AQP as relevant potential contributors to the complex mechanisms of ASL volume dysregulation in airway disease. We show that serially passaging of crNECs results in a gradual decrease of AQP3 and AQP5 at both mRNA and protein level significant from passage 3 onward. Possibly, decrease of AQP expression is related to general decline of differentiation over passages. Notably, changes of AQP expression may affect ASL volume and water transport regulation and its response to infectious or inflammatory stimuli especially when cells of passage 3 and higher are used for experiments.
Epithelia derived from cr cells have been used previously as ex vivo models to study viral infections (48). For instance, ALI cultures of AECs developed antiviral response to rhinovirus infection (65) and were infectible with adenovirus (66). Accordingly, crNECs were discussed as an appropriate model to study SARS-CoV-2 infection (48). SARS-CoV-2 infects human epithelia, and high virus levels have been detected in the upper airways (67). Thus, NECs represent a highly physiologically relevant model.
We infected cells with SARS-CoV-2 for 48 h, as maximal replication was found at that timepoint in conventionally cultured differentiated human airway epithelia (68). In all epithelia, we detected infected cells in the apical layer of the epithelium. In accordance, ciliated and goblet cells but not basal cells were found to be permissive for SARS-CoV-2 (69). We found high quantities of SARS-CoV-2 transcripts from whole cell RNA in passage 1 epithelia, which dropped in passage 2 epithelia and remained stable in further passages. Decline of ACE2 expression concomitant with decline of ciliated cell frequency can to some extent explain decrease of SARS-CoV-2 infectibility. SARS-CoV-2 interaction with TMPRSS2 has been suspected to modulate ENaC mediated ion transport as TRMPSS2 contributes to proteolytic ENaC activation (26, 50). This could impair resorptive ion and water transport capacity and would promote lung edema. As the pathophysiological relevance of this potential effect has not been elucidated, the here-evaluated crNEC model might be helpful to address this.
We conclude that ALI cultures from serially passaged crNECs represent an appropriate model to study epithelial dysfunctions on infection with SARS-CoV-2. Epithelia of all investigated passages displayed major morphologic and functional characteristics of airway epithelia, expressed SARS-CoV-2 receptors and were infectable with SARS-CoV-2. However, we also identified important limitations of the model. First, we observed a gradual decrease of ion channel activity, AQP expression, and frequency of ciliated cells over passages that were substantial for passage 5 epithelia. This limits the usability of epithelia of higher passages. Next, regarding gradual changes of most parameters over passages, experimental data cannot be reliably compared between epithelia derived from different passages. Thus, experiments should be preferably conducted within the same passage using standardized passaging protocols regarding frequency and seeding number of cells to keep population doublings constant. Last, virus replication on SARS-CoV-2 infection substantially decreased from passage 2 onward. This may limit the use of cells different from passage 1 in case that especially high infectibility of the epithelium is required.
APPENDIX
Cell Culture
NIH-3T3 cells (Kerafast, Boston, MA) were cultivated in 3T3 medium (DMEM with glucose, glutamine, and pyruvate) with 10% charcoal stripped fetal calf serum, 50 U/mL penicillin, and 50 μg/mL streptomycin (all from Merck, Darmstadt, Germany) to 90% confluence and passaged twice weekly. For generation of postmitotic feeder cells, NIH-3T3 cells were incubated with 3T3 medium containing mitomycin C 4 μg/mL for 2 h. Afterward, cells were washed three times with PBS and passaged using TrypLE (Thermo Fisher Scientific, Dreieich, Germany). Postmitotic cells were seeded in a density of 20,000 cells per cm2 on 6-well culture plates or 25-cm2 culture flasks coated with collagen I/III solution (StemCell Technologies, Cologne, Germany) in 3T3 medium 24 h before seeding of nasal epithelial cells (NECs).
Collection of NECs was approved by the Ethics Committee of Ulm University, and written consent was obtained from all donors. Cells were obtained from healthy individuals aged between 23 and 51 yr via brushing at both inferior turbinates using Cytobrush Plus GT (CooperSurgical, The Hague, The Netherlands). Collected cells were released from the brush by briefly vortexing and detached with TrypLE for 2 min. After removal of TrypLE and resuspension in NEC culture medium, the number of cells was determined using a Neubauer counting chamber.
Conventional culture.
Cells were seeded in 6-well plates precoated with collagen I/III solution in growth medium in airway epithelial growth medium containing supplement package provided by the supplier (Promocell, Heidelberg, Germany) and 50 U/mL penicillin, 50 μg/mL streptomycin (both from Thermo Fisher Scientific, Dreieich, Germany), Fungin 1% (InvivoGen, Toulouse, France). Twenty-four hours after seeding, nonadherent NECs were transferred to a second well, and fresh culture medium was added. Further on, medium was changed every other day. After 7 days, cells were passaged using TrypLE (Thermo Fisher Scientific, Dreieich, Germany). For further proliferation, 200 cells were seeded to a 25-cm2 cell culture flask and passaged every seventh day as described until day 35 (passage 5).
Conditional reprogramming.
Cells were seeded in 6-well plates preseeded with postmitotic feeder cells in NEC culture medium [F12 Nutrient Mix and DMEM (with glucose, glutamine, and Pyruvate) at a 1:2 ratio (both from Thermo Fisher Scientific, Dreieich, Germany)] supplemented with 7.5% charcoal stripped fetal calf serum, insulin 5 μg/mL, hydrocortisone 25 ng/mL, EGF 0.125 ng/mL, cholera toxin 8.6 ng/mL (all from Merck kGaA, Darmstadt, Germany), 50 U/mL penicillin, 50 μg/mL streptomycin (both from Thermo Fisher Scientific, Dreieich, Germany), Fungin 1% (InvivoGen, Toulouse, France), and Y-27632 5 μM (Tocris Bioscience, Bristol, UK). Twenty-four hours after seeding, nonadherent NECs were transferred to a second well with feeder cells and fresh culture medium was added. Further on, medium was changed every other day. After 7 days, cells were passaged using Trypsin/EDTA 0.25/0.02%. Feeder cells were removed using differential trypsinization. For further proliferation, 200,000 cells were seeded to a 25 cm2 cell culture flask preseeded with feeder cells and passaged every seventh day as described until day 35 (passage 5). For experiments, 60,000 cells were seeded on collagen IV (Merck kGaA, Darmstadt, Germany) coated 0.33 cm2 Costar transwell filter inserts (Schubert&Weiss) with 500 µL of culture medium in the basolateral and 200 µL of cell suspension in the apical compartment. ALI was established after 2 days by removal of apical liquid and replacement of basolateral culture medium by ALI medium [DMEM-H and LHC basal medium (both from Gibco, Darmstadt, Germany) at a 1:1 ratio] and supplemented with insulin 0.87 µM, hydrocortisone 0.21 µM, epidermal growth factor 0.5 ng/mL, triiodothyronine 0.01 µM, transferrin 0.125 µM, epinephrine 2.5 µM, bovine pituitary extract 10 µg/mL, bovine serum albumin 0.5 mg/mL (all from Promocell, Heidelberg, Germany), phosphorylethanolamine 0.5 µM, ethanolamine 0.5 µM, zinc sulfate 3 µM, retinoic acid 0.05 µM, ferrous sulfate 1.5 nM, calcium chloride 0.6 µM, magnesium chloride 0.11 µM, sodium selenite 30 µM, manganese chloride 1 µM, sodium silicate 0.5 nM, ammonium molybdate tetrahydrate 1 µM, ammonium metavanadate 5 µM, nickel sulfate 1 µM, tin chloride 0.5 µM (all from Merck, Darmstadt, Germany), 100 U/mL penicillin, and 100 µg/mL streptomycin (both from Thermo Fisher Scientific, Dreieich, Germany). Basolateral medium was changed every other day. From day 14 after ALI, epithelia were washed with PBS twice weekly to remove mucus. Experiments were conducted at day 24 after ALI. ALI culture from cells passaged 7 days after brushing, was defined as passage 1.
Ussing Chamber
Bath solution: 140 mM NaCl, 3.5 mM KCl, 1 mM Mg2SO4, 2 mM CaCl2, 1 mM KH2PO4, 10 mM HEPES, and 10 mM Glucose. Ag/AgCl electrodes in electrode solution containing identical electrolyte concentrations as the bath solutions were connected via agarose bridges with the chambers.
RT-PCR
Total RNA was isolated from epithelia cultured at ALI conditions using the my-Budget RNA Mini Kit (Biobudget, Krefeld, Germany) according to the manufacturers’ protocol. And 600–800 ng of total RNA was used for first strand synthesis using the VILO SuperScript cDNA Synthesis Kit (Thermo Fisher Scientific, Darmstadt, Germany). qRT-PCR was performed with EvaGreen qPCR Supermix (Biobudget, Krefeld, Germany) according to the manufactures’ protocols using RealPlex2 thermocycler with latest version of Realplex data acquisition and analysis software (Eppendorf, Hamburg, Germany) and the following Quantitect RT-PCR primer assays (all from Qiagen, Hilden, Germany): AQP3 QT00212996, AQP5 QT00036099, CFTR QT100070007, α-ENaC QT00022883, β-ENaC QT00051597, γ-ENaC QT00086051, FOXJ1 QT01000797, MUC5AC QT00088991, MUC5B QT01529367, TP63 QT000243734, and HMBS QT00014462. PCR cycling protocol: initial denaturation and Taq activation at 95°C for 2 min, 40 cycles with denaturing at 95°C for 15 s, primer annealing and amplification at 60°C for 75 s. PCR products were verified by determining melting curves, final denaturation at 95°C for 15 s, annealing at 60°C for 15 s, and heat ramping from 60°C to 95°C with a ramp duration of 20 min. Crossing points were determined using the CalPlex method provided with the data acquisition and analysis software. Each target gene expression was determined as a doublet. Results were determined as relative expression to the housekeeping gene HMBS.
Immunocytochemistry
Epithelia were fixed with 2% paraformaldehyde for 10 min, followed by incubation with 1 M glycine for 10 min and acetone/methanol 1:1 for 2 min. After washing with PBS, cells were blocked with PBS containing 5% BSA and 1% Triton-X-100 for 25 min. Primary antibodies were diluted 1:300 in PBS containing 0.5% BSA and 0.1% Triton-X-100 and cells were incubated with primary antibodies for 1 h at room temperature using the following antibodies: anti-ZO1 (Cat. No. ab99462, abcam, Cambridge, UK; RRID:AB_10673205), anti-acetylated α-tubulin (Cat. No. T7451, Sigma Aldrich via Merck; RRID:AB_609894), anti-AQP3 (Cat. No. ab125219, abcam, Cambridge, UK; RRID:AB_11000698), anti-AQP5 (Cat. No. ab92320, abcam, Cambridge, UK; RRID:AB_2049171), anti-FOXJ1 (Cat. No. 14–9965-82, Thermo Fisher Scientific, Dreieich, Germany; RRID:AB_1548835), anti-MUC5AC (Cat. No. MA1-21907, Thermo Fisher Scientific, Dreieich, Germany; RRID:AB_560214), anti-p63 (Cat. No. ab124762, abcam, Cambridge, UK; RRID:AB_10971840). After removal of primary antibodies and three times washing with PBS, cells were incubated with secondary antibodies diluted 1:800 in PBS containing 0.5% BSA and 0.1% Triton-X-100 for 30 min. Secondary antibodies were Alexa Fluor 488 donkey anti-rabbit IgG, Alexa Fluor 568 donkey anti-goat IgG, and Alexa Fluor 647 donkey anti-mouse IgG (all from Thermo Fisher Scientific, Dreieich, Germany). Nuclear staining was performed with Hoechst 33342 (Thermo Fisher Scientific, Dreieich, Germany). After removal of secondary antibodies and three times washing with PBS, filter membranes were mounted on glass slides using ProLong Diamond Antifade Mountant (Thermo Fisher Scientific, Dreieich, Germany). From each individual filter, one image was taken from each of four different, randomly selected areas on an inverted confocal microscope (Leica TCS SP5, Leica, Germany) using a ×40 lens (Leica HCX PL APO CS 40 × 1.25 oil). Images for the blue (DAPI), green (AlexaFluor 488), red (AlexaFluor 568), and far-red (AlexaFluor 647) channels were taken in sequential mode using appropriate excitation and emission settings. Images represent sections with 250–500 cells each. Image analysis was performed using latest version of ImageJ software (NIH, Bethesda, MD). Maximum projections of z-series of 5–10 µm total depth and 30–40 µm total depth were used for analysis of differentiation markers. Total cell number or the number of cells reaching the surface was counted by Hoechst or ZO-1 staining, respectively. The number of cells positive for FOXJ1, TP63, AQP3, AQP5, MUC5AC, and acetylated α-tubulin was counted accordingly and normalized to total cell number (FOXJ1, TP63) or surface cell number (remaining). Values obtained from four images of one filter were averaged for further analysis.
GRANTS
This work was supported by Deutsche Forschungsgemeinschaft (DFG) grant 458685876.
DISCLOSURES
No conflicts of interest, financial or otherwise, are declared by the authors.
AUTHOR CONTRIBUTIONS
H.S., S.S., F.K., and O.H.W. conceived and designed research; H.S., L.G., A.S., F.Z., and R.N. performed experiments; H.S. and O.H.W. analyzed data; H.S., M.F., P.D., and O.H.W. interpreted results of experiments; H.S. prepared figures; H.S. drafted manuscript; L.G., A.S., F.Z., M.F., F.K., P.D., and O.H.W. edited and revised manuscript; H.S., L.G., A.S., F.Z., R.N., S.S., M.F., F.K., P.D., and O.H.W. approved final version of manuscript.
REFERENCES
- 1.Burney P, Jarvis D, Perez-Padilla R. The global burden of chronic respiratory disease in adults. Int J Tuberc Lung Dis 19: 10–20, 2015. doi: 10.5588/ijtld.14.0446. [DOI] [PubMed] [Google Scholar]
- 2.Asher I, Pearce N. Global burden of asthma among children. Int J Tuberc Lung Dis 18: 1269–1278, 2014. doi: 10.5588/ijtld.14.0170. [DOI] [PubMed] [Google Scholar]
- 3.López-Campos JL, Tan W, Soriano JB. Global burden of COPD. Respirology 21: 14–23, 2016. doi: 10.1111/resp.12660. [DOI] [PubMed] [Google Scholar]
- 4.Hu B, Guo H, Zhou P, Shi Z-L. Characteristics of SARS-CoV-2 and COVID-19. Nat Rev Microbiol 19: 141–154, 2021. [Erratum in Nat Rev Microbiol 1, 2022]. doi: 10.1038/s41579-020-00459-7. [DOI] [PMC free article] [PubMed] [Google Scholar]
- 5.Muralidar S, Ambi SV, Sekaran S, Krishnan UM. The emergence of COVID-19 as a global pandemic: understanding the epidemiology, immune response and potential therapeutic targets of SARS-CoV-2. Biochimie 179: 85–100, 2020. doi: 10.1016/j.biochi.2020.09.018. [DOI] [PMC free article] [PubMed] [Google Scholar]
- 6.Zheng B, Wang H, Yu C. An increasing public health burden arising from children infected with SARS-CoV2: a systematic review and meta-analysis. Pediatr Pulmonol 55: 3487–3496, 2020. doi: 10.1002/ppul.25008. [DOI] [PMC free article] [PubMed] [Google Scholar]
- 7.De Rose V, Molloy K, Gohy S, Pilette C, Greene CM. Airway epithelium dysfunction in cystic fibrosis and COPD. Mediators Inflamm 2018: 1309746, 2018. doi: 10.1155/2018/1309746. [DOI] [PMC free article] [PubMed] [Google Scholar]
- 8.Lambrecht BN, Hammad H. The airway epithelium in asthma. Nat Med 18: 684–692, 2012. doi: 10.1038/nm.2737. [DOI] [PubMed] [Google Scholar]
- 9.Frey A, Lunding LP, Ehlers JC, Weckmann M, Zissler UM, Wegmann M. More than just a barrier: the immune functions of the airway epithelium in asthma pathogenesis. Front Immunol 11: 761, 2020. doi: 10.3389/fimmu.2020.00761. [DOI] [PMC free article] [PubMed] [Google Scholar]
- 10.Jayaraman S, Song Y, Vetrivel L, Shankar L, Verkman AS. Noninvasive in vivo fluorescence measurement of airway-surface liquid depth, salt concentration, and pH. J Clin Invest 107: 317–324, 2001. doi: 10.1172/JCI11154. [DOI] [PMC free article] [PubMed] [Google Scholar]
- 11.Winters SL, Yeates DB. Roles of hydration, sodium, and chloride in regulation of canine mucociliary transport system. J Appl Physiol (1985) 83: 1360–1369, 1997. doi: 10.1152/jappl.1997.83.4.1360. [DOI] [PubMed] [Google Scholar]
- 12.Boucher RC. Regulation of airway surface liquid volume by human airway epithelia. Pflugers Arch 445: 495–498, 2003. doi: 10.1007/s00424-002-0955-1. [DOI] [PubMed] [Google Scholar]
- 13.Tarran R. Regulation of airway surface liquid volume and mucus transport by active ion transport. Proc Am Thorac Soc 1: 42–46, 2004. doi: 10.1513/pats.2306014. [DOI] [PubMed] [Google Scholar]
- 14.Wittekindt OH, Dietl P. Aquaporins in the lung. Pflugers Arch 471: 519–532, 2019. doi: 10.1007/s00424-018-2232-y. [DOI] [PMC free article] [PubMed] [Google Scholar]
- 15.Schmidt H, Michel C, Braubach P, Fauler M, Neubauer D, Thompson KE, Frick M, Mizaikoff B, Dietl P, Wittekindt OH. Water permeability adjusts resorption in lung epithelia to increased apical surface liquid volumes. Am J Respir Cell Mol Biol 56: 372–382, 2017. doi: 10.1165/rcmb.2016-0161OC. [DOI] [PubMed] [Google Scholar]
- 16.Wittekindt OH. Tight junctions in pulmonary epithelia during lung inflammation. Pflugers Arch 469: 135–147, 2017. doi: 10.1007/s00424-016-1917-3. [DOI] [PMC free article] [PubMed] [Google Scholar]
- 17.Danahay H, Atherton H, Jones G, Bridges RJ, Poll CT. Interleukin-13 induces a hypersecretory ion transport phenotype in human bronchial epithelial cells. Am J Physiol Lung Cell Mol Physiol 282: L226–L236, 2002. doi: 10.1152/ajplung.00311.2001. [DOI] [PubMed] [Google Scholar]
- 18.Galietta LJV, Folli C, Caci E, Pedemonte N, Taddei A, Ravazzolo R, Zegarra-Moran O. Effect of inflammatory stimuli on airway ion transport. Proc Am Thorac Soc 1: 62–65, 2004. doi: 10.1513/pats.2306017. [DOI] [PubMed] [Google Scholar]
- 19.Eisenhut M, Wallace H. Ion channels in inflammation. Pflugers Arch 461: 401–421, 2011. doi: 10.1007/s00424-010-0917-y. [DOI] [PubMed] [Google Scholar]
- 20.Chen X-J, Seth S, Yue G, Kamat P, Compans RW, Guidot D, Brown LA, Eaton DC, Jain L. Influenza virus inhibits ENaC and lung fluid clearance. Am J Physiol Lung Cell Mol Physiol 287: L366–L373, 2004. doi: 10.1152/ajplung.00011.2004. [DOI] [PubMed] [Google Scholar]
- 21.Brand JD, Lazrak A, Trombley JE, Shei R-J, Adewale AT, Tipper JL, Yu Z, Ashtekar AR, Rowe SM, Matalon S, Harrod KS. Influenza-mediated reduction of lung epithelial ion channel activity leads to dysregulated pulmonary fluid homeostasis. JCI Insight 3: e123467, 2018. doi: 10.1172/jci.insight.123467. [DOI] [PMC free article] [PubMed] [Google Scholar]
- 22.Wynne BM, Zou L, Linck V, Hoover RS, Ma H-P, Eaton DC. Regulation of lung epithelial sodium channels by cytokines and chemokines. Front Immunol 8: 766, 2017. doi: 10.3389/fimmu.2017.00766. [DOI] [PMC free article] [PubMed] [Google Scholar]
- 23.Vadász I, Lucas R. Editorial: cytokine-ion channel interactions in pulmonary inflammation. Front Immunol 9: 2598, 2018. doi: 10.3389/fimmu.2018.02598. [DOI] [PMC free article] [PubMed] [Google Scholar]
- 24.Schmidt H, Braubach P, Schilpp C, Lochbaum R, Neuland K, Thompson K, Jonigk D, Frick M, Dietl P, Wittekindt OH. IL-13 Impairs tight junctions in airway epithelia. Int J Mol Sci 20: 3222, 2019. doi: 10.3390/ijms20133222. [DOI] [PMC free article] [PubMed] [Google Scholar]
- 25.Abdel Hameid R, Cormet-Boyaka E, Kuebler WM, Uddin M, Berdiev BK. SARS-CoV-2 may hijack GPCR signaling pathways to dysregulate lung ion and fluid transport. Am J Physiol Lung Cell Mol Physiol 320: L430–L435, 2021. doi: 10.1152/ajplung.00499.2020. [DOI] [PMC free article] [PubMed] [Google Scholar]
- 26.Anand P, Puranik A, Aravamudan M, Venkatakrishnan AJ, Soundararajan V. SARS-CoV-2 strategically mimics proteolytic activation of human ENaC. eLife 9: e58603, 2020. doi: 10.7554/eLife.58603. [DOI] [PMC free article] [PubMed] [Google Scholar]
- 27.Dada LA, Vagin O, Sznajder JI. Dysregulation of ion transport in the lung epithelium infected with SARS-CoV-2. Am J Physiol Lung Cell Mol Physiol 320: L1183–L1185, 2021. doi: 10.1152/ajplung.00170.2021. [DOI] [PMC free article] [PubMed] [Google Scholar]
- 28.Bukowy-Bieryłło Z. Long-term differentiating primary human airway epithelial cell cultures: how far are we?. Cell Commun Signal 19: 63, 2021. doi: 10.1186/s12964-021-00740-z. [DOI] [PMC free article] [PubMed] [Google Scholar]
- 29.Lin H, Li H, Cho H-J, Bian S, Roh HJ, Lee MK, Kim JS, Chung SJ, Shim CK, Kim DD. Air-liquid interface (ALI) culture of human bronchial epithelial cell monolayers as an in vitro model for airway drug transport studies. J Pharm Sci 96: 341–350, 2007. doi: 10.1002/jps.20803. [DOI] [PubMed] [Google Scholar]
- 30.Upadhyay S, Palmberg L. Air-liquid interface: relevant in vitro models for investigating air pollutant-induced pulmonary toxicity. Toxicol Sci 164: 21–30, 2018. doi: 10.1093/toxsci/kfy053. [DOI] [PubMed] [Google Scholar]
- 31.Fulcher ML, Gabriel S, Burns KA, Yankaskas JR, Randell SH. Well-differentiated human airway epithelial cell cultures. Methods Mol Med 107: 183–206, 2005. doi: 10.1385/1-59259-861-7:183. [DOI] [PubMed] [Google Scholar]
- 32.Müller L, Brighton LE, Carson JL, Fischer WA, Jaspers I. Culturing of human nasal epithelial cells at the air liquid interface. J Vis Exp 50646, 2013. doi: 10.3791/50646. [DOI] [PMC free article] [PubMed] [Google Scholar]
- 33.McDougall CM, Blaylock MG, Douglas JG, Brooker RJ, Helms PJ, Walsh GM. Nasal epithelial cells as surrogates for bronchial epithelial cells in airway inflammation studies. Am J Respir Cell Mol Biol 39: 560–568, 2008. doi: 10.1165/rcmb.2007-0325OC. [DOI] [PMC free article] [PubMed] [Google Scholar]
- 34.Pringle EJ, Richardson HB, Miller D, Cornish DS, Devereux GS, Walsh GM, Turner SW. Nasal and bronchial airway epithelial cell mediator release in children. Pediatr Pulmonol 47: 1215–1225, 2012. doi: 10.1002/ppul.22672. [DOI] [PubMed] [Google Scholar]
- 35.van Meegen MA, Terheggen-Lagro SWJ, Koymans KJ, van der Ent CK, Beekman JM. Apical CFTR expression in human nasal epithelium correlates with lung disease in cystic fibrosis. PLoS One 8: e57617, 2013. doi: 10.1371/journal.pone.0057617. [DOI] [PMC free article] [PubMed] [Google Scholar]
- 36.Liu X, Wu Y, Rong L. Conditionally reprogrammed human normal airway epithelial cells at ALI: a physiological model for emerging viruses. Virol Sin 35: 280–289, 2020. doi: 10.1007/s12250-020-00244-z. [DOI] [PMC free article] [PubMed] [Google Scholar]
- 37.Martinovich KM, Iosifidis T, Buckley AG, Looi K, Ling K-M, Sutanto EN, Kicic-Starcevich E, Garratt LW, Shaw NC, Montgomery S, Lannigan FJ, Knight DA, Kicic A, Stick SM. Conditionally reprogrammed primary airway epithelial cells maintain morphology, lineage and disease specific functional characteristics. Sci Rep 7: 17971, 2017. doi: 10.1038/s41598-017-17952-4. [DOI] [PMC free article] [PubMed] [Google Scholar]
- 38.Reynolds SD, Rios C, Wesolowska-Andersen A, Zhuang Y, Pinter M, Happoldt C, Hill CL, Lallier SW, Cosgrove GP, Solomon GM, Nichols DP, Seibold MA. Airway progenitor clone formation is enhanced by Y-27632-dependent changes in the transcriptome. Am J Respir Cell Mol Biol 55: 323–336, 2016. doi: 10.1165/rcmb.2015-0274MA. [DOI] [PMC free article] [PubMed] [Google Scholar]
- 39.Suprynowicz FA, Upadhyay G, Krawczyk E, Kramer SC, Hebert JD, Liu X, Yuan H, Cheluvaraju C, Clapp PW, Boucher RC Jr, Kamonjoh CM, Randell SH, Schlegel R. Conditionally reprogrammed cells represent a stem-like state of adult epithelial cells. Proc Natl Acad Sci USA 109: 20035–20040, 2012. doi: 10.1073/pnas.1213241109. [DOI] [PMC free article] [PubMed] [Google Scholar]
- 40.Wolf S, Perez GF, Mukharesh L, Isaza N, Preciado D, Freishtat RJ, Pillai D, Rose MC, Nino G. Conditional reprogramming of pediatric airway epithelial cells: a new human model to investigate early-life respiratory disorders. Pediatr Allergy Immunol 28: 810–817, 2017. doi: 10.1111/pai.12810. [DOI] [PMC free article] [PubMed] [Google Scholar]
- 41.Gentzsch M, Boyles SE, Cheluvaraju C, Chaudhry IG, Quinney NL, Cho C, Dang H, Liu X, Schlegel R, Randell SH. Pharmacological rescue of conditionally reprogrammed cystic fibrosis bronchial epithelial cells. Am J Respir Cell Mol Biol 56: 568–574, 2017. doi: 10.1165/rcmb.2016-0276MA. [DOI] [PMC free article] [PubMed] [Google Scholar]
- 42.Kielgast F, Schmidt H, Braubach P, Winkelmann VE, Thompson KE, Frick M, Dietl P, Wittekindt OH. Glucocorticoids regulate tight junction permeability of lung epithelia by modulating claudin 8. Am J Respir Cell Mol Biol 54: 707–717, 2016. doi: 10.1165/rcmb.2015-0071OC. [DOI] [PubMed] [Google Scholar]
- 43.Neubauer D, Korbmacher J, Frick M, Kiss J, Timmler M, Dietl P, Wittekindt OH, Mizaikoff B. Deuterium oxide dilution: a novel method to study apical water layers and transepithelial water transport. Anal Chem 85: 4247–4250, 2013. doi: 10.1021/ac4002723. [DOI] [PubMed] [Google Scholar]
- 44.Plasschaert LW, Žilionis R, Choo-Wing R, Savova V, Knehr J, Roma G, Klein AM, Jaffe AB. A single-cell atlas of the airway epithelium reveals the CFTR-rich pulmonary ionocyte. Nature 560: 377–381, 2018. doi: 10.1038/s41586-018-0394-6. [DOI] [PMC free article] [PubMed] [Google Scholar]
- 45.Toczyłowska-Mamińska R, Dołowy K. Ion transporting proteins of human bronchial epithelium. J Cell Biochem 113: 426–432, 2012. doi: 10.1002/jcb.23393. [DOI] [PubMed] [Google Scholar]
- 46.Chambers LA, Rollins BM, Tarran R. Liquid movement across the surface epithelium of large airways. Respir Physiol Neurobiol 159: 256–270, 2007. doi: 10.1016/j.resp.2007.06.005. [DOI] [PMC free article] [PubMed] [Google Scholar]
- 47.Kreda SM, Gynn MC, Fenstermacher DA, Boucher RC, Gabriel SE. Expression and localization of epithelial aquaporins in the adult human lung. Am J Respir Cell Mol Biol 24: 224–234, 2001. doi: 10.1165/ajrcmb.24.3.4367. [DOI] [PubMed] [Google Scholar]
- 48.Liu X, Mondal AM. Conditional cell reprogramming for modeling host-virus interactions and human viral diseases. J Med Virol 92: 2440–2452, 2020. doi: 10.1002/jmv.26093. [DOI] [PMC free article] [PubMed] [Google Scholar]
- 49.Scialo F, Daniele A, Amato F, Pastore L, Matera MG, Cazzola M, Castaldo G, Bianco A. ACE2: the major cell entry receptor for SARS-CoV-2. Lung 198: 867–877, 2020. doi: 10.1007/s00408-020-00408-4. [DOI] [PMC free article] [PubMed] [Google Scholar]
- 50.Bestle D, Heindl MR, Limburg H, van Lam van T, Pilgram O, Moulton H, Stein DA, Hardes K, Eickmann M, Dolnik O, Rohde C, Klenk HD, Garten W, Steinmetzer T, Böttcher-Friebertshäuser E. TMPRSS2 and furin are both essential for proteolytic activation of SARS-CoV-2 in human airway cells. Life Sci Alliance 3: e202000786, 2020. doi: 10.26508/lsa.202000786. [DOI] [PMC free article] [PubMed] [Google Scholar]
- 51.Liu X, Ory V, Chapman S, Yuan H, Albanese C, Kallakury B, Timofeeva OA, Nealon C, Dakic A, Simic V, Haddad BR, Rhim JS, Dritschilo A, Riegel A, McBride A, Schlegel R. ROCK inhibitor and feeder cells induce the conditional reprogramming of epithelial cells. Am J Pathol 180: 599–607, 2012. doi: 10.1016/j.ajpath.2011.10.036. [DOI] [PMC free article] [PubMed] [Google Scholar]
- 52.Brewington JJ, Filbrandt ET, LaRosa FJ 3rd, Moncivaiz JD, Ostmann AJ, Strecker LM, Clancy JP. Generation of human nasal epithelial cell spheroids for individualized cystic fibrosis transmembrane conductance regulator study. J Vis Exp 57492, 2018. doi: 10.3791/57492. [DOI] [PMC free article] [PubMed] [Google Scholar]
- 53.Gray TE, Guzman K, Davis CW, Abdullah LH, Nettesheim P. Mucociliary differentiation of serially passaged normal human tracheobronchial epithelial cells. Am J Respir Cell Mol Biol 14: 104–112, 1996. doi: 10.1165/ajrcmb.14.1.8534481. [DOI] [PubMed] [Google Scholar]
- 54.Schilpp C, Lochbaum R, Braubach P, Jonigk D, Frick M, Dietl P, Wittekindt OH. TGF-β1 increases permeability of ciliated airway epithelia via redistribution of claudin 3 from tight junction into cell nuclei. Pflugers Arch 473: 287–311, 2021. doi: 10.1007/s00424-020-02501-2. [DOI] [PMC free article] [PubMed] [Google Scholar]
- 55.Jeong K-I, Piepenhagen PA, Kishko M, DiNapoli JM, Groppo RP, Zhang L, Almond J, Kleanthous H, Delagrave S, Parrington M. CX3CR1 is expressed in differentiated human ciliated airway cells and co-localizes with respiratory syncytial virus on cilia in a G protein-dependent manner. PLoS One 10: e0130517, 2015. doi: 10.1371/journal.pone.0130517. [DOI] [PMC free article] [PubMed] [Google Scholar]
- 56.Lee IT, Nakayama T, Wu C-T, Goltsev Y, Jiang S, Gall PA, et al. ACE2 localizes to the respiratory cilia and is not increased by ACE inhibitors or ARBs. Nat Commun 11: 5453, 2020. doi: 10.1038/s41467-020-19145-6. [DOI] [PMC free article] [PubMed] [Google Scholar]
- 57.Peters-Hall JR, Coquelin ML, Torres MJ, LaRanger R, Alabi BR, Sho S, Calva-Moreno JF, Thomas PJ, Shay JW. Long-term culture and cloning of primary human bronchial basal cells that maintain multipotent differentiation capacity and CFTR channel function. Am J Physiol Lung Cell Mol Physiol 315: L313–L327, 2018. doi: 10.1152/ajplung.00355.2017. [DOI] [PMC free article] [PubMed] [Google Scholar]
- 58.Okuda K, Dang H, Kobayashi Y, Carraro G, Nakano S, Chen G, Kato T, Asakura T, Gilmore RC, Morton LC, Lee RE, Mascenik T, Yin WN, Barbosa Cardenas SM, O'Neal YK, Minnick CE, Chua M, Quinney NL, Gentzsch M, Anderson CW, Ghio A, Matsui H, Nagase T, Ostrowski LE, Grubb BR, Olsen JC, Randell SH, Stripp BR, Tata PR, O'Neal WK, Boucher RC. Secretory cells dominate airway CFTR expression and function in human airway superficial epithelia. Am J Respir Crit Care Med 203: 1275–1289, 2021. doi: 10.1164/rccm.202008-3198OC. [DOI] [PMC free article] [PubMed] [Google Scholar]
- 59.Hardiman KM, Lindsey JR, Matalon S. Lack of amiloride-sensitive transport across alveolar and respiratory epithelium of iNOS(−/−) mice in vivo. Am J Physiol Lung Cell Mol Physiol 281: L722–L731, 2001. doi: 10.1152/ajplung.2001.281.3.L722. [DOI] [PubMed] [Google Scholar]
- 60.Norlin A, Lu LN, Guggino SE, Matthay MA, Folkesson HG. Contribution of amiloride-insensitive pathways to alveolar fluid clearance in adult rats. J Appl Physiol (1985) 90: 1489–1496, 2001. doi: 10.1152/jappl.2001.90.4.1489. [DOI] [PubMed] [Google Scholar]
- 61.Pires-Neto RC, Del Carlo Bernardi F, Alves de Araujo P, Mauad T, Dolhnikoff M. The expression of water and ion channels in diffuse alveolar damage is not dependent on DAD etiology. PLoS One 11: e0166184, 2016. doi: 10.1371/journal.pone.0166184. [DOI] [PMC free article] [PubMed] [Google Scholar]
- 62.Towne JE, Harrod KS, Krane CM, Menon AG. Decreased expression of aquaporin (AQP)1 and AQP5 in mouse lung after acute viral infection. Am J Respir Cell Mol Biol 22: 34–44, 2000. doi: 10.1165/ajrcmb.22.1.3818. [DOI] [PubMed] [Google Scholar]
- 63.Zhang J, Yan M, Gu W, Chen A, Liu J, Li L, Zhang S, Liu G. Downregulation of aquaporins (AQP1 and AQP5) and Na,K-ATPase in porcine reproductive and respiratory syndrome virus-infected pig lungs. Inflammation 41: 1104–1114, 2018. doi: 10.1007/s10753-018-0762-2. [DOI] [PubMed] [Google Scholar]
- 64.Song Y, Verkman AS. Aquaporin-5 dependent fluid secretion in airway submucosal glands. J Biol Chem 276: 41288–41292, 2001. doi: 10.1074/jbc.M107257200. [DOI] [PubMed] [Google Scholar]
- 65.Roberts N, Al Mubarak R, Francisco D, Kraft M, Chu HW. Comparison of paired human nasal and bronchial airway epithelial cell responses to rhinovirus infection and IL-13 treatment. Clin Transl Med 7: 13, 2018. doi: 10.1186/s40169-018-0189-2. [DOI] [PMC free article] [PubMed] [Google Scholar]
- 66.Kotha PLN, Sharma P, Kolawole AO, Yan R, Alghamri MS, Brockman TL, Gomez-Cambronero J, Excoffon KJ. Adenovirus entry from the apical surface of polarized epithelia is facilitated by the host innate immune response. PLoS Pathog 11: e1004696, 2015. doi: 10.1371/journal.ppat.1004696. [DOI] [PMC free article] [PubMed] [Google Scholar]
- 67.Zou L, Ruan F, Huang M, Liang L, Huang H, Hong Z, Yu J, Kang M, Song Y, Xia J, Guo Q, Song T, He J, Yen HL, Peiris M, Wu J. SARS-CoV-2 viral load in upper respiratory specimens of infected patients. N Engl J Med 382: 1177–1179, 2020. doi: 10.1056/NEJMc2001737. [DOI] [PMC free article] [PubMed] [Google Scholar]
- 68.Milewska A, Kula-Pacurar A, Wadas J, Suder A, Szczepanski A, Dabrowska A, Owczarek K, Marcello A, Ochman M, Stacel T, Rajfur Z, Sanak M, Labaj P, Branicki W, Pyrc K. Replication of severe acute respiratory syndrome coronavirus 2 in human respiratory epithelium. J Virol 94: e00957-20, 2020. doi: 10.1128/JVI.00957-20. [DOI] [PMC free article] [PubMed] [Google Scholar]
- 69.Hao S, Ning K, Kuz CA, Vorhies K, Yan Z, Qiu J. Long-term modeling of SARS-CoV-2 infection of in vitro cultured polarized human airway epithelium. mBio 11: e02852-20, 2020. doi: 10.1128/mBio.02852-20. [DOI] [PMC free article] [PubMed] [Google Scholar]