

Abstract
Background
Advances in chest computed tomography (CT) have resulted in more frequent detection of subcentimeter pulmonary nodules (SCPNs), some of which are non‐benign and may represent invasive lung cancer. The present study aimed to explore the correlation between pathological diagnosis and the CT imaging manifestations of SCPNs.
Methods
This retrospective study included patients who underwent pulmonary resection for SCPNs at Shandong Provincial Hospital in China. Lesions were divided into five categories according to their morphological characteristics on CT: cotton ball, solid‐filled with spiculation, solid‐filled with smooth edges, mixed‐density ground‐glass, and vacuolar. We further analyzed lesion size, enhancement patterns, vascular aggregation, and SCPN traversing. Chi‐square tests, Fisher's exact tests, and Welch's one‐way analysis of variance were used to examine the correlation between CT imaging characteristics and pathological type.
Results
There were statistically significant differences in the morphological distributions of SCPNs with different pathological types, including benign lesions and malignant lesions at different stages (p < 0.01). The morphological distributions of the four subtypes of invasive lung adenocarcinoma also exhibited significant differences (p < 0.01). In addition, size and enhancement patterns differed significantly among different pathological types of SCPNs.
Conclusion
Different pathological types of SCPNs exhibit significant differences based on their morphological category, size, and enhancement pattern on CT imaging. These CT characteristics may assist in the qualitative diagnosis of SCPNs.
Keywords: adenocarcinoma, computed tomography imaging, histopathology, morphological, subcentimeter pulmonary nodules (SCPNs)
Different pathological types of SCPNs exhibit significant differences based on their morphological category, size, and enhancement pattern on CT imaging. Given that most patients with SCPNs present with no clinical manifestations, these differences may be of substantial diagnostic value.

INTRODUCTION
With an estimated 2.2 million new cancer cases and 1.8 million deaths in 2020, lung cancer has become the second most commonly diagnosed cancer and the leading cause of cancer death, representing approximately 1 in 10 cancers diagnosed and 1 in 5 deaths. 1 Although survival rates for all cancers have improved in recent years, the survival rate for lung cancer remains one of the lowest because patients are often diagnosed at later stages, when curative treatment is not possible. However, timely diagnosis and accurate treatment strategies in the early stage of lung cancer can significantly improve patient survival. 2
Advances in imaging technology and widespread use of chest computed tomography (CT) have enabled greater detection of small lung lesions, 3 some of which present as subcentimeter pulmonary nodules (SCPNs). Determining the nature of SCPNs (i.e., lung nodules with a maximum diameter ≤1 cm) remains challenging. In addition to the extra costs and procedural risk of biopsy, these small lesions are clinically difficult to puncture, and histological types are difficult to identify based on cytology specimens. 4 , 5 Non‐invasive imaging modalities used to evaluate SCPNs mainly include PET‐CT and CT. However, previous studies have reported that the diagnostic value of PET‐CT for detecting SCPNs is limited. 6 SCPNs exhibit different morphologies on CT images, including differences in size, shape, edge patterns, and density. However, few studies have analyzed SCPNs based on CT characteristics, 7 , 8 and whether these differences are regular and useful for diagnosis remains to be determined.
In the present retrospective study, we aimed to investigate the diagnostic value of CT imaging characteristics for SCPNs, especially for the identification of early lung cancer.
METHODS
Patients
Between June 2018 and December 2020, a total of 462 patients with solitary SCPNs underwent surgical resection in the Department of Thoracic Surgery, East Hospital of Shandong Provincial Hospital. The hospital records of all these patients were reviewed. The study was approved by the Medical Ethics Commission of Shandong Provincial Hospital (No. 2019‐106), and all patients signed their informed consent. This study included 354 patients with solitary SCPNs who underwent pulmonary resection at Shandong Provincial Hospital. Criteria for inclusion in the analysis were as follows: (1) thin‐layer chest CT (≤1.0 mm) performed within 2 weeks before surgery; (2) pulmonary nodules on CT imaging with a maximum diameter ≤10 mm in the lung window; (3) R0 surgical resection of solitary SCPNs; (4) complete, good quality images. The exclusion criteria were as follows: (1) multiple pulmonary nodules; (2) absence of imaging, pathological, or clinical data; (3) previous medical history of malignant tumor; (4) treatment of pulmonary nodules with puncture or conservative therapy. Finally, data were collected for a total of 354 consecutive patients.
CT scan protocol
CT scans were performed during deep inspiration at total lung capacity from the thoracic inlet to the upper portion of the kidneys using a Toshiba Aquilion One 640 CT scanner (Toshiba Corporation). The protocol parameters were as follows: tube voltage, 120 kVp; tube current, 40–60 mAs; and slice thickness, 1.0 mm. For contrast‐enhanced CT, a 60–80 ml bolus of ioversol (350 mg/ml) (Jiangsu Hengrui Pharmaceutical Co. Ltd) was injected into a cubital fossa vein at a flow rate of 3.0–3.5 ml/s using a power injector (Ulrich GmbH & Co.). Image acquisition started 65 s after completion of the injection. Images were reconstructed using high‐resolution lung tissue and mediastinal soft tissue algorithms.
Pathological diagnosis
All pathological specimens were obtained after surgical resection (including wedge and pulmonary segment resections, and pulmonary lobectomy). The specimens were fixed in 10% neutral formalin, embedded in paraffin, and stained with hematoxylin and eosin. Pathological diagnosis and categorization of atypical adenomatous hyperplasia (AAH), adenocarcinoma in situ (AIS), minimally invasive adenocarcinoma (MIA), and invasive adenocarcinoma (IAC) were made based on the new pulmonary adenocarcinoma classification (2011 edition). 9 Two pathologists with more than 15 years working experience determined the pathological diagnosis, and any disagreement was resolved through mutual consultation.
Nodule evaluation
SCPNs in the lung window (window width, 1500 HU; window level, −500 HU) and mediastinal window (window width, 350 HU; window level, 50 HU) were located for observation. Based on their density, pulmonary nodules were divided into pure ground‐glass nodules (pGGNs), mixed ground‐glass nodules (mGGNs), and solid nodules (SNs). Ground‐glass nodules (GGNs) were defined as those with hazily increased attenuation in the lung with preservation of contour in the bronchial and vascular structures. SNs were defined as soft tissue densities obscuring lung texture as well as the bronchial and vascular contours, while mGGNs were defined as those with increased focal density containing both ground glass and solid components. 10
We analyzed two categories of CT features for SCPNs: overall morphological features and detailed image features. According to the classification method of previous studies, 11 , 12 , 13 combined with the data collected at our hospital, nodules were divided into five morphological characteristics types (Figure 1):
Type I (cotton ball): lesions presenting as round or oval nodules, pGGNs, or mGGNs, with a shape similar to that of a cotton ball. For mGGNs, small amounts of solid components located in the center and surrounded by GGO can also present cotton ball–like morphology.
Type II (solid‐filled with spiculation): lesions presenting as round or oval SNs with spiculations visible at the edges.
Type III (solid‐filled with smooth edges): solid circular or elliptical lesions with smooth edges.
Type IV (mixed‐density ground‐glass nodules): lesions mainly composed of ground glass components in the lung window, with some solid components distributed in the center or periphery of the nodule, or in the form of granular distribution.
Type V (vacuolar): lesions characterized by single or multiple vacuoles (i.e., cavities of air density).
FIGURE 1.
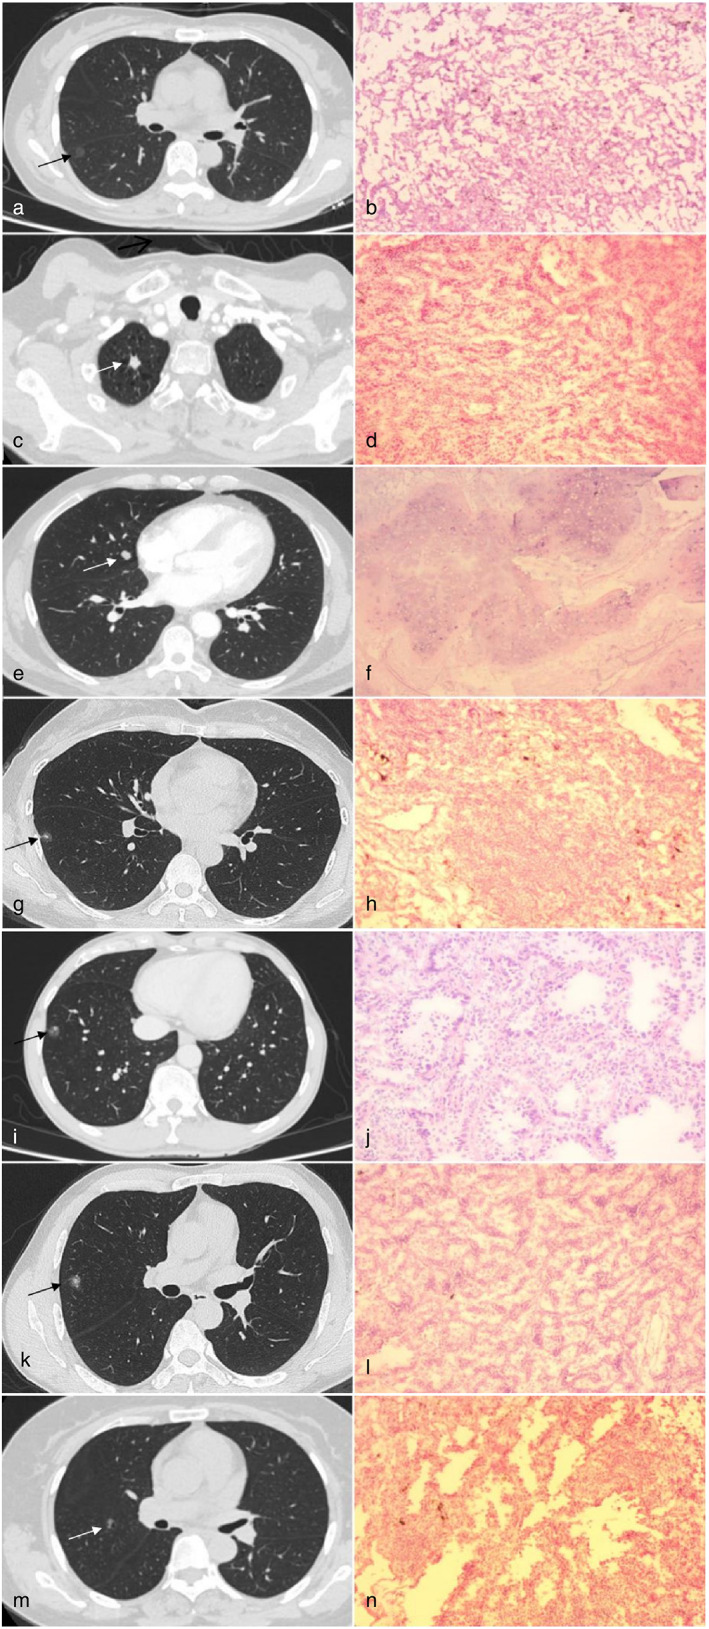
Five different morphological types. The left side of each line is the image, and the right side is the paraffin pathology. (a) Type I, cotton ball. (b) Adenocarcinoma in situ. (c) Type II, solid filled with spiculation. (d) Invasive adenocarcinoma. (e) Type III, solid filled with smooth edges). (f) Pulmonary hamartoma. (g) Type IV,mixed density ground glass nodule, solid components distributed in the center. (h) Inflammatory pseudotumor. (i) Type IV, mixed density ground glass nodule, solid components distributed in the periphery. (j) Invasive adenocarcinoma. (k) Type IV, mixed density ground‐glass nodule, solid components are in the form of granular distribution. (l) Invasive adenocarcinoma. (m) Type V, vacuolar. (n) Invasive adenocarcinoma
Radiographic details of SCPNs including size, degree of enhancement on contrast‐enhanced CT, and the relationship between nodules and blood vessels were also analyzed. SCPN size was evaluated based on two‐dimensional length. Data were obtained using the semi‐automatic measurement software Centricity RIS/PACS Web Report (General Electric Medical Systems Co., Ltd). Nodules were located in the pulmonary window (window width, 1500 HU; window level, −500 HU), and the length and width measurements were made on the magnified image that represented the largest cross‐sectional area of the nodule, following which the two‐dimensional length of the nodule was calculated as the average of its length and width. 14
Nodules were considered significantly enhanced if any of the images obtained after the injection of ioversol exhibited enhancement greater than 15 HU. 15 If SCPNs contained vessels traversing or gathering blood vessels, the relationship between SCPNs and blood vessels was defined as positive, abbreviated as BV (+). Otherwise, it was defined as BV (−).
All nodules were evaluated by two radiologists with more than 15 years of radiology experience. Any disagreement was discussed and resolved through mutual consultation.
Statistical analysis
SPSS 25.0 (IBM Corporation) was used for statistical analysis. A chi‐square test was used to determine the distribution of the five morphological types of nodules, degree of enhancement, and relationship between nodules and blood vessels for different pathological types. If any lattice count was less than 5, Fisher's exact test was used. A Fisher‐Freeman‐Halton's test was calculated via Monte Carlo sampling. For pairwise comparisons of preinvasive lesions, MIA, IAC, and the four subtypes of IAC, Chi‐square or Fisher's exact test was used with a Bonferroni's correction of p‐value. Quantitative data are expressed as the mean ± standard deviation, and the Shapiro–Wilk test was used to verify the normality of continuous variables (i.e., lesion sizes for different pathological types). One‐way ANOVA was used if the data displayed a normal distribution, otherwise the nonparametric test was used. Levene's homogeneity of variance test was applied, and if the variance was homogeneous, a classical one‐way ANOVA was used. If the variances were not homogenous, Welch's one way analysis of variance test was used. Pairwise comparisons were performed using the Games‐Howell post hoc test. p < 0.05 was considered statistically significant.
RESULTS
Basic characteristics
A total of 354 patients with SCPNs were included in the study, including 121 men and 233 women. All participants ranged from 20 to 80 years of age, with a median age of 52 years. There were 47 smokers and 307 non‐smokers. There were no statistically significant differences in sex distribution or smoking history between patients with benign lesions and those with malignant lesions (p > 0.05). No cases of lymph node metastasis were observed in patients with malignant lung nodules. The clinical characteristics and histopathological classifications for the included patients are shown in Table 1.
TABLE 1.
Clinical characteristics and histopathological classification
| Characteristics | Overall | |
|---|---|---|
| Sex | Male | 121 (34.2%) |
| Female | 233 (65.8%) | |
| Age (years old) | Median (range) | 52 (20–80) |
| Smoking | Yes | 47 (13.3%) |
| No | 307 (86.7%) | |
| Tumor location | Right upper lobe | 108 (30.5%) |
| Right middle lobe | 30 (8.5%) | |
| Right lower lobe | 66 (18.6%) | |
| Left upper lobe | 90 (25.4%) | |
| Left lower lobe | 60 (17.0%) | |
| Histopathology | AAH | 28 (7.9%) |
| AIS | 103 (29.1%) | |
| MIA | 86 (24.3%) | |
| IAC | 92 (26.0%) | |
| Benign lesions | 43 (12.1%) | |
| SCLC | 2 (0.6%) | |
| Histological subtype | Acinar‐predominant | 59 (64.1%) |
| Lepidic‐predominant | 19 (20.7%) | |
| Papillary‐predominant | 10 (10.9%) | |
| Mucinous adenocarcinoma | 4 (4.3%) |
Morphological distribution of different pathological types
Pathological types of SCPNs were distributed as follows: twenty‐six cases of inflammatory pseudotumor (IP), four cases of pulmonary tuberculosis (TB), three cases of intrapulmonary lymph nodes, two cases of small cell lung cancer (SCLC), six cases of pulmonary hamartoma (HT), four cases of bronchial adenoma (BA), and 309 cases of various types of lung adenocarcinoma and premalignant lesions. The morphological classification data for SCPNs with different pathological types are shown in Table 2.
TABLE 2.
Morphological classification data of different pathological types
| Group | Morphological type | Total | ||||
|---|---|---|---|---|---|---|
| Type 1 | Type 2 | Type 3 | Type 4 | Type 5 | ||
| AAH | 17 (60.7%) | 4 (14.3%) | 0 (0.0%) | 5 (17.9%) | 2 (7.1%) | 28 (100%) |
| AIS | 82 (79.6%) | 1 (1.0%) | 0 (0.0%) | 12 (11.7%) | 8 (7.8%) | 103 (100%) |
| MIA | 60 (69.8%) | 5 (5.8%) | 1 (1.2%) | 18 (20.9%) | 2 (2.3%) | 86 (100%) |
| IAC | 14 (15.2%) | 34 (37.8%) | 5 (5.4%) | 30 (33.8%) | 9 (6.8%) | 92 (100%) |
| IP | 4 (15.4%) | 12 (46.2%) | 4 (15.4%) | 4 (15.4%) | 2 (7.6%) | 26 (100%) |
| PH | 0 (0.0%) | 1 (16.7%) | 5 (83.3%) | 0 (0.0%) | 0 (0.0%) | 6 (100%) |
| BA | 1 (25.0%) | 0 (0.0%) | 1 (25.0%) | 2 (50.0%) | 0 (0.0%) | 4 (100%) |
| LN | 0 (0.0%) | 0 (0.0%) | 3 (100.0%) | 0 (0.0%) | 0 (0.0%) | 3 (100%) |
| TB | 1 (25.0%) | 0 (0.0%) | 1 (25.0%) | 1 (25.0%) | 1 (25.0%) | 4 (100%) |
| SCLC | 0 (0.0%) | 0 (0.0%) | 2 (100.0%) | 0 (0.0%) | 0 (0.0%) | 2 (100%) |
| Total | 179 (50.6%) | 57 (16.1%) | 22 (6.2%) | 72 (20.3%) | 24 (6.8%) | 354 (100%) |
Note: Type I, cotton ball; type II, solid filled with spiculation; type III, solid filled with smooth edges; type IV, mixed density ground‐glass nodule; type V, vacuolar.
Abbreviations: AAH, atypical adenomatous hyperplasia; AIS, adenocarcinoma in situ; BA, bronchial adenoma; IAC, invasive adenocarcinoma; IP, inflammatory pseudotumor; LN, lymph nodes; MIA, minimally invasive adenocarcinoma; PH, pulmonary hamartoma; SCLC, small cell lung cancer; TB, tuberculosis.
Type I (cotton ball) lesions were the most common type of SCPN (179 cases, 50.6%). Almost all cases of this morphological type were lung adenocarcinoma and premalignant lesions (173 cases, 96.6%). Type II (solid‐filled with spiculation) lesions were observed in 57 cases (16.1%), the majority of which were IAC (34 cases, 59.6%). Type III (solid‐filled with smooth edges) were observed in 22 cases (6.2%), most of which were benign (14 cases, 63.6%), although there were two cases of SCLC in this group. Type IV (mixed‐density ground‐glass nodules) were observed in 72 cases, 65 of which were lung adenocarcinoma and premalignant lesions, and infiltrating lesions (MIA + IAC) were observed in 48 cases. Type V (vacuolar) lesions were observed in 24 cases (6.8%), most of which were lung adenocarcinoma and premalignant lesions (21 cases, 87.5%). The remaining three cases were benign (inflammatory pseudotumor, n = 2; tuberculosis, n = 1).
Based on the degree of infiltration, the 309 cases of lung adenocarcinoma and premalignant lesions were divided into three groups (Table S3): preinfiltrating lesions including AAH and AIS, MIA, and IAC. Pairwise comparisons (Table S1) were corrected by using Bonferroni's correction of p‐value, and p < 0.0167(0.05/3) was considered statistically significant. There were statistically significant morphological differences in the pairwise comparison among the three groups, except for the comparison between MIA and preinfiltrating lesions (p = 0.115).
Morphological distribution of different IAC subtypes
A total of 92 SCPNs examined in this study were IAC. The pathological subtypes included acinar‐predominant adenocarcinoma (59 cases, 64.1%), lepidic‐predominant adenocarcinoma (19 cases, 20.7%), papillary‐predominant adenocarcinoma (10 cases, 10.9%) and invasive mucinous adenocarcinoma (4 cases, 4.3%) (Table 3). Fourteen of the 92 IACs were type I (cotton ball) lesions, most of which were lepidic‐predominant adenocarcinoma (11 cases, 78.6%). Type II (solid‐filled with spiculation) lesions were observed in 34 cases, most of which were acinar‐predominant adenocarcinoma (25 cases, 73.5%). There were five type III lesions, including three cases of mucinous adenocarcinoma and two cases of acinar‐predominant adenocarcinomas. Type IV (mixed‐density ground‐glass nodules) lesions were observed in 30 cases, the majority of which were acinar‐predominant adenocarcinoma (20 cases 66.7%). Type V lesions were observed in nine cases, all of which were acinar‐predominant adenocarcinoma. Pairwise comparisons (Table S2) were corrected using Bonferroni's correction of p‐value; p < 0.0083(0.05/6) was considered statistically significant. There were statistically significant morphological differences in the pairwise comparison among the four subtypes, except for the comparison between the acinar‐predominant and papillary‐predominant types (p = 0.588).
TABLE 3.
Morphological classification data of different pathological subtypes of IAC
| Group | Morphological type | p‐value | ||||
|---|---|---|---|---|---|---|
| Type 1 | Type 2 | Type 3 | Type 4 | Type 5 | ||
| Mucinous adenocarcinoma | 0 (0.0%) | 0 (0.0%) | 3 (75.0%) | 1 (25.0%) | 0 (0.0%) | <0.001 |
| Papillary‐predominant | 0 (0.0%) | 7 (70.0%) | 0 (0.0%) | 3 (30.0%) | 0 (0.0%) | |
| Lepidic‐predominant | 11 (57.9%) | 2 (10.5%) | 0 (0.0%) | 6 (31.6%) | 0 (0.0%) | |
| Acinar‐predominant | 3 (5.1%) | 25 (42.4%) | 2 (3.4%) | 20 (33.9%) | 9 (15.3%) | |
| Total | 14 (15.2%) | 34 (37.0%) | 5 (5.4%) | 30 (32.6%) | 9 (9.8%) | |
Note: Type I, cotton ball; type II, solid filled with spiculation; type III, solid filled with smooth edges; type IV, mixed density ground‐glass nodule; type V, vacuolar.
SCPN size, enhancement, and relationship with blood vessels
For this analysis, SCPNs were categorized into four groups according to pathological diagnosis: benign lesions, preinfiltrating lesions (AAH + AIS), MIA, and IAC. After the Shapiro–Wilk test and Levene's homogeneity of variance test, Welch's one‐way analysis of variance was used. The difference in two‐dimensional length among the four pathological groups was statistically significant (Table 4) (Welch's F = 114.091, p < 0.01). The two‐dimensional length of lung nodules was 7.36 ± 0.59 mm in the benign group, 7.95 ± 0.56 mm in the preinfiltration group, 8.38 ± 0.65 mm in the MIA group, and 8.94 ± 0.46 mm in the IAC group. The Games–Howell test was applied to pairs, and the results indicated that the difference between the groups was statistically significant (p < 0.01).
TABLE 4.
The two‐dimensional length of lesions in four groups
| Group | Cases | Mean | Standard deviation | Standard error | 95% CI | Minimum | Maximum | p‐value | |
|---|---|---|---|---|---|---|---|---|---|
| Low limit | Upper limit | ||||||||
| BL | 43 | 7.36 | 0.59 | 0.09 | 7.18 | 7.54 | 6.05 | 8.37 | <0.001 |
| AAH + AIS | 131 | 7.95 | 0.56 | 0.05 | 7.85 | 8.04 | 6.5 | 9.28 | |
| MIA | 86 | 8.38 | 0.65 | 0.07 | 8.25 | 8.52 | 6.63 | 9.59 | |
| IAC | 92 | 8.94 | 0.46 | 0.05 | 8.85 | 9.04 | 7.87 | 9.88 | |
| TOTAL | 352 | 8.24 | 0.76 | 0.04 | 8.16 | 8.32 | 6.05 | 9.88 | |
Note: BL, benign lesions; AAH, atypical adenomatous hyperplasia; AIS, adenocarcinoma in situ; MIA, minimally invasive adenocarcinoma; IAC, invasive adenocarcinoma.
We also analyzed the degree of enhancement and the relationship between SCPNs and blood vessels in each of the four groups (Tables 5 and 6). There were statistically significant differences in enhancement among the different pathological types (p < 0.01). The enhancement probability in the IAC group was higher than that in the other three groups, reaching 53.3%. The proportion reached 25.6% for benign lesions, 12.8% for MIA, and 9.2% for preinfiltrating lesions. There were no significant differences in the relationships of SCPNs with blood vessels among the four groups (p > 0.05).
TABLE 5.
Enhancement among four groups
| Group | BL | AAH + AIS | MIA | IAC | χ 2 | p‐value | |
|---|---|---|---|---|---|---|---|
| Enhancement | − | 32 | 119 | 75 | 43 | 65.745 | <0.01 |
| + | 11 | 12 | 11 | 49 |
TABLE 6.
Relationship with blood vessels among four groups
| Group | BL | AAH + AIS | MIA | IAC | χ 2 | p‐value | |
|---|---|---|---|---|---|---|---|
| BV | − | 29 | 94 | 56 | 66 | 1.399 | 0.713 |
| + | 14 | 37 | 30 | 26 | |||
Abbreviations: AAH, atypical adenomatous hyperplasia; AIS, adenocarcinoma in situ; BL, benign lesions; IAC, invasive adenocarcinoma; MIA, minimally invasive adenocarcinoma.
DISCUSSION
CT is commonly used for rapid and clear volume‐based imaging of the chest and is of unquestionable value in the detection of small lung nodules and lung cancer. The National Lung Cancer Screening Trial in the United States has shown that low‐dose CT screening can reduce lung cancer mortality in high‐risk individuals by 20%. 16 However, with the more frequent identification of small pulmonary nodules—especially SCPNs—the qualitative diagnosis of pulmonary nodules has become a new problem. To address this issue, we explored the correlation between pathological diagnosis and the CT imaging manifestations of SCPNs. Our findings indicated that different pathological types of SCPNs exhibit significant differences based on their morphological category, size, and enhancement pattern on CT imaging. Given that most patients with SCPNs present with no clinical manifestations, these differences may be of substantial diagnostic value.
Smoking is recognized a major risk factor for lung cancer, however, in our study, 272 of 311 patients with malignant SCPNs were nonsmokers, accounting for 87.5%. Thus, the proportion of smokers was nearly the same as that in the benign group, in contrast to previous findings. 17 This may be because, except for the two cases of SCLC, all malignant SCPNs in our study were adenocarcinoma. The relationship of smoking with lung adenocarcinoma is weaker than that with lung squamous cell carcinoma and SCLC. Additionally, our patients were relatively young on average, and there were only 38 patients aged 65 years or older. All patients belonged to the Eastern Asian population, and research has indicated that the proportion of lung cancer in never‐smokers in Eastern Asian has increased over time. 18 With the successful implementation of smoking prevention and cessation programs, the proportion of lung cancer in nonsmokers is expected to increase continuously. Our result may have also been influenced by the selection bias inherent to studies with small sample sizes, highlighting the need for additional clinical data regarding SCPNs to determine their relationship with smoking.
“Traditional lung cancers” are mostly large, solid lung malignant tumors. 19 These lung cancers exhibit well‐known imaging characteristics such as lobulation, spiculation, air bronchogram, pleural indentation, and vessel convergence. 20 , 21 , 22 , 23 However, these features are of limited value for the qualitative diagnosis of SCPNs. Importantly, our data indicate that SCPNs exhibit certain CT imaging features that can assist in qualitative diagnosis. In our study, most SCPNs were type I (cotton ball) lesions (179, 50.6%). While most cases presented as AAH, AIS, and MIA (159, 88.8%), some cases of IAC were also observed in the type I group (14, 15.2%), with low‐grade malignant histological subtypes of lepidic‐predominant adenocarcinoma and acinar‐predominant adenocarcinoma. These findings are consistent with those of previous studies. 24 , 25 , 26 Despite the high probability of malignancy, prognosis in patients with type I lesions is still rather good. 27
Because their alveolar cavities are filled with cells or cellular secretions, type II (solid‐filled with spiculation) and type III (solid‐filled with smooth edges) lesions appear solid. 10 , 28 .The two types differ based on the presence of spiculation at the edges of lesion, which is mainly related to the inflammatory response, connective tissue hyperplasia, or external invasion of cancer tissue along the blood vessels and bronchi. 29 , 30 .In the current study, type II lesions were mainly adenocarcinoma, followed by inflammatory pseudotumor. These two types are very similar on imaging and can be difficult to distinguish. However, our findings indicated that adenocarcinoma exhibited a significantly higher proportion of enhancement on enhanced CT images, suggesting that the enhancement pattern can assist in identifying the nature of type II nodules. In contrast, most type III lesions were benign. These small, solid nodules with smooth edges on CT images often indicate IPs, HTs, and intrapulmonary lymph nodes. There were five cases of IAC (3 mucinous adenocarcinoma and 2 acinar‐predominant adenocarcinoma) that manifested as type III; it is worthy of note that two cases of SCLC also manifested as this type. However, for type III lesions, there was no significant difference in the enhancement ratio of benign and malignant lesions, as HTs and intrapulmonary lymph nodes also exhibited larger enhancement ratios. Furthermore, three cases of type III mucinous adenocarcinoma that we collected were all close to the chest wall and located in the lower lobe of the lung.
SCLC is a highly malignant neuroendocrine tumor characterized by rapid growth, early metastasis, and spread to regional lymph nodes and distant sites. 31 SCLC often appears as a solid tumor with clear borders, a lobulated form, and enhancement on CT. Such tumors are usually found late, meaning that their volumes are relatively large. In the current study, two type III SCPNs were SCLC and exhibited CT imaging characteristics that differ from those of larger SCLCs. According to our institution's experience, SCPNs with smooth edges are not necessarily benign, and they may even be highly malignant. Given this difficulty with imaging performance, follow‐up is necessary for SCPNs that manifest as type III lesions. We believe that 3 months is an appropriate interval for the first follow up. In most situations, volume changes will be observed during short‐term follow‐up in cases of high‐grade malignant nodules, but not in cases of benign nodules. Furthermore, short‐term follow‐up can avoid delays in the treatment of malignant tumors.
Type IV (mixed‐density ground‐glass nodules) lesions include both solid and ground‐glass components in the lung window. Some tumor cells will grow along the alveolar wall without completely filling the alveolar cavity, while other cells and secreted mucus will gradually fill the cavity. At the same time, fibrous tissue proliferation gradually increases, and the alveolar structure collapses. 11 Most type IV lesions are lung adenocarcinoma, particularly invasive lung adenocarcinoma. However, in all patients with SCPNs, this type is highly suggestive of malignancy and invasiveness. Thus, we believe that it is necessary to increase vigilance when screening reveals type IV lesions.
Type V (vacuolar) lesions are characterized by single or multiple vacuoles, which refer to cavities of air density. The growth of tumor cells destroys the scaffold tissue of the central lung, leading to the formation of vacuoles. Multiple small vacuoles can merge to form larger or polygonal vacuoles. 32 In the current study, 21 of 24 type V lesions were lung adenocarcinoma, while the remaining lesions represented IP (n = 2) or tuberculosis (n = 1). Uneven thickness of the cavity wall is a malignant sign, which is also helpful for the diagnosis of SCPNs.
Our analysis also indicated that there were significant differences in lesion size among the different pathological types. Especially for malignant SCPNs, the degree of invasion gradually increased with increasing size. This is consistent with our previous research. 33 , 34 The results of our study also corroborated the finding that CT enhancement >15 HU is statistically significant for the detection of malignant SCPNs. 35 However, enhancement combined with morphological classification has greater diagnostic value. As mentioned above, enhancement is valuable for qualitative identification in cases of type II lesions, but in cases of type III lesions. Previous studies investigating the relationship between SCPNs and blood vessels have yielded inconsistent results. 7 Our analysis indicated that vascular aggregation and traversing were not statistically significant for the identification of SCPNs.
In addition, we believe that follow‐up is relevant in the qualitative diagnosis of SCPNs. The National Comprehensive Cancer Network (NCCN) guidelines recommend determining the risk of nodule formation based on individual characteristics such as age; smoking, family, and exposure history, and imaging manifestations of lung nodules. 36 , 37 However, with the rising incidence of lung adenocarcinoma and the increased number of non‐smokers and younger patients with lung cancer, individual characteristics are increasingly difficult for use in determining the degree of the risk of developing nodules. Moreover, the follow‐up of radiological factors plays an increasingly important role in determining the degree of the risk of nodular formation. Almost all SCPNs that received surgical treatment at our center underwent a follow‐up period of at least one month. Short‐term follow‐up can identify mostly pneumonia and assist in identifying some type III solid nodules. According to our data, the risk of developing lung nodules differed among the five morphological types. As types I, IV, and V lung nodules are mostly preinvasive lesions or low‐grade malignancies, follow‐up intervals of 6–12 months are appropriate. Meanwhile, a short‐term follow‐up period of 1–3 months is appropriate for types II and III lung nodules.
Although many imaging studies have investigated the characteristics of small lung nodules, few have focused on SCPNs. We first classified SCPNs into five morphological types, following which size and enhancement were incorporated for diagnosis. This method is effective and easy to implement. Nevertheless, our study also had some limitations. First, it had a clear selection bias, as we only included patients who had undergone surgery. Second, some factors were measured manually (enhancement, vascular aggregation), which inevitably leads to some error. In addition, the sample size was small, highlighting the need for additional data to determine the correlation between CT features and pathological typing for SCPNs.
In conclusion, different pathological types of SCPNs exhibit significant differences based on their morphological category, size, and enhancement pattern on CT imaging. These CT characteristics may assist in the qualitative diagnosis of SCPNs.
CONFLICT OF INTEREST
The authors declare that they have no competing interests.
Supporting information
Supplemental Table S1 Different distributions of five morphological types in different type of pathological.
Supplemental Table S2: Different distributions of five morphological types in different subtypes of invasive adenocarcinoma.
Supplemental Table S3: Different distributions of five morphological types in lung adenocarcinoma and premalignant lesions.
ACKNOWLEDGMENTS
The authors would like to thank the Medical Imaging Department of Shandong Provincial Hospital for the imaging support.
This work was supported by the National Natural Science Foundation of Shandong province (grant number ZR2019BH072).
Hu B, Ren W, Feng Z, Li M, Li X, Han R, et al. Correlation between CT imaging characteristics and pathological diagnosis for subcentimeter pulmonary nodules. Thorac Cancer. 2022;13:1067–1075. 10.1111/1759-7714.14363
Benchuang Hu and Wangang Ren contributed equally to this work and should be considered cofirst authors.
Funding information Natural Science Foundation of Shandong province, Grant/Award Number: ZR2019BH072
REFERENCES
- 1. Sung H, Ferlay J, Siegel RL, Laversanne M, Soerjomataram I, Jemal A, et al. Global cancer statistics 2020: GLOBOCAN estimates of incidence and mortality worldwide for 36 cancers in 185 countries. CA Cancer J Clin. 2021;71(3):209–49. 10.3322/caac.21660 [DOI] [PubMed] [Google Scholar]
- 2. Oudkerk M, Liu S, Heuvelmans MA, Walter JE, Field JK. Lung cancer LDCT screening and mortality reduction – evidence, pitfalls and future perspectives. Nat Rev Clin Oncol. 2021;18(3):135–51. 10.1038/s41571-020-00432-6 [DOI] [PubMed] [Google Scholar]
- 3. Lv Y, Ye B. Advances in diagnosis and management of subcentimeter pulmonary nodules. Zhongguo Fei Ai Za Zhi. 2020;23(5):365–70. 10.3779/j.issn.1009-3419.2020.102.11 [DOI] [PMC free article] [PubMed] [Google Scholar]
- 4. Jiang G, Chen C, Zhu Y, Xie D, Dai J, Jin K, et al. Shanghai pulmonary hospital experts consensus on the Management of Ground‐Glass Nodules Suspected as lung adenocarcinoma (version 1). Zhongguo Fei Ai Za Zhi. 2018;21(3):147–59. 10.3779/j.issn.1009-3419.2018.03.05 [DOI] [PMC free article] [PubMed] [Google Scholar]
- 5. Zhou Q, Fan Y, Wang Y, Qiao Y, Wang G, Huang Y, et al. China National Guideline of classification, diagnosis and treatment for lung nodules (2016 version). Zhongguo Fei Ai Za Zhi. 2016;19(12):793–8. 10.3779/j.issn.1009-3419.2016.12.12 [DOI] [PMC free article] [PubMed] [Google Scholar]
- 6. Suh YJ, Park CM, Han K, Jeon SK, Kim H, Hwang EJ, et al. Utility of FDG PET/CT for preoperative staging of non‐small cell lung cancers manifesting as subsolid nodules with a solid portion of 3 cm or smaller. AJR Am J Roentgenol. 2020;214(3):514–23. 10.2214/ajr.19.21811 [DOI] [PubMed] [Google Scholar]
- 7. Gao F, Sun Y, Zhang G, Zheng X, Li M, Hua Y. CT characterization of different pathological types of subcentimeter pulmonary ground‐glass nodular lesions. Br J Radiol. 2019;92(1094):20180204. 10.1259/bjr.20180204 [DOI] [PMC free article] [PubMed] [Google Scholar]
- 8. Mi J, Wang S, Li X, Jiang G. clinical characteristics and prognosis of sub‐centimeter lung adenocarcinoma. Zhongguo Fei Ai Za Zhi. 2019;22(8):500–6. 10.3779/j.issn.1009-3419.2019.08.04 [DOI] [PMC free article] [PubMed] [Google Scholar]
- 9. Travis WD, Brambilla E, Noguchi M, Nicholson AG, Geisinger KR, Yatabe Y, et al. International association for the study of lung cancer/american thoracic society/european respiratory society international multidisciplinary classification of lung adenocarcinoma. J Thorac Oncol. 2011;6(2):244–85. 10.1097/JTO.0b013e318206a221 [DOI] [PMC free article] [PubMed] [Google Scholar]
- 10. Hansell DM, Bankier AA, MacMahon H, McLoud TC, Müller NL, Remy J. Fleischner society: glossary of terms for thoracic imaging. Radiology. 2008;246(3):697–722. 10.1148/radiol.2462070712 [DOI] [PubMed] [Google Scholar]
- 11. Gao F, Li M, Zhang Z, Xiao L, Zhang G, Zheng X, et al. Morphological classification of pre‐invasive lesions and early‐stage lung adenocarcinoma based on CT images. Eur Radiol. 2019;29(10):5423–30. 10.1007/s00330-019-06149-0 [DOI] [PubMed] [Google Scholar]
- 12. van Riel SJ, Sánchez CI, Bankier AA, Naidich DP, Verschakelen J, Scholten ET, et al. Observer variability for classification of pulmonary nodules on low‐dose CT images and its effect on nodule management. Radiology. 2015;277(3):863–71. 10.1148/radiol.2015142700 [DOI] [PubMed] [Google Scholar]
- 13. Li Q, He XQ, Fan X, Luo TY, Huo JW, Huang XT. Computed tomography morphological classification of lung adenocarcinoma and its correlation with epidermal growth factor receptor mutation status: a report of 1075 cases. Int J Gen Med. 2021;14:3687–98. 10.2147/ijgm.S316344 [DOI] [PMC free article] [PubMed] [Google Scholar]
- 14. Henschke CI, Yankelevitz DF, Yip R, Reeves AP, Farooqi A, Xu D, et al. Lung cancers diagnosed at annual CT screening: volume doubling times. Radiology. 2012;263(2):578–83. 10.1148/radiol.12102489 [DOI] [PMC free article] [PubMed] [Google Scholar]
- 15. Swensen SJ, Viggiano RW, Midthun DE, Müller NL, Sherrick A, Yamashita K, et al. Lung nodule enhancement at CT: multicenter study. Radiology. 2000;214(1):73–80. 10.1148/radiology.214.1.r00ja1473 [DOI] [PubMed] [Google Scholar]
- 16. Aberle DR, Adams AM, Berg CD, Black WC, Clapp JD, Fagerstrom RM, et al. Reduced lung‐cancer mortality with low‐dose computed tomographic screening. N Engl J Med. 2011;365(5):395–409. 10.1056/NEJMoa1102873 [DOI] [PMC free article] [PubMed] [Google Scholar]
- 17. Schabath MB, Cote ML. Cancer Progress and priorities: lung cancer. Cancer Epidemiol Biomarkers Prev. 2019;28(10):1563–79. 10.1158/1055-9965.Epi-19-0221 [DOI] [PMC free article] [PubMed] [Google Scholar]
- 18. Zhou F, Zhou C. Lung cancer in never smokers‐the east Asian experience. Transl Lung Cancer Res. 2018;7(4):450–63. 10.21037/tlcr.2018.05.14 [DOI] [PMC free article] [PubMed] [Google Scholar]
- 19. Jones GS, Baldwin DR. Recent advances in the management of lung cancer. Clin Med (Lond). 2018;18(Suppl 2):s41–6. 10.7861/clinmedicine.18-2-s41 [DOI] [PMC free article] [PubMed] [Google Scholar]
- 20. Yanagawa M, Tsubamoto M, Satoh Y, Hata A, Miyata T, Yoshida Y, et al. Lung adenocarcinoma at CT with 0.25‐mm section thickness and a 2048 matrix: high‐spatial‐resolution imaging for predicting invasiveness. Radiology. 2020;297(2):462–71. 10.1148/radiol.2020201911 [DOI] [PubMed] [Google Scholar]
- 21. Liu LH, Liu M, Wei R, Jin EH, Liu YH, Xu L, et al. CT findings of persistent pure ground glass opacity: can we predict the invasiveness? Asian Pac J Cancer Prev. 2015;16(5):1925–8. 10.7314/apjcp.2015.16.5.1925 [DOI] [PubMed] [Google Scholar]
- 22. Zhang Y, Qiang JW, Ye JD, Ye XD, Zhang J. High resolution CT in differentiating minimally invasive component in early lung adenocarcinoma. Lung Cancer (Amsterdam, Netherlands). 2014;84(3):236–41. 10.1016/j.lungcan.2014.02.008 [DOI] [PubMed] [Google Scholar]
- 23. Wu F, Tian SP, Jin X, Jing R, Yang YQ, Jin M, et al. CT and histopathologic characteristics of lung adenocarcinoma with pure ground‐glass nodules 10 mm or less in diameter. Eur Radiol. 2017;27(10):4037–43. 10.1007/s00330-017-4829-5 [DOI] [PubMed] [Google Scholar]
- 24. Zhang P, Li T, Tao X, Jin X, Zhao S. HRCT features between lepidic‐predominant type and other pathological subtypes in early‐stage invasive pulmonary adenocarcinoma appearing as a ground‐glass nodule. BMC Cancer. 2021;21(1):1124. 10.1186/s12885-021-08821-5 [DOI] [PMC free article] [PubMed] [Google Scholar]
- 25. Zhang Y, Shen Y, Qiang JW, Ye JD, Zhang J, Zhao RY. HRCT features distinguishing pre‐invasive from invasive pulmonary adenocarcinomas appearing as ground‐glass nodules. Eur Radiol. 2016;26(9):2921–8. 10.1007/s00330-015-4131-3 [DOI] [PubMed] [Google Scholar]
- 26. Mao H, Labh K, Han F, Jiang S, Yang Y, Sun X. Diagnosis of the invasiveness of lung adenocarcinoma manifesting as ground glass opacities on high‐resolution computed tomography. Thorac Cancer. 2016;7(1):129–35. 10.1111/1759-7714.12269 [DOI] [PMC free article] [PubMed] [Google Scholar]
- 27. Huang C, Wang C, Wang Y, Liu J, Bie F, Wang Y, et al. The prognostic significance of pure ground glass opacities in lung cancer computed tomographic images. J Cancer. 2019;10(27):6888–95. 10.7150/jca.33132 [DOI] [PMC free article] [PubMed] [Google Scholar]
- 28. Harzheim D, Eberhardt R, Hoffmann H, Herth FJF. The solitary pulmonary nodule. Respiration. 2015;90(2):160–72. 10.1159/000430996 [DOI] [PubMed] [Google Scholar]
- 29. Xu DM, van Klaveren RJ, de Bock GH, Leusveld A, Zhao Y, Wang Y, et al. Limited value of shape, margin and CT density in the discrimination between benign and malignant screen detected solid pulmonary nodules of the NELSON trial. Eur J Radiol. 2008;68(2):347–52. 10.1016/j.ejrad.2007.08.027 [DOI] [PubMed] [Google Scholar]
- 30. Nemesure B, Clouston S, Albano D, Kuperberg S, Bilfinger TV. Will that pulmonary nodule become cancerous? A risk prediction model for incident lung cancer. Cancer Prev Res (Phila). 2019;12(7):463–70. 10.1158/1940-6207.Capr-18-0500 [DOI] [PubMed] [Google Scholar]
- 31. Saltos A, Shafique M, Chiappori A. Update on the biology, management, and treatment of small cell lung cancer (SCLC). Front Oncol. 2020;10:1074. 10.3389/fonc.2020.01074 [DOI] [PMC free article] [PubMed] [Google Scholar]
- 32. Saito H, Yamada K, Hamanaka N, Oshita F, Ito H, Nakayama H, et al. Initial findings and progression of lung adenocarcinoma on serial computed tomography scans. J Comput Assist Tomogr. 2009;33(1):42–8. 10.1097/RCT.0b013e3181633509 [DOI] [PubMed] [Google Scholar]
- 33. Prisadov GT, Uchikov AP, Welker K, Wallimann H, Murdzhev KA, Uzunova VN. Size of tumour as a risk factor for malignancy in patients with peripheral pulmonary nodules. Folia Med. 2012;54(2):17–21. 10.2478/v10153-011-0083-9 [DOI] [PubMed] [Google Scholar]
- 34. Henschke CI, Yankelevitz DF, Naidich DP, McCauley DI, McGuinness G, Libby DM, et al. CT screening for lung cancer: suspiciousness of nodules according to size on baseline scans. Radiology. 2004;231(1):164–8. 10.1148/radiol.2311030634 [DOI] [PubMed] [Google Scholar]
- 35. Swensen SJ, Brown LR, Colby TV, Weaver AL, Midthun DE. Lung nodule enhancement at CT: prospective findings. Radiology. 1996;201(2):447–55. 10.1148/radiology.201.2.8888239 [DOI] [PubMed] [Google Scholar]
- 36. McWilliams A, Tammemagi MC, Mayo JR, Roberts H, Liu G, Soghrati K, et al. Probability of cancer in pulmonary nodules detected on first screening CT. N Engl J Med. 2013;369(10):910–9. 10.1056/NEJMoa1214726 [DOI] [PMC free article] [PubMed] [Google Scholar]
- 37. Wood DE, Kazerooni EA, Baum SL, Eapen GA, Ettinger DS, Hou L, et al. Lung cancer screening, version 3.2018, NCCN clinical practice guidelines in oncology. J Natl Compr Canc Netw. 2018;16(4):412–41. 10.6004/jnccn.2018.0020 [DOI] [PMC free article] [PubMed] [Google Scholar]
Associated Data
This section collects any data citations, data availability statements, or supplementary materials included in this article.
Supplementary Materials
Supplemental Table S1 Different distributions of five morphological types in different type of pathological.
Supplemental Table S2: Different distributions of five morphological types in different subtypes of invasive adenocarcinoma.
Supplemental Table S3: Different distributions of five morphological types in lung adenocarcinoma and premalignant lesions.