

Abstract
Since its conceptualization, there has been a lack of consensus on the best way to operationalize allostatic load (AL). As a marker of the cumulative, physiological wear and tear on the body resulting from chronic exposure to stressors, it follows that AL should be higher among people who have faced more stressful life experiences. Thus, the purpose of this study was to construct AL scores using different operationalizations and, as a measure of construct validity, compare whether each construction produced expected disparities in AL by race and a composite socioeconomic status (SES) variable which accounts for measures over the life course; we also explored differences by sex. We conducted the study in a sample of 45–52-year-old offspring from the Child Health and Development Studies, a longitudinal birth cohort established in the early 1960s. AL scores were constructed in 6 different ways and included 10 biomarkers from inflammatory, neuroendocrine, cardiovascular, and metabolic systems. Our main approach to constructing AL was to sum across high-risk biomarker quartiles, correct for medication use, and use sex-specific high-risk quartiles for specific biomarkers. Alternative constructions did not use sex-specific quartiles and/or weighted biomarkers within subsystems and/or did not correct for medication use. We estimated differences in AL scores by race, SES, sex and their pairwise interactions. All constructions of AL, including the main approach, produced expected disparities by race (higher scores for Black vs. non-Black participants) and life course SES (higher scores for low vs. high SES participants). However, disparities by sex only emerged when the AL score was constructed via approaches that did not use sex-specific high-risk quartiles; for these alternative constructions, overall, female participants had higher AL scores than male participants and Black female participants had the highest AL scores in the sample. For most constructions, the pairwise interaction between sex and SES, showed a stronger disparity in AL scores between low and high-SES female compared with low- and high-SES male participants; this suggests that high life course SES may be more important for female (in terms of lowering AL) than male participants. In conclusion, our results suggest that the basic AL concept is consistently expressed in different operationalizations, making it an especially useful and robust tool for understanding disparities by race and SES.
Keywords: Allostatic load, patterns, disparities, life course
1. Introduction
Allostatic load (AL) is a concept that specifies a mechanism through which social stressors become embedded within a person to influence health over the life course (Carlson and Chamberlain, 2005). According to AL theory, an individual’s response to encounters with stressors is characterized by the release of hormones from various physiological systems (e.g., the hypothalamic-pituitary-adrenal (HPA) axis), which may go on to influence the regulation of, for example, inflammatory, metabolic, and cardiovascular activity (McEwen and Seeman, 1999). This stress response has the capacity to be health protective and/or damaging depending on the chronicity to which it is activated. In the short term, acute activation of this hormonally mediated stress response can be protective for health and aid in survival by allowing an individual to meet the demands of environmental challenges (McEwen and Seeman, 1999). However, chronic exposure to stressors may require an individual to respond by making alterations to their internal environment (i.e., changing the set points of physiological systems) in order to meet the challenges of their external environment and maintain equilibrium, or homeostasis (McEwen, 1998); this process is known as allostasis (Sterling and Eyer, 1988). Over time this chronic fluctuation or operation within an allostatic state results in wear and tear to the body known as AL.
Originally, AL was operationalized as a composite of 10 biomarkers from the cardiovascular, metabolic, and sympathetic nervous systems, and the HPA-axis, which were dichotomized at the high-risk sample-specific quartile; participants were assigned a score of 1 for each biomarker if they were in the high-risk category, and scores were summed to create a measure of AL (Seeman et al., 1997). This method of measuring AL is most common in the literature (Rodriquez et al., 2019), although different biomarkers from the original 10 are sometimes used, with disagreement over which biomarkers or physiological systems should be included in the measure. Further, there is no consensus on the most appropriate way to construct AL scores from biomarkers, with alternative scoring procedures proposed, such as using clinically relevant cut points for biomarkers (vs sample based cut points), sex-specific cut points, multiple cut points (for biomarkers such as blood pressure where high and low values may represent dysfunction), or methods based on continuous standardized scores (Beckie, 2012; Juster et al., 2010; Szanton et al., 2005). More recently, it has been suggested that the definition of AL include both biomarker and ‘clinical’ variables, such as a self-assessment of psychological distress. While we acknowledge this, we note that only a few studies have defined AL in this manner (Fava et al., 2019; Guidi et al., 2021).
As a marker of the cumulative, physiological wear and tear on the body resulting from chronic exposure to stressors, it follows that AL should be higher among people who have faced more lifetime adversities and/or stressful life experiences (Clark et al., 2007). For example, Black Americans, who experience racialized stressors resulting from living in a society embedded with structural racism, are expected to have higher AL scores compared with white Americans (Goosby et al., 2018). Similarly, exposure to multiple stressors associated with chronic poverty implies that AL scores should be higher among individuals of low compared with high socioeconomic status (SES) (Johnson et al., 2017). Further, the AL scores of individuals occupying more than one disadvantaged social status category may be even higher than those for any one category alone; for example, Black women, who can experience both race- and sex-based discrimination, may have even higher scores than individuals occupying just one of these categories (Geronimus, 2013; Geronimus et al., 2006; Rodriguez et al., 2019).
In the AL disparities literature, evidence showing disparities by race and SES are consistent and well-documented (Beckie, 2012; Carlson and Chamberlain, 2005; Chyu and Upchurch, 2011; Geronimus et al., 2006; Howard and Sparks, 2016; Johnson et al., 2017; Szanton et al., 2005). In contrast, where prior studies have examined sex-differences (all using binary sex), they often show that male participants have the same or higher scores than female participants; similarly, where gender-differences have been examined (all using the gender binary), men often have higher AL scores than women (Christensen et al., 2018; Gustafsson et al., 2011; Kinnunen et al., 2005; Mair et al., 2011; Robertson and Watts, 2015; Salazar et al., 2016; Santos-Lozada and Daw, 2018; Seeman et al., 2002). Both results are inconsistent with a disparities hypothesis that individuals exposed to stressors resulting from sex-based discrimination should have higher AL. However, some studies have shown that sex-differences may be driven by male participants scoring higher on metabolic and cardiovascular biomarkers whereas female participants score higher on neuroendocrine, immune, or inflammatory biomarkers (Beckie, 2012; Buckwalter et al., 2016; Kinnunen et al., 2005; Mair et al., 2011; Santos-Lozada and Daw, 2018; Seeman et al., 2002); this latter group, which encompasses “primary mediators” (McEwen, 2005), is arguably closer to the construct of AL than the former. Further, as described above, observing disparities by sex and/or gender might be complicated by the way that these factors interact with each other (Juster et al., 2019) as well as other social status categories like race and SES (Geronimus et al., 2006; Mair et al., 2011).
To help reconcile inconsistencies in the operationalization of AL in the literature, we compare different methods of constructing AL indices in a unique sample designed to optimize the examination of health disparities in mid-life, the Child Health and Development Studies Disparities Study (Link et al., 2017). Specifically, we first compare summing high-risk biomarker quartiles using a simple summary approach vs. weighting within subsystems prior to summation. These are two of the most commonly utilized overarching approaches to summing high risk biomarker quartiles in the AL literature. Then, for each operationalization, we constructed a version of the AL score that corrected vs. did not correct for medication use and that used vs. did not use age- and/or sex-specific high-risk quartiles for biomarkers with age- and/or sex-specific reference values. Additionally, for all approaches, we examined if findings were sensitive to implausibly high biomarker values and missing biomarker data. Finally, for each version of the AL score, as a gauge of construct validity, we report AL patterning by sociodemographic variables expected to be related to AL, including race and a composite SES variable which accounts for measures over the life course (expecting to observe higher AL scores for Black participants and participants of lower life course SES). We also explore AL patterns by sex and within each pairwise grouping of race, SES and sex.
2. Material and Methods
2.1. Sample
Participants are the adult offspring of mother-infant dyads who participated in the Child Health and Development Studies (CHDS, www.chdstudies.org), a prospective birth cohort that recruited virtually all pregnant women receiving prenatal care in Kaiser Permanente Medical Care Plan clinics in Alameda County, California from 1959 to 1967 (van den Berg et al., 1988). The overall cohort includes data on 20,754 pregnancies and 19,044 live births, 89.4% of which remained under observation at age 5. Subsets of this cohort participated in follow-up assessments at age 5 years (5-year-old Exam), ages 9–11 years (9–11-year-old Exam), and ages 15–17 years (The Adolescent Study) (van den Berg et al., 1988).
This analysis used data collected as part of the CHDS Disparities Study (CHDS-DS) which includes 605 adult participants (252 Black and 353 non-Black), followed in mid-life (age 43–52 years), who completed a telephone interview between 2010 and 2013. To be eligible for the CHDS-DS participants had to be offspring of CHDS mothers who participated in a childhood follow-up study and who were not deceased, were not known to have moved out of California, and were not known to be ineligible for other reasons (e.g., current incarceration). Interview participation represents a 61% response to the 985 eligible individuals who were able to be located and recruited by phone (Link et al., 2017). Of the 605 individuals who participated in the telephone interview, 510 (84%) completed a home visit. Among these 510 participants, 433 (85%) agreed to a blood draw. Due to blood draw failures in 33 participants, the final analytic sample size for this study is 400. This study was approved by the Public Health Institute and Columbia University Medical Center Institutional Review Boards.
To examine potential differences by race, sex, or life course SES between participants who did and did not provide blood samples, we compared, where available, demographic and home visit anthropometry and blood pressure measures for the 400 in our analytic sample to the 110 who completed a home visit but did not provide a blood sample.
2.2. Measures
2.2.1. Home visit components
The CHDS-DS home visit included measurement of height, weight, waist circumference (WC), percent body fat (%BF) and blood pressure (BP), collection of information on medication use, and a blood draw. A licensed phlebotomist attended each home visit, and home visit personnel were trained in all study measurements to ensure reliability.
2.2.1.1. Anthropometry
Participant height (cm) was measured using a seca 217 stadiometer (seca GmbH & Co. KG., Hamburg, Germany), while weight (kg) and %BF were measured using a TANITA BF-350 Body Composition Analyzer (TANITA Corporation, Tokyo, Japan). A FitnessMart Gulick II Tape Measure (Model 67020, Country Technology, Inc., Wisconsin, USA) was used to obtain WC (cm). Each measure was taken twice and the average of the two measures was used for analysis.
2.2.1.2. Blood pressure
Systolic BP (SBP) and diastolic BP (DBP) measurements were obtained three times using automated monitors (CareScape V100 Vital Signs Monitor, GE Healthcare, Wisconsin, USA) and the average of the last two measurements were used to calculate mean BP values.
2.2.1.3. Medication use
At the home visit, examiners completed a medication inventory form by documenting the name, dose, and frequency of every medication (prescription and non-prescription, such as supplements) a participant was taking, with information obtained from medication bottles provided by the participant.
2.2.1.4. Serology
In total, 20 mL of serum and 40 mL of whole blood were collected, processed within two hours, and shipped on dry ice for storage in the laboratory of Dr. Regina Santella at Columbia University’s Center for Environmental Health in Northern Manhattan. Serum samples were then shipped to the Clinical & Epidemiologic Research Laboratory at the Boston Children’s Hospital for analysis of hemoglobin A1C (HbA1c), total cholesterol, high density lipoprotein (HDL) cholesterol, dehydroepiandrosterone sulfate (DHEAS), interleukin-6 (IL-6), and C-reactive protein (CRP). Samples were batched in a random order for analysis.
Total cholesterol was measured using standard methods (Allain et al., 1974). At cholesterol concentrations of 132.8 and 280.4 mg/dL, the day-to-day reproducibility, reflected by the coefficient of variation (CV), was 1.7% and 1.6%, respectively. HDL cholesterol concentrations were determined using a direct enzymatic colorimetric assay (Sugiuchi et al., 1995). This assay has been shown to meet the rigid requirements established by the Lipid Standardization Program (Rifai et al., 1998). At HDL concentrations of 27.0 and 54.9 mg/dL, the day-to-day reproducibility was 3.3% and 1.7%, respectively.
CRP concentrations were determined using an immunoturbidimetric assay on the Roche P Modular system (Roche Diagnostics – Indianapolis, IN), using reagents and calibrators from Roche. This high-sensitivity assay has a limit of detection of 0.03 mg/L. The day-to-day variabilities of the assay at concentrations of 0.91, 1.60 and 18.40 mg/L were 3.8%, 3.3% and 1.9%, respectively.
DHEAS was measured by a competitive electrochemiluminescence immunoassay on the Roche E Modular system (Roche Diagnostics, Indianapolis, IN). The lowest detection limit of this assay is 0.1 μg/dL and the run-to-run imprecision values at DHEAS concentrations of 117, 395 and 984 μg/dL were 2.8%, 2.4% and 1.7%, respectively.
Determination of the %HbA1c in total Hemoglobin was based on turbidimetric immunoinhibition using hemolyzed whole blood or packed red cells (Roche Diagnostics, Indianapolis, IN). The assay is certified by the National Glycohemoglobin Standardization Program for no interference by Hb C trait, Hb S trait, Hb E trait, elevated HbF, or Carbamyl-Hb. HbA1c measurements of blood from long-term storage are highly correlated to measurements from blood obtained before storage (Selvin et al., 2005). The day-to-day variability at %HbA1c values of 5.5 and 9.1 are 1.9% and 3.0%, respectively.
IL-6 was measured by an ultra-sensitive ELISA assay from R & D Systems, Minneapolis, MN. The minimum required volume for this assay is 200 μL. The assay has a sensitivity of 0.094 pg/mL, and the day-to-day variabilities of the assay at concentrations of 0.49, 2.78 and 5.65 pg/mL were 9.6%, 7.2% and 6.5%, respectively.
2.2.2. Covariates
Demographic variables included participants’ race (non-Hispanic Black and non-Black), sex (male and female), and ‘cumulative life course SES’ (hereafter, ‘life course SES’). Participants self-identified their race and sex. Few participants self-identified as Asian or Asian American (N=15), Hispanic or Latino (N=11), American Indian (N=2), mixed race (N=5), or another race (N=1); thus, these individuals were combined with non-Hispanic white participants (n=226) into one category labelled “non-Black”. We also examined using just “non-Hispanic white” as the comparison group. For participants’ sex, the following question was asked: “It says here that you are [male/female], is this correct?”; no additional information about gender identity was collected in the study. Because of this, we specifically refer to participants’ “sex” and “sex-differences” in our study, to avoid conflating participants’ sex with their gender and assuming only two genders.
Life course SES was a composite variable, with data collected at four time points: parental SES at participant’s birth, in childhood (age 9–11), and in adolescence (age 15–17), and participant SES at age 50. Each parental SES measure is a composite of parental household income, maternal education, and paternal occupational standing, extensively described in Link et al. (Link et al., 2017). In brief, at each time point each component of the parental SES variable was standardized and/or re-scaled as needed to range from 0 to 3. Components were then averaged for a final continuous SES variable that ranged from 0 to 3. Participant SES in adulthood was created in similar manner, as a composite of participant educational attainment, occupational standing, and household income at age 50 (see Supplement), where components were likewise standardized and/or re-scaled as necessary to range from 0 to 3 and then averaged. Life course SES was created by summing the four composite SES variables (possible range: 0 to 12), and then, for analyses, it was dichotomized into “low” vs. “high” SES at the midpoint value of the range (≤6: low-SES and >6: high-SES).
2.3. AL score creation
2.3.1. Biomarkers included in AL scores
The AL score included 10 biomarkers from 4 physiological subsystems: metabolic (%BF, WC, HDL cholesterol, the ratio of total to HDL cholesterol (tchol/HDL) and HbA1c); inflammation (CRP and IL-6); cardiovascular: (SBP and DBP); neuroendocrine (DHEAS).
2.3.2. Primary operationalization of AL
Our primary method of constructing AL utilized the simple summary method of Seeman et al., (Seeman et al., 1997) corrected for medication use, and with age (<50 vs. ≥50) and sex-specific high-risk quartiles for DHEAS and sex-specific high-risk quartiles for WC and %BF (Table 1, version i).
Table 1.
Description of each method of AL construction
| Version # | Approach | Description | Main or alternative method |
|---|---|---|---|
| i | Simple summation | Scoring algorithm sums across the high-risk biomarker quartiles (which are age- and sex-specific for DHEAS and sex-specific for percent body fat and waist circumference). The score additionally corrects for use of medications to control blood sugar, cholesterol, or blood pressure. | Primary method of construction (main text results) |
| ii | Simple summation | Simple summation scoring algorithm from (i) except: - No correction for medication use |
Alternative method |
| iii | Simple summation | Simple summation scoring algorithm from (i) except: - Without making any biomarker quartiles age- and/or sex-specific |
Alternative method |
| iv | MIDUS approach | Scoring algorithm averages the high-risk biomarker quartiles (which are age- and sex-specific for DHEAS and sex-specific for percent body fat and waist circumference) within subsystems before summing across subsystems scores. The score additionally corrects for use of medications to control blood sugar, cholesterol, or blood pressure. | Alternative method |
| v | MIDUS approach | Simple summation scoring algorithm from (iv) except: - No correction for medication use |
Alternative method |
| vi | MIDUS approach | MIDUS scoring algorithm from (iv) except: - Without making any biomarker quartiles age- and/or sex-specific |
Alternative method |
Here, each biomarker was dichotomized based on the sample high-risk quartile (the lowest quartile for HDL and DHEAS and the highest quartile for all other biomarkers). Participants in the high-risk quartile scored a 1 for the AL component (vs. 0 otherwise). Based on the medications participants were taking, we created categories for medications used to control blood pressure (e.g., ACE inhibitors), cholesterol (e.g., statins) and diabetes (e.g., insulin and oral medications) (Prescribers’ Digital Reference, 2016). For components where a participant did not exceed the biomarker high-risk quartile, but was taking medications, scores were recoded to 1 to capture underlying subsystem dysregulation masked/controlled via medical intervention (91, 40, and 19 participants’ scores were recoded for SBP, HDL, and HbA1c, respectively). One participant exceeded the limits of the measurement tools and was placed in the high-risk quartile for %BF and WC. Scores for all components were summed and could range from 0 to 10. For descriptive tables only, we created a “high” AL variable just for our primary method of construction; “high” AL was considered to be a total AL score in the top 25th percent of the sample distribution and a cut-point of ≥5 (20%) got us closest to this definition.
2.3.3. Alternative AL operationalizations
We first created two alternative versions of our primary AL measure that utilized the simple summary method. In the first, we did not perform medication correction (Table 1, version ii), as some have argued it is unfair to categorize individuals who have normal levels of a given biomarker, even if due to pharmacological intervention, as being “high risk” (Rodriguez et al., 2019). In the second, we performed medication correction but did not use age- and/or sex-specific high-risk quartiles for DHEAS, WC, or %BF prior to summation (Table 1, version iii).
Second, we constructed AL using the scoring algorithm utilized by studies in the Midlife in the United States (MIDUS) cohort (Table 1, version iv) (Wiley et al., 2016). With the “MIDUS approach” of constructing AL, each subsystem is weighted equally rather than each biomarker (Gruenewald et al., 2012). As before, each biomarker was dichotomized based on the sample high-risk quartile, and participants in the high-risk quartile scored a 1 for the AL component (vs. 0 otherwise). However, here, subsystem scores were first created by taking the mean of all components within a particular subsystem (each subsystem ranged from 0–1). The AL score was then created by summing scores across subsystems (range: 0–4). As above, two alternative versions of this score were created. In the first, medication correction was not performed (Table 1, version v). In the other, no high-risk quartiles were age- and/or sex-specific, for consistency with the literature in which this approach is common (Table 1, version vi).
2.3.4. Treatment of missing or outlying biomarkers in AL score creation
To be included in this analysis, a participant could either i) have available data for either >50% of biomarkers for a subsystem or ii) be missing only one subsystem (Robinette et al., 2016). Nine participants were missing data on at least one of the following biomarkers: HbA1c (Nmissing=6), BP (Nmissing=1), WC (Nmissing=1), and %BF (Nmissing=3); however, no participant exceeded the a priori established missing data limits above.
We additionally examined biomarker values for participants at or above the 90th percentile of the sample distribution to identify potential outliers or implausible values. First, we compared these values with clinical high-risk standards for each biomarker. For all subsystems except inflammatory markers, biomarker values were considered plausible and participants remained in the high-risk quartile for that biomarker. For inflammatory markers we took additional steps to examine outlying values, as CRP (90th percentile cut-point: 7.32) and IL-6 (90th percentile cut-point: 3.86) can register as high for factors unrelated to AL (Landry et al., 2017). For CRP and IL-6 we additionally examined biomarker values against the medications the participant was taking. We identified 16 participants with values of CRP and IL-6 greater than the 90th percentile and whose medication listing suggested treatment for an indication that may result in high CRP for reasons other than AL (e.g., active infection, rheumatoid arthritis). Of these 16 participants, 4 were CRP outliers, 8 were IL-6 outliers, and 4 had outlying values for both. In primary analyses, these participants remained in the high-risk quartile (value of 1). However, we performed two sensitivity analyses to examine the potential for these outliers to influence our findings. First, we removed the 16 participants with outlying biomarker values. Second, instead of removing, we recoded these participants from the high-risk quartile to a value of 0 (low-risk quartile).
2.4. Statistical analysis
We first examined the distribution of each biomarker and the primary AL measure in the total sample, comparing each biomarker’s high-risk quartile cut-points to standard reference values where they existed. In descriptive analyses, we reported both the mean AL and the proportion of individuals with high AL in the total DISPAR sample and within strata of race, life course SES, and sex, and each pairwise strata.
Treating the primary AL score as a count variable, we next used negative binomial regression to obtain measures of uncertainty (i.e., 95% confidence intervals) for the observed AL patterns in our sample by race, life course SES, sex and their pairwise interactions. Exponentiating the betas from these models gives predicted AL scores for different subgroups given the combination of relevant parameters. We then repeated regression analyses using the alternative AL measures (using linear regression instead when AL scores were constructed using the MIDUS approach) to examine the robustness of our findings to the method of score construction. Finally, we repeated analyses using non-Hispanic white rather than non-Black as the comparison group as a sensitivity analysis. All analyses were performed using R version 4.0.5 (R Core Team, 2013).
3. Results
3.1. Sample descriptives
The distributions of race, life course SES, and sex were similar between the participants who completed the initial telephone interview (N=605) and the subset who went on to complete the home visit (N=510). However, the serology sample (N=400) had a lower proportion of Black participants, a slightly lower proportion of female participants, and a slightly higher proportion of high-SES participants (Supplemental Tables S1a–b). Where physical measures were available for comparison, participants in the serology sample were “healthier” on average than those not in the sample (e.g., lower BMI, SBP, %BF). When these comparisons were repeated within subgroups of participants who either “refused” the blood draw (Supplemental Table S1c) or could not complete the blood draw for “technical reasons” (Supplemental Table S1d), differences, particularly for physical measures, were especially pronounced in the “technical issue” group, and Black female participants were more likely to be in the “technical issue” group (Supplemental Table S1e–f).
The 400 serology participants were 35% Black, 48% female, and 56.5% low-SES. For the primary AL measure (version i), the average score in the sample was 2.65 and ranged from 0 to 9 (Table 2). The sample high-risk cut points were more conservative (i.e., “worse”) than the high-risk cut-point for the clinical standards for all biomarkers except SBP, DBP, and A1C.
Table 2.
Distribution of individual biomarkers and total allostatic load score in the total DISPAR sample.
| N | Mean | SD | Min | 25 % | 50 % | 75 % | Max | High-risk standard | Reference | |
|---|---|---|---|---|---|---|---|---|---|---|
|
| ||||||||||
| Inflammatory markers | ||||||||||
| C-reactive protein (mg/L) | 400 | 3.56 | 7.20 | 0.07 | 0.64 | 1.56 | 3.88 | 84.5 | >3.0 | (Roberts, 2004) |
| Interleukin-6 (pg/mL) | 400 | 1.86 | 2.12 | 0.27 | 0.68 | 1.19 | 2.06 | 20.7 | - | no standard |
| Neuroendocrine (HPA-axis) marker | ||||||||||
| DHEA-S (μg/dL) | 400 | 158 | 87.0 | 5.93 | 92.1 | 142 | 206 | 503 | ||
| DHEA-S (male, <50) | 151 | 197 | 95.1 | 19.6 | 133 | 179 | 246 | 503 | 95-530 | (MedlinePlus.) |
| DHEA-S (male, ≥50) | 59 | 177 | 79.3 | 53.7 | 113 | 169 | 241 | 421 | 70-310 | |
| DHEA-S (female, <50) | 126 | 126 | 66.2 | 6.51 | 73.0 | 115 | 175 | 377 | 32-240 | |
| DHEA-S (female, ≥50) | 66 | 112 | 61.0 | 5.93 | 67.2 | 94.7 | 151 | 236 | 26-200 | |
| Cardiovascular markers | ||||||||||
| Systolic blood pressure (mmHg) | 399 | 124 | 15.9 | 84.0 | 114 | 123 | 133 | 213 | ≥140 | (Carretero and Oparil, 2000 |
| Diastolic blood pressure (mmHg) | 399 | 74.3 | 10.4 | 50.5 | 67 | 74 | 82 | 109 | ≥90 | |
| Metabolic markers | ||||||||||
| High-density lipoprotein (mg/dL) | 400 | 57.7 | 17.8 | 16.2 | 45.4 | 55.6 | 67.1 | 144 | <40 | (NIH Medline Plus, 2012) |
| Total:HDL cholesterol ratio | 400 | 3.75 | 1.26 | 1.32 | 2.83 | 3.54 | 4.41 | 9.27 | ≥3.5:1 | (American Heart Association, 2017) |
| Glycosylated hemoglobin (%) | 394 | 5.86 | 1.10 | 4.42 | 5.39 | 5.68 | 5.98 | 14 | >6.4 | (Weykamp, 2013) |
| Percent body fat (%) | 396 | 33% | 10% | 8% | 25% | 32% | 41% | 70% | ||
| Percent body fat (male) | 207 | 28% | 9% | 10% | 22% | 27% | 32% | 70% | >25% | (Shah and Braverman, 2012) |
| Percent body fat (female) | 189 | 39% | 9% | 8% | 33% | 40% | 45% | 54% | >30% | |
| Waist circumference (cm) | 398 | 96.9 | 16.2 | 31.2 | 87.1 | 96.3 | 106 | 162 | ||
| Waist circumference (male) | 208 | 98.9 | 15.2 | 31.2 | 90.1 | 97.3 | 107 | 162 | >102 | (North American Association for the Study of Obesity, 2000) |
| Waist circumference (female) | 190 | 94.7 | 16.9 | 43.1 | 82.7 | 93.8 | 105 | 143 | >88 | |
| Allostatic load score 1 | 400 | 2.65 | 2.15 | 0 | 1 | 2 | 4 | 9 | ||
Primary method of construction (version i): simple sum of components, corrected for medication use, with age- and/or sex-specific high-risk quartiles for DHEAS, %BF, and WC
3.2. Results for primary AL measure
Table 3 shows that, for the primary AL measure (version i), consistent with expectations, Black participants had higher mean AL scores than non-Black participants (3.42 vs. 2.24) and low-SES participants had higher scores than high-SES participants (3.05 vs. 2.12). In the total sample, male participants had slightly higher scores than female participants (2.87 vs. 2.42). The racial disparity in the total sample was also observed within strata of sex (3.45 vs. 2.52 for Black and non-Black male participants, respectively; 3.39 vs. 1.95 for Black and non-Black female participants, respectively) and life course SES, albeit the disparity was quite a bit larger for low- (3.88 vs. 2.52 for Black vs. non-Black participants, respectively) vs. high-SES participants (2.58 vs. 2.52 for Black vs. non-Black participants, respectively). Further, for both Black and non-Black participants, male participants had higher AL scores than female participants, but only slightly, and this difference was greater for non-Black participants (2.52 vs. 1.95 for male and female participants, respectively) than Black participants (3.45 vs. 3.39 for male and female participants, respectively). Finally, the difference in AL scores for male and female participants was much greater within strata of high-SES (2.54 vs. 1.63 for male vs. female participants, respectively) compared with low-SES (3.13 vs. 2.97 for male and female participants, respectively). While this table enables comparisons within strata of race, life course SES, and sex, we refrain from analyzing their three-way interaction given the limited sample size within some strata.
Table 3.
Distribution of allostatic load score1 in the total DISPAR sample, by race, by sex, by SES, and by joint strata of these factors.
| Total Sample | Male | Female | |||||||
|---|---|---|---|---|---|---|---|---|---|
|
| |||||||||
| N | Mean (sd) | % AL ≥52 | N | Mean (sd) | % AL ≥4 | N | Mean (sd) | % AL ≥52 | |
|
| |||||||||
| Total Sample | |||||||||
| Total | 400 | 2.65 (2.15) | 20% | 210 | 2.87 (2.05) | 20% | 190 | 2.42 (2.24) | 19% |
| Black | 140 | 3.42 (2.26) | 35% | 78 | 3.45 (2.08) | 32% | 62 | 3.39 (2.49) | 39% |
| Non-Black | 260 | 2.24 (1.98) | 12% | 132 | 2.52 (1.97) | 14% | 128 | 1.95 (1.95) | 10% |
| Life course SES = low (≤6) 3 | |||||||||
| Total | 228 | 3.05 (2.28) | 28% | 117 | 3.13 (2.26) | 28% | 111 | 2.97 (2.30) | 28% |
| Black | 105 | 3.71 (2.33) | 42% | 52 | 3.88 (2.16) | 42% | 53 | 3.55 (2.49) | 42% |
| Non-Black | 123 | 2.49 (2.08) | 16% | 65 | 2.52 (2.17) | 17% | 58 | 2.45 (1.99) | 16% |
| Life course SES = high (<6) 3 | |||||||||
| Total | 172 | 2.12 (1.85) | 9% | 93 | 2.54 (1.72) | 11% | 79 | 1.63 (1.90) | 8% |
| Black | 35 | 2.54 (1.80) | 14% | 26 | 2.58 (1.63) | 12% | 9 | 2.44 (2.35) | 22% |
| Non-Black | 137 | 2.01 (1.85) | 8% | 67 | 2.52 (1.76) | 10% | 70 | 1.53 (1.82) | 6% |
AL score is a simple sum of components, corrected for medication use, with age- and/or sex-specific high-risk quartiles for DHEAS, %BF, and WC.
AL scores at or above 5 were considered “high” AL because this cut-point provided the closest approximation of the top 25th percentile of the sample distribution of AL, our definition of “high” AL.
SES was a composite variable composed of three SES domains (income, education, occupational status) measured at multiple time points over the life course. The summary SES measure was dichotomized at a value of 6 which was the mid-point of its possible range (0–12).
Findings from regression models were consistent with those from descriptive analyses, and further show that the observed differences in AL by race, life course SES, and sex were all statistically significant (Table 4a, Models 1–3). However, the only pairwise interaction to reach statistical significance was between sex and SES (p=0.023; Table 4a, Model 6). This interaction (illustrated in Figure 1, plot C), shows the difference in AL for low and high-SES female participants to be much greater than between low and high-SES male participants, and suggests that, for lowering AL, high SES may be more important for female than male participants.
Table 4a. Regression models examining the patterning of race, SES, and sex and their pairwise interactions with allostatic load scores in the total sample, using either the simple summary scoring algorithm (versions i and iii) or the MIDUS approach (versions iv and vi).1.
Results from negative binomial regression models where AL was created using primary method of construction (version i)1
| AL score (version i)2 | Independent associations | Pairwise interactions | ||||
|---|---|---|---|---|---|---|
|
| ||||||
| Model 1 | Model 2 | Model 3 | Model 4 | Model 5 | Model 6 | |
| Intercept 3 | 0.81 (0.70, 0.91) | 1.05 (0.94, 1.16) | 0.75 (0.62, 0.88) | 0.93 (0.78, 1.06) | 0.70 (0.55, 0.85) | 0.93 (0.76, 1.10) |
| non-Black | male | high SES | non-Black male | non-Black and high SES | male and high SES | |
|
Race (non-Hispanic Black vs. non-Black) |
0.42 (0.26, 0.59) | - | - | 0.31 (0.10, 0.53) | 0.23 (−0.08, 0.54) | - |
|
Sex (female vs. male) |
- | −0.17 (−0.34, −0.01) | - | −0.26 (−0.47, −0.05) | - | −0.44 (−0.71, −0.17) |
| Cumulative life course SES3 (low vs. high) |
- | - | 0.36 (0.20, 0.53) | 0.21 (0.01, 0.42) | 0.21 (−0.01, 0.43) | |
| Race*Sex | - | - | - | 0.24 (−0.08, 0.57) | - | - |
| Race*SES | - | - | - | - | 0.17 (−0.20, 0.54) | - |
| Sex*SES | - | - | - | - | - | 0.39 (0.05, 0.73) |
Associations obtained from a negative binomial regression model; estimated AL scores for a given group can be calculated by summing relevant betas and then exponentiating
Version i: simple summary approach, with medication correction and sex- and/or age-specific high-risk quartiles for DHEAS, %BF, and WC
Italiscized description under the intercept values identifies the subgroup for which the exponentiated intercept provides an AL score
Figure 1.
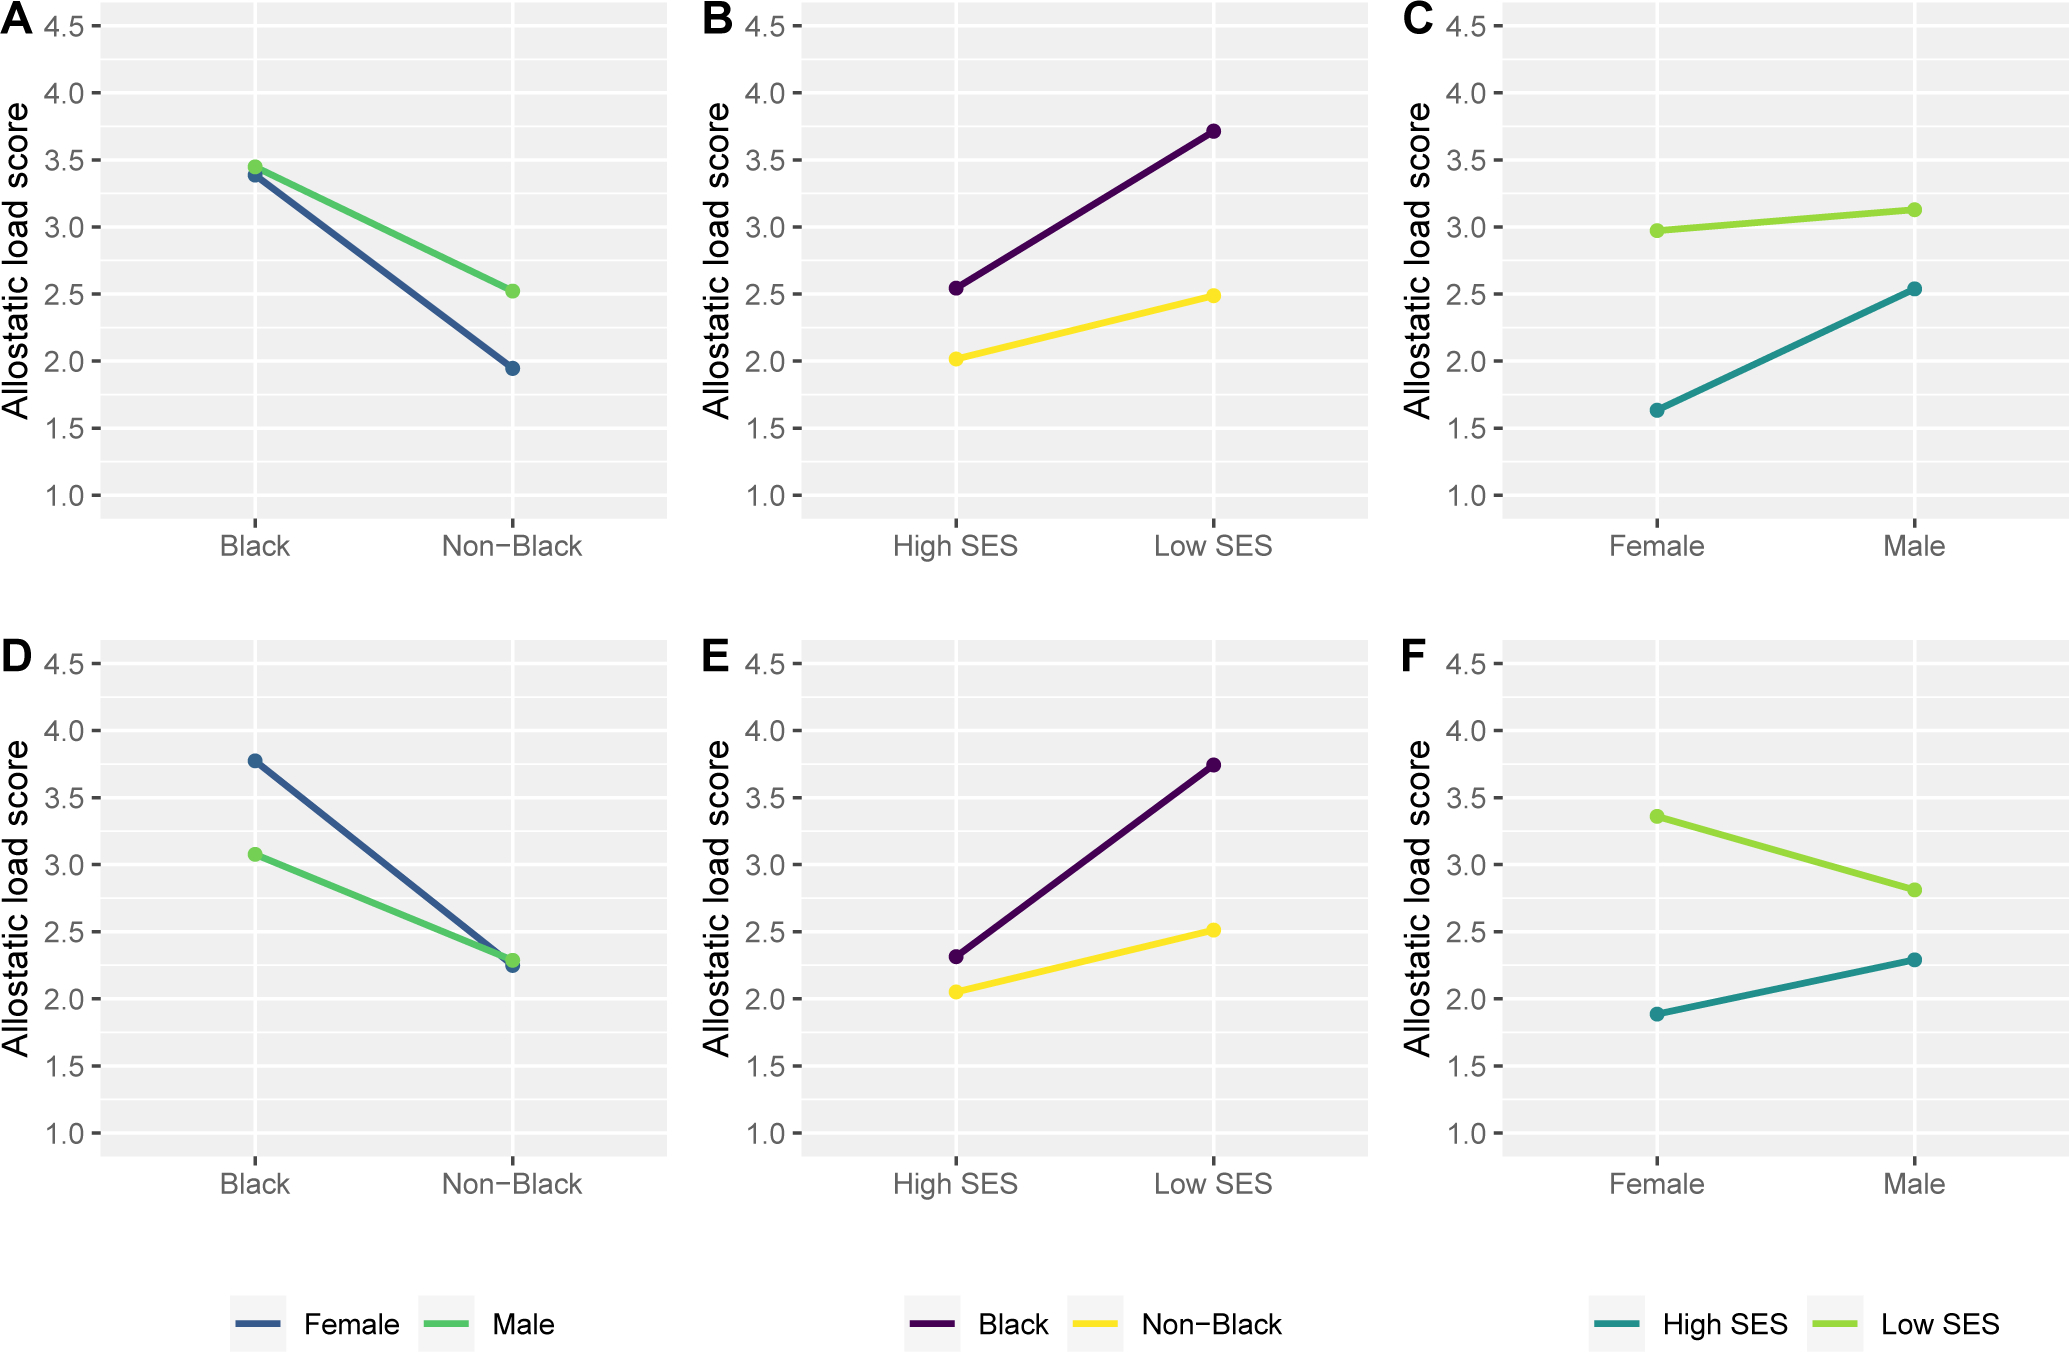
Plotting allostatic load scores within strata of all pairwise interactions between race, cumulative life course SES, and sex, comparing two different operationalizations of allostatic load that used a simple summary scoring method.
Plots A-C show average AL scores (version i) and their 95% confidence intervals within pairwise interactions of race and sex (plot A, prace*sex=0.15), race and SES (plot B, prace*SES=0.37) and sex and SES (plot C, psex*SES=0.023). Here, AL was created using the simple summary scoring algorithm, with correction for medication use, and with age- and/or sex-specific high-risk quartiles for DHEAS, %BF, and WC. Plots D-F show average AL scores (version iii) and their 95% confidence intervals within pairwise interactions of race and sex (plot D, prace*sex=0.16), race and SES (plot E, prace*SES=0.12) and sex and SES (plot F, psex*SES=0.022). Here AL was created using the simple summary scoring algorithm and with correction for medication, but without making any high-risk quartiles age- and/or sex-specific.
Except for tchol/HDL, a larger proportion of Black participants were in the high-risk quartile for each biomarker compared with non-Black participants (Supplemental Figures S1a–c). When further stratified by sex, a similar pattern was observed, suggesting that observed differences by race and/or sex were not driven by any one biomarker.
3.3. Results from alternative constructions of AL vs. primary method
AL patterning by race, life course SES, and sex, and the combination of these variables was robust to most methods of constructing AL: Supplemental Table S2 shows descriptive results comparing mean scores for each method of operationalizing AL overall and within strata, while Tables 4b–d and Supplemental Tables S3a–b show regression results for each strata and their pairwise interactions. Descriptively, in the total sample and within strata of either race or life course SES, mean AL scores were similar whether or not sex-specific high-risk quartiles were used (Supplemental Table S2). However, within strata of sex, mean AL scores for female participants were higher when sex-specific high-risk quartiles were not used in AL score creation for either the simple summary or MIDUS approach. Finally, for both approaches, overall and within all strata, mean AL scores were lower when medication correction was not performed.
Table 4b. Regression models examining the patterning of race, SES, and sex and their pairwise interactions with allostatic load scores in the total sample, using either the simple summary scoring algorithm (versions i and iii) or the MIDUS approach (versions iv and vi).1.
Results from negative binomial regression models where AL created using simple summary alternative construction (version iii)1
| AL score (version iii)2 | Independent associations | Pairwise interactions | ||||
|---|---|---|---|---|---|---|
|
| ||||||
| Model 1 | Model 2 | Model 3 | Model 4 | Model 5 | Model 6 | |
|
| ||||||
| Intercept 2 | 0.82 (0.72, 0.92) | 0.95 (0.84, 1.06) | 0.74 (0.62, 0.87) | 0.83 (0.69, 0.97) | 0.72 (0.58, 0.86) | 0.83 (0.66, 0.99) |
| non-Black | male | high SES | non-Black male | non-Black and high SES | male and high SES | |
|
Race (non-Hispanic Black vs. non-Black) |
0.40 (0.24, 0.56) | - | - | 0.30 (0.08, 0.51) | 0.12 (−0.18, 0.42) | - |
|
Sex (female vs. male) |
- | 0.06 (−0.10, 0.22) | - | −0.02 (−0.21, 0.18) | - | −0.19 (−0.45, 0.06) |
|
Cumulative life course SES3 (low vs. high) |
- | - | 0.38 (0.22, 0.54) | - | 0.20 (0.01, 0.40) | 0.21 (−0.01, 0.42) |
| Race*Sex | - | - | - | 0.22 (−0.09, 0.53) | - | - |
| Race*SES | - | - | - | - | 0.28 (−0.07, 0.63) | - |
| Sex*SES | - | - | - | - | - | 0.37 (0.05, 0.69) |
Associations obtained from a negative binomial regression model; estimated AL scores for a given group can be calculated by summing relevant betas and then exponentiating
Version iii: simple summary approach, with medication correction and no sex- and/or age-specific high-risk quartiles for any biomarkers
Italiscized description under the intercept values identifies the subgroup for which the exponentiated intercept provides an AL score
Table 4d. Regression models examining the patterning of race, SES, and sex and their pairwise interactions with allostatic load scores in the total sample, using either the simple summary scoring algorithm (versions i and iii) or the MIDUS approach (versions iv and vi).1.
Results from negative binomial regression models where AL created using MIDUS method of construction (version vi)1
| AL score (version vi)2 | Independent associations | Pairwise interactions | ||||
|---|---|---|---|---|---|---|
|
| ||||||
| Model 1 | Model 2 | Model 3 | Model 4 | Model 5 | Model 6 | |
|
| ||||||
| Intercept 3 | 0.90 (0.79, 1.00) | 0.94 (0.83, 1.05) | 0.85 (0.73, 0.98) | 0.80 (0.66, 0.94) | 0.82 (0.68, 0.96) | 0.84 (0.68, 1.01) |
| non-Black | male | high SES | non-Black male | non-Black and high SES | male and high SES | |
|
Race (non-Hispanic Black vs. non-Black) |
0.49 (0.32, 0.66) | - | - | 0.38 (0.15, 0.61) | 0.15 (−0.15, 0.45) | - |
|
Sex (female vs. male) |
- | 0.26 (0.10, 0.43) | - | 0.20 (−0.00, 0.39) | - | 0.02 (−0.23, 0.26) |
|
Cumulative life course SES3 (low vs. high) |
- | - | 0.38 (0.21, 0.54) | - | 0.16 (−0.04, 0.36) | 0.17 (−0.05, 0.40) |
| Race*Sex | - | - | - | 0.26 (−0.08, 0.59) | - | - |
| Race*SES | - | - | - | - | 0.39 (−0.02, 0.76) | - |
| Sex*SES | - | - | - | - | - | 0.41 (−0.09, 0.74) |
Associations obtained from linear regression model; estimated AL scores for a given group can be calculated by summing relevant betas
Version vi: MIDUS approach, with medication correction and no sex- and/or age-specific high-risk quartiles for any biomarkers
Italiscized description under the intercept values identifies the subgroup for which the exponentiated intercept provides an AL score
In regression analyses, when the primary AL measure was recreated using the MIDUS approach (version iv) the direction of all coefficients was the same, although the sex-difference (Model 2) and the sex*SES interaction (Model 6) were no longer statistically significant (Table 4c). When both the MIDUS and simple summary scoring approaches were performed without correction for medication use (versions v and ii, respectively; Supplemental Tables S3a and S3b), the direction of the findings remained the same, although the magnitude of disparities differed slightly, but not in a way that changed the qualitative interpretation of the findings.
Table 4c. Regression models examining the patterning of race, SES, and sex and their pairwise interactions with allostatic load scores in the total sample, using either the simple summary scoring algorithm (versions i and iii) or the MIDUS approach (versions iv and vi).1.
Results from linear regression models where AL was created using MIDUS method of construction (version iv)1
| AL score (version iv)2 | Independent associations | Pairwise interactions | ||||
|---|---|---|---|---|---|---|
|
| ||||||
| Model 1 | Model 2 | Model 3 | Model 4 | Model 5 | Model 6 | |
|
| ||||||
| Intercept 3 | 0.82 (0.78, 0.98) | 1.09 (0.98, 1.21) | 0.86 (0.73, 0.98) | 0.93 (0.79, 1.07) | 0.80 (0.66, 0.94) | 0.97 (0.80, 1.14) |
| non-Black | male | high SES | non-Black male | non-Black and high SES | male and high SES | |
|
Race (non-Hispanic Black vs. non-Black) |
0.51 (0.34, 0.68) | - | - | 0.44 (0.20, 0.67) | 0.28 (−0.02, 0.59) | - |
|
Sex (female vs. male) |
- | −0.07 (−0.24, 0.10) | - | −0.10 (−0.30, 0.10) | - | −0.24 (−0.49, 0.01) |
|
Cumulative life course SES3 (low vs. high) |
- | - | 0.35 (0.18, 0.52) | - | 0.17 (−0.03, 0.37) | 0.22 (−0.01, 0.45) |
| Race*Sex | - | - | - | 0.15 (−0.19, 0.49) | - | - |
| Race*SES | - | - | - | - | 0.24 (−0.14, 0.61) | - |
| Sex*SES | - | - | - | - | - | 0.28 (−0.06, 0.61) |
Associations obtained from linear regression model; estimated AL scores for a given group can be calculated by summing relevant betas
Version iv: MIDUS approach, with medication correction and no sex- and/or age-specific high-risk quartiles for any biomarkers
Italiscized description under the intercept values identifies the subgroup for which the exponentiated intercept provides an AL score
However, for both approaches, when the AL score was recreated without making any high-risk quartiles sex- and/or age-specific (versions iii and vi), we observed similar findings for race and life course SES but differences by sex when compared with our primary AL analyses. With these alternative constructions, female participants now had higher AL scores than male participants, on average. The difference was slight and non-significant for the simple summary approach (β=0.06, 95% CI: −0.10, 0.22, Table 4b) and fairly substantial and statistically significant for the MIDUS approach (β=0.26, 95%CI: 0.10, 0.43; Table 4d). Further, although not statistically significant, for both constructions, Black female participants had the highest AL scores in the sample (Model 4, Tables 4b and 4d).
Figures 1 and 2 visually represent the results for pairwise interactions (Models 4–6) across different methods of constructing AL; Figure 1 shows results using the simple summary approach while Figure 2 shows results using the MIDUS approach (for both figures, plots A-C show results from scores that use sex-specific high-risk quartiles and plots D-F show results from scores that do not). For both approaches, when AL was constructed without sex-specific quartiles, the sex*SES interaction reached statistical significance (psex*SES=0.022 for Model 6 in Table 4b and psex*SES=0.013 for Model 6 in Table 4d). As visualized in plot F of Figures 1 and 2, here, low-SES female participants had the highest AL scores, contributing to a much greater life course SES disparity in female than male participants. Additionally, while the direction of findings was similar across all AL scoring algorithms, for the alternative MIDUS construction, the race*SES interaction reached statistical significance (prace*SES=0.040 for Model 5 in Table 4d), showing the difference in AL between Black and non-Black participants to be much greater in strata of low-SES than high-SES. Here, the narrowing of the disparity appears to be driven by AL score improvements with high life course SES for Black compared with non-Black participants (Figure 2, plot E).
Figure 2.

Plotting allostatic load scores within strata of all pairwise interactions between race, cumulative life course SES, and sex comparing two different operationalizations of allostatic load that weighted subsystems equally before summation (the “MIDUS approach”).
Plots A-C show average AL scores (version iv) and their 95% confidence intervals within pairwise interactions of race and sex (plot A, prace*sex=0.39), race and SES (plot B, prace*SES=0.21) and sex and SES (plot C, psex*SES=0.10). Here, AL was created using the “MIDUS approach” scoring algorithm, with correction for medication use, and with age- and/or sex-specific high-risk quartiles for DHEAS, %BF, and WC. Plots D-F show average AL scores (version vi) and their 95% confidence intervals within pairwise interactions of race and sex (plot D, prace*sex=0.13), race and SES (plot E, prace*SES=0.040) and sex and SES (plot F, psex*SES=0.013). Here, AL was created using the “MIDUS approach” scoring algorithm and with correction for medication, but without making any high-risk quartiles age- and/or sex-specific.
Finally, for all constructions, results were unaffected by outliers or by using white participants instead of non-Black participants as the comparison group.
4. Discussion
Few prior studies have examined the patterning of AL by race, life course SES, sex and their pairwise interactions, comparing different operationalizations of AL in the same study. In the CHDS-DS, we found that AL disparities by race and life course SES were consistently reproduced for each AL measure, regardless of the overarching method of construction (simple summary vs. MIDUS approach). We also observed that neither medication correction nor exclusion of outliers changed our findings. However, we did find, perhaps unsurprisingly, that sex-differences in AL scores were sensitive to whether AL scores were constructed using any sex-specific high-risk biomarker quartiles or not.
Most commonly in the literature, AL is constructed using a simple summary approach without making any high-risk biomarker quartiles sex-specific. When we created AL this way, female participants in our sample had slightly higher AL scores than male participants, and, consistent with prior work, Black female participants had the highest AL scores in the sample (Geronimus et al., 2006; Rodriguez et al., 2019). This was also the case when the MIDUS scoring algorithm was used without sex-specific quartiles, only here the sex-differences were even larger, perhaps due to the downweighing of biomarkers in the metabolic system, which in prior studies were shown to be disproportionately elevated in male participants (Beckie, 2012; Buckwalter et al., 2016; Kinnunen et al., 2005; Mair et al., 2011; Santos-Lozada and Daw, 2018; Seeman et al., 2002).
The implications of creating sex-specific high-risk quartiles (or not) requires careful thought. AL theory provides a framework for understanding how chronic social stressors become embedded within a person to negatively impact health over the life course via perturbation of various physiologic systems. In this way, measures of AL contain both biological and social dimensions, and therefore decisions regarding how to construct, analyze, and interpret AL in studies should be informed by both health disparities theory and biological plausibility. For example, one reason researchers may want to create age- and sex-specific high-risk DHEAS quartiles (as was done in our main AL measure herein) is to account for menopausal status, a biological process which could influence DHEAS levels (MedlinePlus.). In addition, because measures of adiposity have sex-specific reference values (North American Association for the Study of Obesity, 2000; Shah and Braverman, 2012), and may vary by sex as function of processes unrelated to AL, we decided their high-risk quartiles should also be sex-specific in our primary AL measure. However, sex-differences in AL are also a function social experiences, such as chronic stress resulting from repeated exposure to sex-based discrimination over the life course (Juster et al., 2019; Juster and Lupien, 2012). By removing sex-differences for these components (via the creation of sex-specific quartiles) we limited our ability to investigate or detect this patterning. And, indeed, our results using scales without sex-specific quartiles produced AL patterns more consistent with expectations from health disparities theory (Williams, 2002). Yet, when using non-sex-specific scales, we run the risk of attributing observed differences to social experiences that they may or may not entirely reflect. For questions of health disparities, accounting for both sex and gender using—where available—robust, multi-category measures of each may help researchers tease apart more biological from social drivers of AL differences. Otherwise, these tradeoffs of creating sex-specific scales should be considered and discussed in light of the research objective.
In general, the operationalization of the construct of AL has been criticized for being inconsistent in the literature (Johnson et al., 2017). We thought carefully about our approach given available biomarkers. We excluded body mass index from our score, choosing %BF and WC instead, which we believe better capture the metabolic consequences (e.g., adiposity) of sustained stress or cortisol activity. In addition, we chose the simple summary approach as our primary construction method because it is intuitive, easily interpreted, and often gives results similar to more complex methods (Salazar et al., 2016). Further, we corrected the score for medication use, believing it provides evidence of underlying physiological deterioration for a particular subsystem; therefore, participants should be placed in the high-risk quartile for a given biomarker if they take medications to treat a condition measured by that biomarker (Geronimus et al., 2006).
However, even with care in the construction and testing of our AL score, our measure has some limitations. First, it only included 10 biomarkers from among four subsystems, with unbalanced biomarker representation within subsystems. For example, our score included 5 biomarkers from the metabolic subsystem and only 1 (DHEAS) from the neuroendocrine subsystem. However, a prior systematic review reported that most included studies did not have any measures of HPA-axis biomarkers, such as DHEAS, which are important elements of the concept of AL (“primary mediators” (McEwen, 2005)), making inclusion of this biomarker – despite it being the only neuroendocrine marker in our score – a strength of our study. Further, when we weighted subsystems equally before summation (to account for imbalance) findings were similar to those using the simple summary approach. Still, we lacked measures for some biomarkers important to AL, such as cortisol, although prior measurement work has shown that AL findings are robust to the choice of biomarkers used for represented physiological systems (Wiley et al., 2016). This may be especially true in the case of AL disparities studies, as a prior systematic review looking at SES disparities in AL found that in nearly every study AL scores were higher in low- vs. high-SES individuals, despite huge variation across studies in the methods and/or biomarkers used to create the AL scores (Johnson et al., 2017).
Additionally, although the observed AL patterns in the current study were consistent with expectations, and most results (particularly for race and life course SES) were similar across all AL operationalizations, the sample size likely limited our ability to detect significant differences in some two-way interactions, and we were underpowered to explore the three-way interaction between these factors. Because of this, we encourage a focus on the general pattern of findings over the exact magnitude of the differences reported across models. In addition, restricting our analyses to the CHDS-DS serology subsample (n=400) may have introduced some selection bias, as those who participated in serology appeared healthier, on average, than those who did not. Specifically, Black female participants had the largest proportion of exclusions by refusal or technical issue (39%) and, among them, those excluded had worse values for several measures (e.g., waist circumference) than those who completed serology. Thus, it is possible that we are underestimating the prevalence of high AL among Black female participants in our sample, particularly when using the AL measure with sex-specific high-risk quartiles.
Despite this, the use of the CHDS-DS is a strength of our study. This is a unique sample with oversampling of Black individuals, and good variation in SES in the total sample (Link et al., 2017). Given that the CHDS-DS was designed with the purpose of documenting mid-life disparities, it is particularly well-suited to compare whether different scoring procedures produce anticipated race and life course SES disparities in AL. Further, the overall CHDS-DS sample (n=605) is comparable with NHANES on a number of measures, including some that make up the AL score (Link et al., 2017), and, where there was overlap in biomarkers, the cut-points for our high-risk quartiles were quite similar to those in NHANES IV (Geronimus et al., 2006), suggesting that findings are generalizable. Finally, while the mid-life measures in the CHDS-DS are cross-sectional, we are confident that race and sex cannot be affected by AL, and our SES measure was cumulative over the life course beginning at birth; thus, we believe that temporality was established in this study.
5. Conclusions
AL theory provides a useful framework for understanding how chronic social stressors become embedded within a person to negatively impact health over the life course, but its operationalization has been subject to debate. In our sample we compared different operationalizations of AL and, for each, examined the patterning of AL by race, life course SES, and sex as well as their pairwise interactions. All constructions of the AL measure revealed expected disparities in AL by race (Black participants having higher AL scores than non-Black participants or, in sensitivity analyses, white participants) and SES (lower SES participants having higher AL scores than higher SES participants). Disparities by sex emerged only when the AL score was constructed without any sex-specific high-risk quartiles, raising an interesting issue about the importance of matching one’s approach to construction of the AL measure to the purpose of their study; when disparities are of interest, AL measures constructed using sex-specific high-risk quartiles to account for differences due to physiological processes may mask those resulting from social experiences. In conclusion, while we encourage future methodological exploration around issues of AL measurement, our results suggest that the basic AL concept is consistently expressed across different operationalizations, making it an especially useful and robust tool for understanding disparities by race and SES.
Supplementary Material
Highlights.
We constructed and compared different versions of the allostatic load (AL) score
For each version, expected disparities in AL by race and SES were observed
How AL was constructed impacted whether disparities by sex were observed
Overall, the basic AL concept was consistently expressed across different versions
AL is a useful and robust tool for understanding disparities by race and SES
Funding
This work was supported by the National Institute for Child Health and Development (NICHD) [R01HD058515]. KLK was supported by T32-ES02377 from the National Institute of Environmental Health Sciences.
Footnotes
Conflict of interest statement
The authors have no competing interests or conflicts of interest to declare
Publisher's Disclaimer: This is a PDF file of an unedited manuscript that has been accepted for publication. As a service to our customers we are providing this early version of the manuscript. The manuscript will undergo copyediting, typesetting, and review of the resulting proof before it is published in its final form. Please note that during the production process errors may be discovered which could affect the content, and all legal disclaimers that apply to the journal pertain.
References
- Allain CC, Poon LS, Chan CS, Richmond W, Fu PC, 1974. Enzymatic determination of total serum cholesterol. Clinical chemistry 20, 470–475. [PubMed] [Google Scholar]
- American Heart Association, 2017. Cholesterol ratio, Heart and stroke encyclopedia.
- Beckie TM, 2012. A systematic review of allostatic load, health, and health disparities. Biological Research For Nursing 14, 311–346. [DOI] [PubMed] [Google Scholar]
- Buckwalter GJ, Castellani B, Mcewen B, Karlamangla AS, Rizzo AA, John B, O’donnell K, Seeman T, 2016. Allostatic load as a complex clinical construct: A case-based computational modeling approach. Complexity 21, 291–306. [DOI] [PMC free article] [PubMed] [Google Scholar]
- Carlson ED, Chamberlain RM, 2005. Allostatic load and health disparities: a theoretical orientation. Research in Nursing & Health 28, 306–315. [DOI] [PubMed] [Google Scholar]
- Carretero OA, Oparil S, 2000. Essential hypertension. Part I: definition and etiology. Circulation 101, 329–335. [DOI] [PubMed] [Google Scholar]
- Christensen DS, Flensborg-Madsen T, Garde E, Hansen ÅM, Masters Pedersen J, Mortensen EL, 2018. Early life predictors of midlife allostatic load: A prospective cohort study. PLOS ONE 13, e0202395. [DOI] [PMC free article] [PubMed] [Google Scholar]
- Chyu L, Upchurch DM, 2011. Racial and ethnic patterns of allostatic load among adult women in the United States: findings from the National Health and Nutrition Examination Survey 1999–2004. Journal of Womens Health (Larchmt) 20, 575–583. [DOI] [PMC free article] [PubMed] [Google Scholar]
- Clark MS, Bond MJ, Hecker JR, 2007. Environmental stress, psychological stress and allostatic load. Psychol Health Med 12, 18–30. [DOI] [PubMed] [Google Scholar]
- Fava GA, McEwen BS, Guidi J, Gostoli S, Offidani E, Sonino N, 2019. Clinical characterization of allostatic overload. Psychoneuroendocrinology 108, 94–101. [DOI] [PubMed] [Google Scholar]
- Geronimus AT, 2013. Jedi public health: leveraging contingencies of social identity to grasp and eliminate racial health inequality, in: Gomez LE (Ed.), Mapping “race”: critical approaches to health disparities research, pp. 163–178. [Google Scholar]
- Geronimus AT, Hicken M, Keene D, Bound J, 2006. “Weathering” and age patterns of allostatic load scores among Blacks and Whites in the United States. American journal of public health 96, 826–833. [DOI] [PMC free article] [PubMed] [Google Scholar]
- Goosby BJ, Cheadle JE, Mitchell C, 2018. Stress-Related Biosocial Mechanisms of Discrimination and African American Health Inequities. Annual Review of Sociology 44, 319–340. [DOI] [PMC free article] [PubMed] [Google Scholar]
- Gruenewald TL, Karlamangla AS, Hu P, Stein-Merkin S, Crandall C, Koretz B, Seeman TE, 2012. History of socioeconomic disadvantage and allostatic load in later life. Social science & medicine (1982) 74, 75–83. [DOI] [PMC free article] [PubMed] [Google Scholar]
- Guidi J, Lucente M, Sonino N, Fava GA, 2021. Allostatic Load and Its Impact on Health: A Systematic Review. Psychotherapy and Psychosomatics 90, 11–27. [DOI] [PubMed] [Google Scholar]
- Gustafsson PE, Janlert U, Theorell T, Westerlund H, Hammarström A, 2011. Socioeconomic status over the life course and allostatic load in adulthood: results from the Northern Swedish Cohort. Journal of epidemiology and community health 65, 986–992. [DOI] [PubMed] [Google Scholar]
- Howard JT, Sparks PJ, 2016. Does allostatic load calculation method matter? Evaluation of different methods and individual biomarkers functioning by race/ethnicity and educational level. American Journal of Human Biology. [DOI] [PubMed] [Google Scholar]
- Johnson SC, Cavallaro FL, Leon DA, 2017. A systematic review of allostatic load in relation to socioeconomic position: Poor fidelity and major inconsistencies in biomarkers employed. Social Science & Medicine 192, 66–73. [DOI] [PubMed] [Google Scholar]
- Juster R-P, McEwen BS, Lupien SJ, 2010. Allostatic load biomarkers of chronic stress and impact on health and cognition. Neuroscience & Biobehavioral Reviews 35, 2–16. [DOI] [PubMed] [Google Scholar]
- Juster RP, de Torre MB, Kerr P, Kheloui S, Rossi M, Bourdon O, 2019. Sex Differences and Gender Diversity in Stress Responses and Allostatic Load Among Workers and LGBT People. Curr Psychiatry Rep 21, 110. [DOI] [PubMed] [Google Scholar]
- Juster RP, Lupien S, 2012. A sex- and gender-based analysis of allostatic load and physical complaints. Gender medicine 9, 511–523. [DOI] [PubMed] [Google Scholar]
- Kinnunen M-L, Kaprio J, Pulkkinen L, 2005. Allostatic load of men and women in early middle age. Journal of Individual Differences 26, 20–28. [Google Scholar]
- Landry A, Docherty P, Ouellette S, Cartier LJ, 2017. Causes and outcomes of markedly elevated C-reactive protein levels. Canadian family physician Medecin de famille canadien 63, e316–e323. [PMC free article] [PubMed] [Google Scholar]
- Link BG, Susser ES, Factor-Litvak P, March D, Kezios KL, Lovasi GS, Rundle AG, Suglia SF, Fader KM, Andrews HF, Johnson E, Cirillo PM, Cohn BA, 2017. Disparities in self-rated health across generations and through the life course. Social science & medicine (1982) 174, 17–25. [DOI] [PMC free article] [PubMed] [Google Scholar]
- Mair CA, Cutchin MP, Kristen Peek M, 2011. Allostatic load in an environmental riskscape: the role of stressors and gender. Health & place 17, 978–987. [DOI] [PMC free article] [PubMed] [Google Scholar]
- McEwen BS, 1998. Stress, adaptation, and disease: allostasis and allostatic load. Annals of the New York Academy of Sciences 840, 33–44. [DOI] [PubMed] [Google Scholar]
- McEwen BS, 2005. Stressed or stressed out: what is the difference? J Psychiatry Neurosci 30, 315–318. [PMC free article] [PubMed] [Google Scholar]
- McEwen BS, Seeman T, 1999. Protective and damaging effects of mediators of stress: elaborating and testing the concepts of allostasis and allostatic load. Annals of the New York Academy of Sciences 896, 30–47. [DOI] [PubMed] [Google Scholar]
- MedlinePlus., DHEA-sulfate test, National Library of Medicine (US), Bethesda (MD). [Google Scholar]
- NIH Medline Plus, 2012. Cholesterol Levels: What You Need to Know.
- North American Association for the Study of Obesity, N.H., Lung, Blood Institute, NHLBI Obesity Education Initiative, 2000. The practical guide: identification, evaluation, and treatment of overweight and obesity in adults. National Institutes of Health, National Heart, Lung, and Blood Institute, NHLBI Obesity Education Initiative, North American Association for the Study of Obesity. [Google Scholar]
- Prescribers’ Digital Reference, 2016.
- R Core Team, 2013. R: A language and environment for statistical computing.
- Rifai N, Cole TG, Iannotti E, Law T, Macke M, Miller R, Dowd D, Wiebe DA, 1998. Assessment of interlaboratory performance in external proficiency testing programs with a direct HDL-cholesterol assay. Clinical chemistry 44, 1452–1458. [PubMed] [Google Scholar]
- Roberts WL, 2004. CDC/AHA Workshop on Markers of Inflammation and Cardiovascular Disease: Application to Clinical and Public Health Practice: laboratory tests available to assess inflammation--performance and standardization: a background paper. Circulation 110, e572–576. [DOI] [PubMed] [Google Scholar]
- Robertson T, Watts E, 2015. The importance of age, sex and place in understanding socioeconomic inequalities in allostatic load: Evidence from the Scottish Health Survey (2008–2011). BMC public health 16, 126. [DOI] [PMC free article] [PubMed] [Google Scholar]
- Robinette JW, Charles ST, Almeida DM, Gruenewald TL, 2016. Neighborhood features and physiological risk: An examination of allostatic load. Health & place 41, 110–118. [DOI] [PMC free article] [PubMed] [Google Scholar]
- Rodriguez JM, Karlamangla AS, Gruenewald TL, Miller-Martinez D, Merkin SS, Seeman TE, 2019. Social stratification and allostatic load: shapes of health differences in the MIDUS study in the United States. Journal of biosocial science, 1–18. [DOI] [PMC free article] [PubMed] [Google Scholar]
- Rodriquez EJ, Kim EN, Sumner AE, Nápoles AM, Pérez-Stable EJ, 2019. Allostatic Load: Importance, Markers, and Score Determination in Minority and Disparity Populations. Journal of urban health : bulletin of the New York Academy of Medicine 96, 3–11. [DOI] [PMC free article] [PubMed] [Google Scholar]
- Salazar CR, Strizich G, Seeman TE, Isasi CR, Gallo LC, Avilés-Santa ML, Cai J, Penedo FJ, Arguelles W, Sanders AE, Lipton RB, Kaplan RC, 2016. Nativity differences in allostatic load by age, sex, and Hispanic background from the Hispanic Community Health Study/Study of Latinos. SSM - population health 2, 416–424. [DOI] [PMC free article] [PubMed] [Google Scholar]
- Santos-Lozada AR, Daw J, 2018. The contribution of three dimensions of allostatic load to racial/ethnic disparities in poor/fair self-rated health. SSM - Population Health 4, 55–65. [DOI] [PMC free article] [PubMed] [Google Scholar]
- Seeman TE, Singer BH, Rowe JW, Horwitz RI, McEwen BS, 1997. Price of adaptation—allostatic load and its health consequences: Macarthur studies of successful aging. Archives of Internal Medicine 157, 2259–2268. [PubMed] [Google Scholar]
- Seeman TE, Singer BH, Ryff CD, Love GD, Levy-Storms L, 2002. Social relationships, gender, and allostatic load across two age cohorts. Psychosomatic medicine 64, 395–406. [DOI] [PubMed] [Google Scholar]
- Selvin E, Coresh J, Jordahl J, Boland L, Steffes MW, 2005. Stability of haemoglobin A1c (HbA1c) measurements from frozen whole blood samples stored for over a decade. Diabetic medicine : a journal of the British Diabetic Association 22, 1726–1730. [DOI] [PubMed] [Google Scholar]
- Shah NR, Braverman ER, 2012. Measuring Adiposity in Patients: The Utility of Body Mass Index (BMI), Percent Body Fat, and Leptin. PLoS ONE 7, e33308. [DOI] [PMC free article] [PubMed] [Google Scholar]
- Sterling P, Eyer J, 1988. Allostasis: a new paradigm to explain arousal pathology. [Google Scholar]
- Sugiuchi H, Uji Y, Okabe H, Irie T, Uekama K, Kayahara N, Miyauchi K, 1995. Direct measurement of high-density lipoprotein cholesterol in serum with polyethylene glycol-modified enzymes and sulfated alpha-cyclodextrin. Clinical chemistry 41, 717–723. [PubMed] [Google Scholar]
- Szanton SL, Gill JM, Allen JK, 2005. Allostatic load: a mechanism of socioeconomic health disparities? Biological Research For Nursing 7, 7–15. [DOI] [PMC free article] [PubMed] [Google Scholar]
- van den Berg BJ, Christianson RE, Oechsli FW, 1988. The California Child Health and Development Studies of the School of Public Health, University of California at Berkeley. Paediatric and perinatal epidemiology 2, 265–282. [DOI] [PubMed] [Google Scholar]
- Weykamp C, 2013. HbA1c: a review of analytical and clinical aspects. Ann Lab Med 33, 393–400. [DOI] [PMC free article] [PubMed] [Google Scholar]
- Wiley JF, Gruenewald TL, Karlamangla AS, Seeman TE, 2016. Modeling multisystem physiological dysregulation. Psychosomatic medicine 78, 290–301. [DOI] [PMC free article] [PubMed] [Google Scholar]
- Williams DR, 2002. Racial/ethnic variations in women’s health: the social embeddedness of health. American journal of public health 92, 588–597. [DOI] [PMC free article] [PubMed] [Google Scholar]
Associated Data
This section collects any data citations, data availability statements, or supplementary materials included in this article.