

Abstract
Pure squamous cell carcinoma (SCC) is the most common pure variant form of bladder cancer, found in 2–5% of cases. It often presents late and is unresponsive to cisplatin‐based chemotherapy. The molecular features of these tumours have not been elucidated in detail. We carried out whole‐exome sequencing (WES), copy number, and transcriptome analysis of bladder SCC. Muscle‐invasive bladder cancer (MIBC) samples with no evidence of squamous differentiation (non‐SD) were used for comparison. To assess commonality of features with urothelial carcinoma with SD, we examined data from SD samples in The Cancer Genome Atlas (TCGA) study of MIBC. TP53 was the most commonly mutated gene in SCC (64%) followed by FAT1 (45%). Copy number analysis revealed complex changes in SCC, many differing from those in samples with SD. Gain of 5p and 7p was the most common feature, and focal regions on 5p included OSMR and RICTOR. In addition to 9p deletions, we found some samples with focal gain of 9p24 containing CD274 (PD‐L1). Loss of 4q35 containing FAT1 was found in many samples such that all but one sample analysed by WES had FAT1 mutation or deletion. Expression features included upregulation of oncostatin M receptor (OSMR), metalloproteinases, metallothioneins, keratinisation genes, extracellular matrix components, inflammatory response genes, stem cell markers, and immune response modulators. Exploration of differentially expressed transcription factors identified BNC1 and TFAP2A, a gene repressed by PPARG, as the most upregulated factors. Known urothelial differentiation factors were downregulated along with 72 Kruppel‐associated (KRAB) domain‐containing zinc finger family protein (KZFP) genes. Novel therapies are urgently needed for these tumours. In addition to upregulated expression of EGFR, which has been suggested as a therapeutic target in basal/squamous bladder cancer, we identified expression signatures that indicate upregulated OSMR and YAP/TAZ signalling. Preclinical evaluation of the effects of inhibition of these pathways alone or in combination is merited.
Keywords: muscle‐invasive bladder cancer, squamous cell carcinoma, whole exome, transcriptome, copy number, FAT1, KZFP genes, EGFR, OSMR, YAP
Introduction
In Europe and the United States, ~60–70% of bladder tumours are classified as urothelial carcinoma (UC). The remainder have components of mixed morphology or are pure variants [1], of which pure squamous cell carcinoma (SCC) is the most common (2–5%) [2]. Squamous differentiation (SD) is also the most common variant in tumours with mixed morphology [3]. The majority of SCC are moderately or poorly differentiated [1], most are muscle‐invasive bladder cancers (MIBC) at presentation, and they are more common in females [4, 5]. Due to relatively small numbers, there have been no large randomised studies to guide treatment and there are limited data on the effects of specific treatments. Studies of registry data indicate reduced overall survival in bladder SCC compared to conventional UC [6, 7, 8] and suggest that for non‐metastatic SCC, radical cystectomy achieves better outcomes than radiotherapy [9, 10]. Some evidence for a benefit from preoperative radiotherapy is reported [11] but not from neoadjuvant chemotherapy [5, 12, 13]. Thus, there is an urgent need for novel approaches to therapy.
The molecular features of pure SCC of the bladder have not been extensively studied. Upregulated protein expression of EGFR; p53 [14]; cytokeratins 5, 6, 7, and 14; and loss of cytokeratin 20 and uroplakin II expression [15] are reported. Targeted sequence analysis of 17 pure SCC identified common mutations in TP53, PIK3CA, FBXW7, and CDKN2A and copy number gains that included MYC (8q), BIRC3 (11q), and EGFR (7p) [16]. It is unclear to what extent pure SCC and UC with SD share genomic features or whether there is heterogeneity in tumours of mixed histology. A single study that reported mutation, copy number, and expression data from separate regions of UC and SD described both concordance and divergence in profiles [17].
To increase the understanding of pure bladder SCC and provide an improved basis for examination of components of tumours with mixed histology, we have carried out whole‐exome sequencing (WES), genome‐wide DNA copy number analysis, and transcriptome analysis of a series of pure SCC samples. We made comparisons with conventional UC with no SD (non‐SD) and data from UC with SD from The Cancer Genome Atlas (TCGA) analysis of MIBC [18].
Materials and methods
Patients and samples
Clinical samples and associated clinical data were sourced from the Leeds Multidisciplinary Research Tissue Bank (REC reference: 20/YH/0103). All patients provided written consent. Cold cup biopsies were snap‐frozen and stored in liquid nitrogen and the remainder of the sample embedded in paraffin for diagnostic assessment. These samples included 24 pure SCC and 18 conventional MIBC with no SD, designated as ‘non‐SD’.
DNA and RNA extraction and molecular analysis
Genomic DNA was isolated from frozen tissue sections comprising at least 70% of tumour cells using a QIAamp DNA Mini Kit (Qiagen, Manchester, UK) or a Gentra PureGene Tissue Kit (Qiagen, Manchester UK). DNA was extracted from venous blood samples using a Nucleon BACC DNA Extraction Kit (Cytiva, Little Chalfont, UK) or by salt precipitation.
WES was carried out on tumour and paired leucocyte DNA using the SureSelect Human All Exon V6 Kit (Agilent Technologies Ltd, Stockport, UK). Low‐pass whole‐genome sequencing was used to assess copy number alterations. Total RNA was isolated from frozen tissue sections and analysed using Affymetrix Human Transcriptome 2.0 microarrays (ThermoFisher Scientific, Warrington, UK). Further details are given in Supplementary materials and methods. Twenty‐one pure SCC samples underwent copy number analysis, 16 transcriptome analysis, and 11 whole‐exome analysis. Transcriptome analysis alone was carried out on the 18 non‐SD samples (supplementary material).
Statistical analysis
Group comparisons of candidate genes used the Mann–Whitney test. Results are reported without correction for multiple testing. A significance level of 0.05 was used. Pearson and Spearman correlation analyses to evaluate the relationships between copy number and gene expression were carried out using Partek Genomics Suite (St. Louis, MO, USA).
Transcriptome analysis
The R2: Genomics Analysis and Visualization Platform (http://r2.amc.nl) was used for data visualisation, data mining, and analysis of transcriptome data. Gene Ontology (GO, biological processes) and KEGG pathway enrichment analysis was performed using the Database for Annotation and Integrated Discovery (DAVID) v6.8. Gene Set Enrichment Analysis v3.0 was carried out using all genes run against gene sets in the Hallmarks database (v7.1). Details are given in Supplementary materials and methods.
Results
We identified 24 pure SCC samples collected between 2002 and 2012. As reported previously [7, 9], there was a significant skew towards female patients (M:F ratio 0.75:1). Three samples contained large populations of infiltrating immune cells and insufficient tumour cells for analysis. The remaining 21 samples were used for copy number analysis and sufficient RNA was extracted for transcriptome analysis of 16. Expression data from 18 non‐SD MIBC samples were used for comparison. For WES, 10 samples were used directly and one was enriched for tumour cells by microdissection. Samples and analysis platforms are described in supplementary material. Expression, mutation, and copy number data from the TCGA study of MIBC [18] were used for comparison.
Mutational profile and signatures
WES generated a mean coverage of 91×, with 90% being >30×. We identified 8,108 somatic mutations (7,068 single‐nucleotide variants [SNVs] and 1,040 indels). A total of 4,279 were non‐synonymous (mean and median rates of 8.85 and 7.55 per Mb, respectively). Samples contained an average of 364 (175–488) SNVs and 25 indels (9–18; one outlier with 150). Synonymous, missense, and loss‐of‐function mutations (nonsense, frameshift, or mutations in the invariant dinucleotide at splice junctions) showed averages of 90 (41–137), 231 (116–295), and 48 (27–176) per sample, respectively.
C>T transitions (48%) and C>G transversions (25%) dominated (supplementary material, Figure S1A). Assessment of the 30 single base substitution (SBS) signatures described in the Catalogue of Somatic Mutations in cancer (COSMIC) (http://cancer.sanger.ac.uk/cosmic/signatures) (supplementary material, Figure S1B) identified two subsets, one dominated by the two APOBEC signatures SBS2 and SBS13 (supplementary material, Figure S1C) that are the most common signatures in bladder cancer overall. In four tumours lacking an APOBEC signature, SBS1, 5, 6, 14, and 15 were enriched. The tumour with a very large number of indels (1,552) was dominated by SBS6 and SBS15 that are associated with defective mismatch repair and associated with small indels at mononucleotide repeats (supplementary material, Figure S1C). Indeed, 130 of 150 indels were deletions, which involved deletion of a single nucleotide (70% A or T) in 108 cases.
The TCGA analysis of MIBC included 42 samples with mixed urothelial and SD and 3 pure squamous tumours, the remainder designated here as ‘non‐SD’ [18]. Mutational patterns of the SD samples showed no differences from the pure SCC samples analysed here.
We identified non‐synonymous mutations in 15 genes in ≥3 pure SCC samples (Figure 1). TP53 was the most frequently mutated followed by FAT1. KMT2C, KMT2D and LRP1B, and RYR2 showed inactivating mutations or missense mutations with predicted impact. CHUK, which encodes IκΒ kinase a (IKKa) that is involved in the NFκΒ signalling pathway, showed inactivating mutations. We examined mutation frequencies in the TCGA samples. Notably, FAT1 mutations were less frequent in both SD and non‐SD TCGA samples (18 and 12%, respectively) than in pure SCC (45%). TP53 and RYR2 mutations were also less frequent in MIBC overall (48 and 18%, respectively) and showed no differences between SD and non‐SD samples. SD samples showed fewer ARID1A mutations (p = 0.04) and more STAG2, CDKN2A, and NFE2L2 mutations (p = 0.03, 0.004, and 0.01, respectively) than non‐SD samples (supplementary material, Figure S2). In pure SCC, we found one missense mutation in STAG2 and two in NFE2L2, both of which were scored as damaging by SIFT [19] and significant by CRAVAT [20], indicating that these are likely functional.
Figure 1.
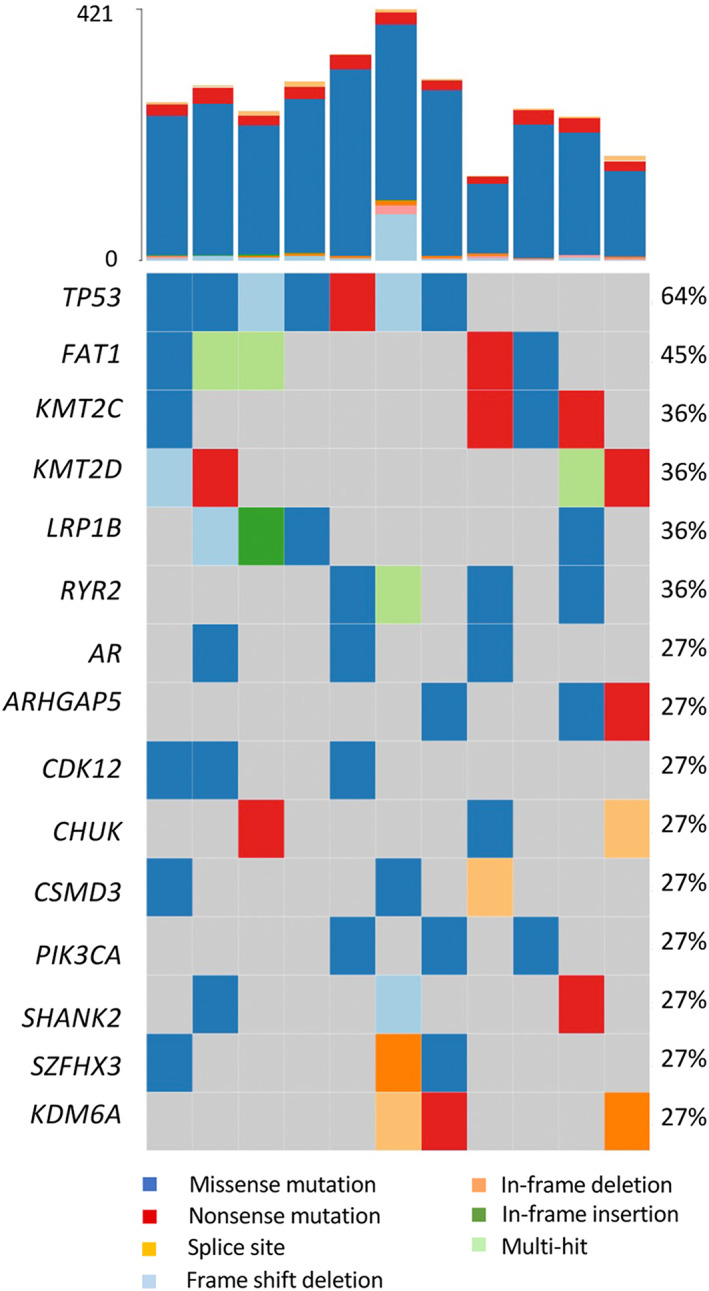
Mutations identified from whole‐exome sequences of pure bladder SCC. Bars at the top indicate the number of somatic mutations detected in each sample.
Copy number alterations
Complex patterns of DNA copy number alteration have been reported in other squamous carcinomas [21]. Here, the mean fraction of genome altered was 34.0% (range 0.28–66.6%, median 40.5%) with no gender‐related difference (supplementary material, Table S1). Regions on 37 chromosome arms showed alterations in ≥25% of samples (Figure 2A). Significant regions (supplementary material, Table S1) included losses on 3p, 4p, and 8p, and gains on 5p, 7p, 8q, and 20, as reported in other SCC [22, 23, 24, 25, 26, 27, 28].
Figure 2.
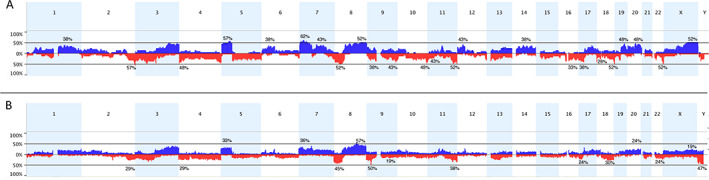
Copy number alterations in pure SCC and MIBC with SD. (A) Copy number alterations identified in pure bladder SCC samples. (B) Copy number alterations in SD samples in the TCGA study [18]. The x‐axis corresponds to chromosomes 1–22 and the y‐axis corresponds to the percentage of gains and losses. Copy number gains are shown in blue and losses in red.
Focal regions of high‐level gain included regions on 6p, 7p, 12q, and 13q (supplementary material, Table S2). Gains of 5p and 7p were the most common (57 and 62%, respectively). Two tumours shared a discrete region of gain (5p13.3 ‐ p13.1; chr5: 32,805,224‐42,345,448) that contains OSMR and RICTOR. All samples with gain of 5p included TERT (5p15.33). Amplicons on 7p in two samples included EGFR, and this region was gained in eight cases (38%).
Nineteen focal regions of deep but not homozygous loss were identified, 11 of which showed broader deletion in ≥25% of cases (supplementary material, Table S2). Loss of 9p is common in bladder tumours, with CDKN2A/ARF identified as the major target. Here, loss included CDKN2A in 7/21 cases, two of which contained an inactivating mutation. Interestingly, 9p gains were also common (6/21) and in three cases, a focal region (9p24.3 ‐ p24.1) included CD274 (PDL‐1) (supplementary material, Figure S3). Loss of 4p and/or 4q was detected in 48%. Distal 4q contains FAT1 (4q35.2). Assessment of 4q35.2 copy number and mutation data revealed that 10 out of 11 samples examined by WES had deletion, mutation, or both (Table 1), suggesting that loss of function of FAT1 is a critical event in these tumours.
Table 1.
Deletion and mutation of FAT1 in bladder SCC
| Sample | Deletion of FAT1 region (4q35.2) | Mutation |
|---|---|---|
| 491 | Yes | – |
| 697 | No | – |
| 780 | Yes | – |
| 1014 | Yes | p.W3660* |
| 1207 | Yes | p.V862Qfs*11; p.I861N |
| 1241 | Yes | – |
| 1552 | Yes | – |
| 1789 | Yes | – |
| 2067 | No | p.D1536Y |
| 2159 | Yes | p.R548L |
| 2188 | No | p.Q1244*; p.S1315L |
We compared copy number data from pure SCC and TCGA samples with SD (Figure 2B). This identified lower frequencies of gains of 5p, 6p, 7p, 12p, 14, 19, and Xq; losses of 3p, 4p, 4q, 9q, 10q, and 22; and a higher frequency of losses of the CDKN2A region on 9p in SD samples. Loss of 8p and gain of 8q were similar in SD and pure SCC (45 and 54% of SD cases, and 52 and 48% of pure SCC samples, respectively), similar frequencies to those reported in MIBC overall [29, 30].
Transcriptional features
Alignment of expression data with copy number profiles identified 16 genes including CD44 (11p) whose expression followed DNA copy number changes (supplementary material). We examined mRNA expression levels of markers of luminal and basal/squamous subtypes of bladder cancer and genes differentially expressed in other SCC tissues in SCC and non‐SD MIBC (Figure 3). As expected, SCC samples expressed higher levels of transcription factors (TFs) involved in squamous cell fate and differentiation, keratins, and other markers of the basal/squamous subtype of bladder cancer. TFs and genes that are involved in terminal differentiation of normal urothelial cells that are expressed in luminal subtypes of UC were expressed at low levels. Genes involved in the structure and function of the stratified epithelium, intercellular desmosome junction proteins, small proline‐rich proteins, and serine protease inhibitors were highly elevated. SCC were also enriched for markers of epithelial‐to‐mesenchymal transition (EMT) and immune markers, and expressed low levels of claudins. Examination of tyrosine kinase receptor expression highlighted higher levels of EGFR and lower levels of ERBB2 and ERBB3 relative to non‐SD MIBC (Figure 3).
Figure 3.
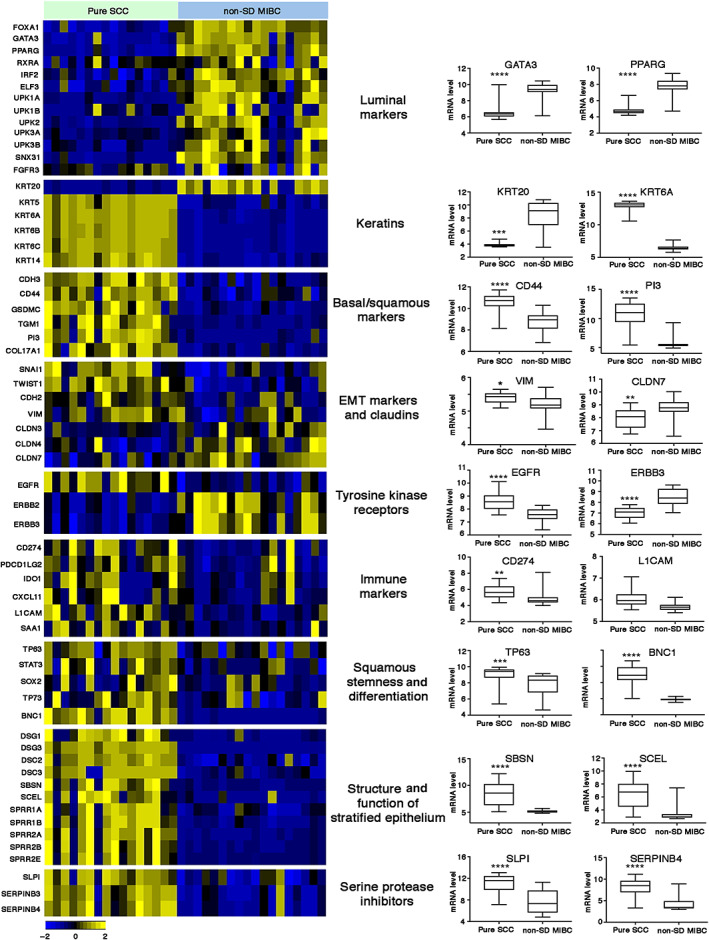
Differential gene expression of key gene sets in pure SCC and MIBC without SD (non‐SD). P values: ****p < 0.0001, ***p < 0.001, **p < 0.01, *p < 0.05.
Comparison of SCC and non‐SD samples identified 2,359 differentially expressed genes (DEGs). Similar to other SCC types, high levels of oncostatin M receptor (OSMR), multiple matrix metalloproteinases, and metallothionein genes were detected (supplementary material, Table S3). Gene Set Enrichment Analysis (GSEA) of Hallmark gene sets revealed enrichment of TNF‐alpha signalling via NFκΒ, EMT, reduced KRAS signalling, inflammatory response, apical junction, and apoptosis in SCC samples (supplementary material, Figure S4). GO analysis of the 2,359 DEGs identified biological processes category GO:0043066 (negative regulation of apoptotic process) enriched in pure SCC in addition to categories related to keratinisation, extracellular matrix (ECM), structural constituents of the cytoskeleton, and inflammatory response. Biological processes associated with genes downregulated in SCC included fatty acid beta‐oxidation, lipid homeostasis, peroxisome organisation, and oxidation–reduction process (supplementary material, Table S3 and Figure S5). KEGG pathway analysis of upregulated DEGs highlighted pathways involving proteoglycans, ECM–receptor interaction, focal adhesion, and protein digestion and absorption, and analysis of downregulated genes highlighted pathways involving the peroxisome, PPAR signalling, fatty acid metabolism, and glutathione metabolism (supplementary material, Table S3).
To assess overlapping and enriched gene expression features of pure SCC and tumours with mixed squamous and urothelial components (SD MIBC), we compared expression data for SD and non‐SD MIBC from the TCGA study [18]. This identified 3,751 DEGs (supplementary material, Table S3), including 1,188 that were differentially expressed between pure SCC and non‐SD samples. Differences were less striking than those between pure SCC and non‐SD samples (supplementary material, Figure S6).
MIBCs with SD in the TCGA data set were also enriched for GO categories associated with keratinisation, structural constituents of the cytoskeleton, ECM, inflammatory response, and negative regulation of apoptotic process (supplementary material, Table S3). Fatty acid beta‐oxidation and lipid homeostasis were also downregulated in SD MIBC. G2/M transition of the mitotic cell cycle (GO:0000086) was enriched in SD MIBC, but not in pure SCC (supplementary material, Table S3). Biological processes relating to peroxisome organisation and oxidation–reduction were not detected. GSEA analysis of the TCGA data set identified five Hallmark gene sets enriched only in the SD samples (p < 0.01): mTORC1 signalling, p53 pathway, G2/M checkpoint, hypoxia, and glycolysis. Apoptosis was enriched in the TCGA SD MIBC samples but was non‐significant (p = 0.05) (supplementary material, Table S3 and Figure S7).
We examined the expression of EGFR and its ligands in both data sets. AREG, EREG, HBEGF, TGFA, and EPGN were all upregulated in squamous compared to non‐squamous samples. BTC was expressed at higher levels in non‐squamous samples and EGF was not differentially expressed in either data set (supplementary material, Figure S8).
The transcriptional drivers of SD are not well defined. We assessed the expression of 1,639 human TFs [31] and found 120 highly significantly differentially expressed (p < 0.0001) (28 higher and 92 lower) in pure SCC compared to non‐SD samples (Figure 4 and supplementary material, Table S4). The most significantly upregulated TF in SCC was basonuclin 1 (BNC1) (p = 9.02E‐11), a gene expressed in the basal layer of squamous epithelia. Compatible with this, GO analysis of genes positively associated with BNC1 expression identified ‘cornification’ (GO:70268) as the most significant category (p = 5.5E‐50). BNC1 is a direct transcriptional target of TP63 [32] and TP63 and BNC1 mRNA levels were strongly correlated (Pearson r = 0.74), although no relationship of TP63 expression with the common gains on 3q28 was apparent. TFAP2A, previously identified as downregulated following PPARG activation in a cell line model [33], was the second most upregulated TF (Figure 4). Many of the TFs identified are upregulated in other squamous cancer types. Interestingly, 73 TFs expressed at lower level in SCC were zinc finger proteins, most of which are Kruppel‐associated (KRAB) domain‐containing zinc finger family protein (KZFP) genes [34]. Of these, 57 map to chromosome 19. We examined the expression of these DEGs in the TCGA data set and found similar up‐ or down‐regulation in SD samples and in tumours of the basal/squamous subtype that lacked morphological features of SD compared to all others (supplementary material, Table S4 and Figure S9).
Figure 4.
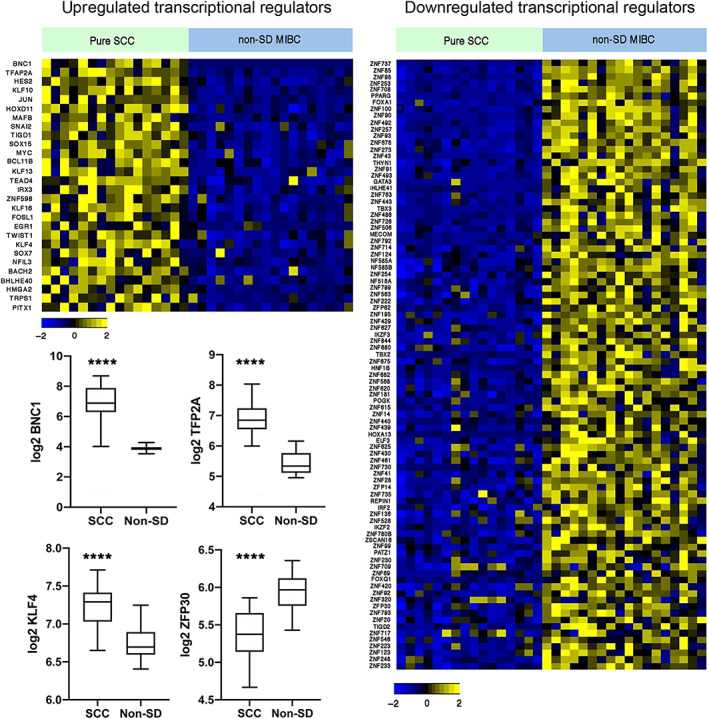
Heatmap showing z‐scores for transcriptional regulators in pure SCC and MIBC without SD (non‐SD). Expression of 1,639 transcriptional regulators was assessed and DEGs with p < 0.0001 are shown. Box plots show mean, 25th and 75th percentiles, and minimum and maximum values. Mann–Whitney test. ****p < 0.0001.
Oncostatin M receptor (OSMR)
The high frequency of 5p gain including focal regions of gain or amplification that contained the IL6 family receptor OSMR suggested that this may be an important driver of bladder SCC. OSMR heterodimerises with IL6ST and IL31RA and transduces OSM and IL31 signalling via these dimers [35]. A feed‐forward loop has been reported in cervical SCC in which OSM via OSMR stimulates the production of OSM, OSMR, and STAT3 resulting in a range of pro‐oncogenic phenotypes [36]. We identified significantly upregulated expression of OSMR, OSM, IL31RA, and STAT3, but not IL6ST, suggesting signalling via OSMR:IL31RA heterodimers (Figure 5A). STAT3 and OSMR levels were correlated in SCC samples (Pearson r = 0.48; p = 0.05) and in MIBC overall (Pearson r = 0.66; p < 0.0001). OSMR also binds activated EGFR [37]. EGFR was upregulated (Figure 5A) and there was correlation between EGFR and OSMR expression in SCC (Pearson r = 0.529; p = 0.03) and MIBC overall (Pearson r = 0.64; p < 0.0001). OSM, which is implicated in driving inflammatory responses, was correlated with an acute inflammatory gene signature (GO:0002526) in SCC samples (Pearson r = 0.633; p = 0.0085).
Figure 5.
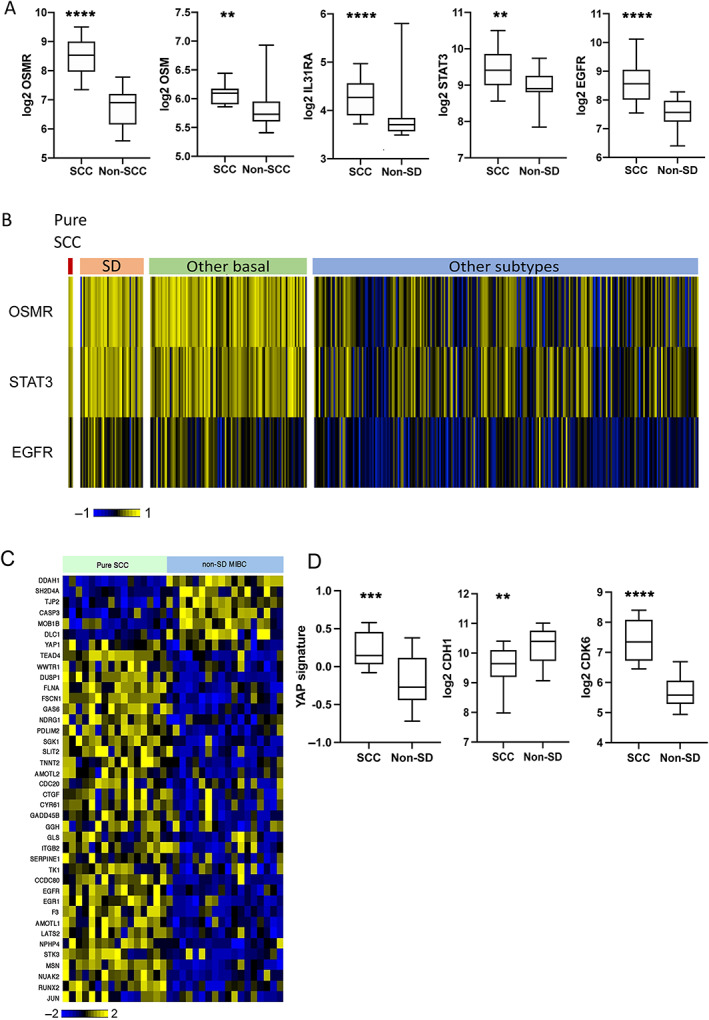
OSMR and YAP signalling in pure bladder SCC and other subtypes. (A) Expression of OSMR, OSM, IL31RA, STAT3, and EGFR in pure SCC and MIBC without SD (non‐SD). (B) Heatmap showing the expression of OSMR, STAT3, and EGFR according to subtypes identified in the TCGA study of MIBC [18]. (C) Heatmap showing the expression of YAP/TAZ target genes in SCC and non‐SD MIBC. (D) Comparison of expression of YAP signature, CDH1, and CDK6 in SCC and non‐SD MIBC. Box plots show mean, 25th and 75th percentiles, and minimum and maximum values. Mann–Whitney test. P values: ****p < 0.0001,***p < 0.001, **p < 0.01.
Similar relationships of OSMR:STAT3 and OSMR:EGFR were present in the TCGA SD versus non‐SD samples (r = 0.65 and 0.48, respectively; p < 0.0001 for both). In the TCGA data set, expression levels in the 3 pure SCC, 42 SD samples, and 105 other samples classified as basal/squamous showed strong upregulation of OSMR and STAT3 compared to all other subtypes, although some other samples also had elevated expression. EGFR was also higher in these groups, although fewer samples exhibited highly elevated expression (Figure 5B). These results suggest a major role for OSMR in MIBC with SD or basal/squamous classification.
YAP signalling
Our finding of frequent mutations and deletions of FAT1 suggested a tumour suppressor role in bladder SCC. In Drosophila, fat regulates Hippo signalling and its loss of function upregulates downstream yap signalling [38]. Where mutational inactivation or copy number loss is common, FAT1 is implicated as a tumour suppressor, whereas an oncogenic role has been reported in other cancers [39, 40, 41, 42, 43], suggesting that cellular context is critical. Thus, loss of function in glioma cells and immortalised astrocytes is reported to upregulate a range of β‐catenin targets, with no effect on YAP/TAZ targets [44], whereas in other human tumours, loss of function is linked to inactivation of the Hippo pathway and upregulation of YAP/TAZ targets [45, 46].
Here, we identified changes in SCC that indicated inhibition rather than activation of Wnt/β‐catenin signalling, including upregulation of the inhibitory secreted frizzled‐related genes SFRPs 1, 2, and 4; AXIN1; and CTNNBI2P1, a protein that interferes with β‐catenin–T‐cell factor (TCF) interaction [47]. Downregulated genes included BMP1 and activin membrane bound receptor (BAMBI) whose knockdown has been reported to inhibit Wnt/β‐catenin signalling [48], frizzled 4 (FZD4), FZD5, their co‐receptor LRP5, and β‐catenin itself (CTNNB1) (supplementary material, Figure S10).
We examined genes and gene signatures [49, 50] upregulated by YAP/TAZ signalling [51, 52, 53]. The widely reported YAP/TAZ targets CYR61 (CNN1) and CTGF (CNN2) were strongly upregulated. TAZ (WWTR1) and EGFR, a YAP/TAZ target, showed upregulation, the latter driven in part by DNA copy number gains as indicated above. TEAD4 and JUN, which as part of AP‐1 acts with YAP/TAZ/TEAD complexes at enhancers [54], were upregulated and NUAK2, a YAP/TAZ activator [55], was upregulated (Figure 5C).
YAP and TAZ have major influences on cell phenotype. In addition to effects on proliferation, they drive phenotypic plasticity, including conversion of differentiated cells to stem cells, and influence EMT and immune response modifiers. Clear indications of these effects were apparent. There was upregulation of CD44, CD47, GLI1, and STAT3, markers of bladder cancer stem cell populations [56, 57]. SOX9, which is implicated in YAP/TAZ‐mediated induction of stemness in other cell types [58], and KLF4, a required TF in iPS reprogramming [59] and transcriptional partner of YAP/TAZ [60], were also upregulated (supplementary material, Figure S11A,B).
Genes implicated in the modulation of immune response were upregulated. YAP/TAZ can directly regulate PD‐L1 (CD274) via TEAD‐binding sites in the enhancer region of PD‐L1 [61, 62, 63]. Here, expression was higher in SCC than in non‐squamous MIBC (supplementary material, Figure S11C). YAP signalling is also implicated in the recruitment of myeloid‐derived suppressor cells (MDSCs) that secrete suppressive cytokines that inhibit T cell activation and induce regulatory T cells. We examined the expression of 15 tumour‐associated factors implicated in recruitment, differentiation, and activity of MDSCs [64] and found 13 were upregulated (supplementary material, Figure S11C). Together, these data indicate a YAP/TAZ‐associated immunosuppressive state. The same profiles were upregulated in TCGA SD samples, although many non‐SD samples showed similar profiles (supplementary material, Figure S12).
We also examined genes reported to respond to FAT1 downregulation. In oesophageal carcinoma cells, knockdown of FAT1 leads to downregulation of E‐cadherin (CDH1) and upregulation of N‐cadherin (CDH2) [65], and in breast cancer loss of FAT1 leads to upregulated CDK6 [46], alterations that were present here (Figure 5D). Overall, these data suggest that loss of FAT1 function is a major mechanism of YAP/TAZ activation in bladder SCC.
Discussion
We report the first whole‐exome sequences of pure SCC of the bladder. This confirms the high frequency of TP53 mutation previously reported from targeted sequencing [16, 66]. We identified mutations in several genes reported to be mutated in other types of SCC. FAT1 mutation, also found in lung and oesophageal SCC [22, 67], was the second most common mutation and this together with the finding of deletion of distal 4q in other samples implicates FAT1 loss in >90% of samples. As FAT1 mutation is significantly less frequent in MIBC with SD, our data suggest that its loss of function may be a prerequisite for the development of pure squamous tumours. RYR2, a gene not included in previous targeted sequencing studies of bladder SCC, encodes a large protein that as a homotetramer forms a calcium channel located in the endoplasmic reticulum. It is highly expressed in heart and brain, and germline mutations are associated with cardiac arrhythmias. Inactivating mutations have been reported in several cancers including lung SCC where 40% of cases in the TCGA study had mutation [23]. In head and neck cancer, both mutation and promoter methylation have been identified [68] and links of mutation to tumour mutation burden and high expression levels of immune checkpoint proteins have been made [69]. CHUK mutations are reported in several SCC types [70, 71], suggesting that our finding of inactivating mutations is significant. Further examination of these genes in bladder SCC is now merited.
We identified several regions of common copy number alteration, some of which appear different from those found in MIBC with SD. Notable differences included gain of 5p including OSMR and of 7p including EGFR. Large regions of gain in SCC within which no clear candidate genes were identified include 19q and 20q. As several regions of the genome showed very similar frequencies of alteration, this suggests that differences in tumour cell content in this and the TCGA study did not mask key differences.
Transcriptional features of pure SCC included upregulated keratinisation, ECM reorganisation, inflammatory response and negative regulation of apoptosis, and downregulation of genes involved in the glutathione‐dependent antioxidant system, PPAR signalling, and fatty acid beta‐oxidation in the peroxisome. As expected, transcriptional regulators known to be involved in urothelial differentiation and/or luminal phenotype (PPARG, GATA3, FOXA1, and ELF3) were strongly downregulated. In bladder tumour cells, PPARG together with FOXA1 and GATA3, can affect re‐programming from SD to a more luminal phenotype [72].
BNC1 was the most highly expressed TF. This is compatible with its expression in the basal layer of stratified squamous epithelia and its role in driving keratinocyte proliferation [73]. It is a direct transcriptional target of TP63 [32] and its expression was strongly correlated with TP63 expression. TFAP2A, a TF shown previously to be downregulated following PPARG activation in cell line models and to be upregulated in the basal/squamous subtype of MIBC and regions of SD in bladder tumours of mixed morphology [33], was the second most upregulated TF. As ectopic expression of TFAP2A can induce expression of TP63 in cell lines [33], it may represent a key regulator of TP63 in these tumours. EGFR signalling, which was upregulated in SCC samples, is also implicated in regulating TP63 and may play a role [74]. Interestingly, in contrast to a previous report that KLF4 is upregulated in bladder tumour cell lines in response to a PPARG agonist [33], we found KLF4 levels to be significantly higher in SCC and also in the basal/squamous subtype of MIBC. This is also contrary to the finding that TP63 represses KLF4 in normal keratinocytes [75] and suppresses SD in a mouse model of oral SCC [76]. Its expression and role in SCC appear to differ widely in other tissue types, reported as a major positive transcriptional regulator in head and neck SCC [77] as found here but with low expression in cutaneous SCC [77].
Of the 92 downregulated transcriptional regulators in SCC, 73 were zinc finger proteins, 70 of which are KRAB‐ZNFPs. These belong to a large family that provide a major defence system to limit the mobilisation of transposable elements within the genome [78] and their expression is closely correlated with the expression of endogenous viral sequences in tumours [79]. They also interact with, or regulate many other proteins and contribute to a wide range of biological processes [80]. When bound to DNA, KRAB‐ZNFPs recruit chromatin modifiers that can induce heterochromatin formation. This may suggest that there is a relative genome‐wide hypomethylation in SCC compared to other MIBC. Importantly, one of the downregulated genes identified here, ZNF30, has been identified as a proadipogenic regulator that activates PPARG and several other genes we found downregulated (AHNAK, PLAUR, COL11A1, and CDK6) [81]. Downregulation of individual KRAB‐ZNFPs has been reported in other squamous tumours [82, 83, 84]. Our data suggest coordinated regulation of a significant proportion of the family in bladder SCC with a direct link to cellular differentiation state via PPARG.
As reported previously in bladder SCC [16, 85], the basal/squamous subtype of MIBC [86], and in UC with SD [87, 88], we found upregulated expression of PD‐L1 (CD274) and confirmed a previous finding of amplification of the gene [66] in some pure SCC. We also confirm upregulated expression of EGFR in these and SD tumours [89, 90].
In addition to the suggestion that many of these tumours may respond well to EGFR and immune checkpoint inhibitors, our data highlight two novel potential approaches to therapy. Gain or amplification of 5p and increased expression of OSMR, its ligand OSM, and binding partner IL31RA signalling via which is known to upregulate STAT3 suggest that this signalling pathway acts as a critical oncogenic driver. Inhibition of the pathway in cervical SCC and ovarian cancer models using antibodies to OSMR has shown significant inhibition of STAT3 activation [36, 91]. Thus, we suggest that inhibition of OSMR or OSM might be effective in bladder SCC. Breakthrough therapy designation was granted in 2020 for vixarelimab, a monoclonal antibody directed at OSMR for the treatment of the chronic inflammatory condition prurigo nodularis‐associated pruritis. However, there is no published information on this drug and efficacy in cancer‐related models is unknown.
Finally, our data implicate FAT1 as a tumour suppressor in bladder SCC, with a strong relationship of its loss to upregulated YAP/TAZ signalling and its effects including stem cell phenotype and immunosuppressive state. YAP can influence sensitivity to EGFR inhibition [92, 93] and chemosensitivity [94], and can influence PD‐L1 expression [61, 93, 95]. In patient‐derived xenograft models of bladder cancers with SD, it has been shown to protect from cisplatin‐induced DNA damage [96]. Thus, it may represent an important target in bladder SCC and basal/squamous subtype tumours. However, as we show a potential relationship to OSMR signalling and multiple relationships and feedback loops have been reported between expression of YAP1, NUAK2, EGFR, and PD‐L1 [53, 55, 61, 93, 95, 97, 98], cell type specific functional studies will be required to establish optimal therapeutic combinations.
Author contributions statement
MAK and CDH designed the study. MAK, J‐AR, and SJ obtained funding. J‐AR reviewed histopathology. MAK, CDH, GC, FMP, and OA carried out data analysis. CDH, FMP, and EVIB prepared the samples. CDH, FMP, EVIB, and JEB conducted the experiments. JB collected clinical samples and obtained clinical data. MAK and CDH wrote the manuscript and all authors revised the manuscript and approved the submitted version.
Supporting information
Supplementary materials and methods
Figure S1. Mutational signature of bladder SCC
Figure S2. Comparison of mutation frequencies in samples with SD and those without in the TCGA study of MIBC
Figure S3. Copy number alterations in 9p
Figure S4. Gene Set Enrichment Analysis results depicting differential expression of Hallmark gene sets between pure bladder SCC and non‐squamous muscle‐invasive tumours
Figure S5. Heatmaps showing z‐scores for selected GO biological process categories and Wnt/β‐catenin signalling genes in pure SCC and MIBC without SD
Figure S6. Differential expression of key gene sets in samples with SD and those without (non‐SD) in the TCGA study of MIBC
Figure S7. Gene Set Enrichment Analysis results depicting differential expression of Hallmark gene sets in samples with SD and those without (non‐SD) in the TCGA study of MIBC
Figure S8. Heatmaps (z‐scores) and boxplots (log2 mRNA levels) depicting differential expression of EGFR and EGFR ligands
Figure S9. Heatmap showing z‐scores for transcriptional regulators in pure SCC samples, samples with SD, basal squamous tumours with no SD recorded (other basal), and all other subtypes in the TCGA study of MIBC
Figure S10. Heatmap showing z‐scores for Wnt/β‐catenin signalling genes
Figure S11. Differential expression of selected genes implicated in YAP/TAZ‐mediated stemness and modulation of the immune response in pure SCC and MIBC without SD (non‐SD)
Figure S12. Differential expression of selected genes implicated in YAP/TAZ‐mediated stemness and modulation of the immune response in samples with SD and those without (non‐SD) in the TCGA study of MIBC
Table S1. Details of patients, samples, and analysis platforms
Table S2. Summary of copy number alterations per sample and significant regions of copy number alteration identified in >25% of samples
Table S3. Focal high‐level copy number gains and regions of focal copy number loss
Table S4. Genes with significant correlation between copy number and expression level
Table S5. Genes significantly differentially expressed between sample groups and functional categories enriched in each of the groups
Table S6. Transcription factors differentially expressed between pure SCC and non‐SD MIBC
Acknowledgements
We thank all patients who gave consent for their samples to be used. This work was funded by Yorkshire Cancer Research (L376PA).
Conflict of interest statement: MAK has advisory/consulting roles at Janssen, QED, Loxo Oncology, and Rainier Therapeutics.
Data availability statement
Microarray data are available at the Gene Expression Omnibus under accession number GSE186691. Raw sequencing data are available at The European Genome‐phenome Archive (EGA), accession number EGAS00001005960.
References
References 99–109 are cited only in the supplementary material.
- 1. Moschini M, D'Andrea D, Korn S, et al. Characteristics and clinical significance of histological variants of bladder cancer. Nat Rev Urol 2017; 14: 651–668. [DOI] [PubMed] [Google Scholar]
- 2. Abol‐Enein H, Kava BR, Carmack AJ. Nonurothelial cancer of the bladder. Urology 2007; 69: 93–104. [DOI] [PubMed] [Google Scholar]
- 3. Eble JN, Sauter G, Epstein JI, et al. (eds). World Health Organization Classification of Tumours. Pathology and Genetics of Tumours of the Urinary System and Male Genital Organs. IARC Press: Lyon, 2004. [Google Scholar]
- 4. Vetterlein MW, Seisen T, Leow JJ, et al. Effect of nonurothelial histologic variants on the outcomes of radical cystectomy for nonmetastatic muscle‐invasive urinary bladder cancer. Clin Genitourin Cancer 2018; 16: E129–E139. [DOI] [PubMed] [Google Scholar]
- 5. Matulay JT, Woldu SL, Lim A, et al. The impact of squamous histology on survival in patients with muscle‐invasive bladder cancer. Urol Oncol 2019; 37: 353.e17–353.e24. [DOI] [PubMed] [Google Scholar]
- 6. Royce TJ, Lin CC, Gray PJ, et al. Clinical characteristics and outcomes of nonurothelial cell carcinoma of the bladder: results from the National Cancer Data Base. Urol Oncol 2018; 36: 78.e1–78.e12. [DOI] [PubMed] [Google Scholar]
- 7. Scosyrev E, Yao J, Messing E. Urothelial carcinoma versus squamous cell carcinoma of bladder: is survival different with stage adjustment? Urology 2009; 73: 822–827. [DOI] [PubMed] [Google Scholar]
- 8. Chen C, Hu L, Chen Y, et al. The prognostic value of histological subtype in patients with metastatic bladder cancer. Oncotarget 2017; 8: 28408–28417. [DOI] [PMC free article] [PubMed] [Google Scholar]
- 9. Abdel‐Rahman O. Squamous cell carcinoma of the bladder: a SEER database analysis. Clin Genitourin Cancer 2017; 15: e463–e468. [DOI] [PubMed] [Google Scholar]
- 10. Stensland KD, Zaid H, Broadwin M, et al. Comparative effectiveness of treatment strategies for squamous cell carcinoma of the bladder. Eur Urol Oncol 2020; 3: 509–514. [DOI] [PubMed] [Google Scholar]
- 11. Martin JW, Carballido EM, Ahmed A, et al. Squamous cell carcinoma of the urinary bladder: systematic review of clinical characteristics and therapeutic approaches. Arab J Urol 2016; 14: 183–191. [DOI] [PMC free article] [PubMed] [Google Scholar]
- 12. Dotson A, May A, Davaro F, et al. Squamous cell carcinoma of the bladder: poor response to neoadjuvant chemotherapy. Int J Clin Oncol 2019; 24: 706–711. [DOI] [PubMed] [Google Scholar]
- 13. Bandini M, Pederzoli F, Madison R, et al. Unfavorable cancer‐specific survival after neoadjuvant chemotherapy and radical cystectomy in patients with bladder cancer and squamous cell variant: a multi‐institutional study. Clin Genitourin Cancer 2020; 18: e543–e556. [DOI] [PMC free article] [PubMed] [Google Scholar]
- 14. Guo CC, Gomez E, Tamboli P, et al. Squamous cell carcinoma of the urinary bladder: a clinicopathologic and immunohistochemical study of 16 cases. Hum Pathol 2009; 40: 1448–1452. [DOI] [PubMed] [Google Scholar]
- 15. Gaisa NT, Braunschweig T, Reimer N, et al. Different immunohistochemical and ultrastructural phenotypes of squamous differentiation in bladder cancer. Virchows Arch 2011; 458: 301–312. [DOI] [PubMed] [Google Scholar]
- 16. Udager AM, McDaniel AS, Hovelson DH, et al. Frequent PD‐L1 protein expression and molecular correlates in urinary bladder squamous cell carcinoma. Eur Urol 2018; 74: 529–531. [DOI] [PubMed] [Google Scholar]
- 17. Hovelson DH, Udager AM, McDaniel AS, et al. Targeted DNA and RNA sequencing of paired urothelial and squamous bladder cancers reveals discordant genomic and transcriptomic events and unique therapeutic implications. Eur Urol 2018; 74: 741–753. [DOI] [PubMed] [Google Scholar]
- 18. Robertson AG, Kim J, Al‐Ahmadie H, et al. Comprehensive molecular characterization of muscle‐invasive bladder cancer. Cell 2017; 171: 540–556. [DOI] [PMC free article] [PubMed] [Google Scholar]
- 19. Vaser R, Adusumalli S, Leng SN, et al. SIFT missense predictions for genomes. Nat Protoc 2016; 11: 1–9. [DOI] [PubMed] [Google Scholar]
- 20. Masica DL, Douville C, Tokheim C, et al. CRAVAT 4: cancer‐related analysis of variants toolkit. Cancer Res 2017; 77: e35–e38. [DOI] [PMC free article] [PubMed] [Google Scholar]
- 21. Campbell JD, Yau C, Bowlby R, et al. Genomic, pathway network, and immunologic features distinguishing squamous carcinomas. Cell Rep 2018; 23: 194–212. [DOI] [PMC free article] [PubMed] [Google Scholar]
- 22. Cancer Genome Atlas Network . Comprehensive genomic characterization of head and neck squamous cell carcinomas. Nature 2015; 517: 576–582. [DOI] [PMC free article] [PubMed] [Google Scholar]
- 23. Cancer Genome Atlas Research Network . Comprehensive genomic characterization of squamous cell lung cancers. Nature 2012; 489: 519–525. [DOI] [PMC free article] [PubMed] [Google Scholar]
- 24. Cancer Genome Atlas Research Network , Albert Einstein College of Medicine , Analytical Biological Services , et al. Integrated genomic and molecular characterization of cervical cancer. Nature 2017; 543: 378–384. [DOI] [PMC free article] [PubMed] [Google Scholar]
- 25. Song Y, Li L, Ou Y, et al. Identification of genomic alterations in oesophageal squamous cell cancer. Nature 2014; 509: 91–95. [DOI] [PubMed] [Google Scholar]
- 26. Taylor AM, Shih J, Ha G, et al. Genomic and functional approaches to understanding cancer aneuploidy. Cancer Cell 2018; 33: 676–689. [DOI] [PMC free article] [PubMed] [Google Scholar]
- 27. Chang J, Tan W, Ling Z, et al. Genomic analysis of oesophageal squamous‐cell carcinoma identifies alcohol drinking‐related mutation signature and genomic alterations. Nat Commun 2017; 8: 15290. [DOI] [PMC free article] [PubMed] [Google Scholar]
- 28. Inman GJ, Wang J, Nagano A, et al. The genomic landscape of cutaneous SCC reveals drivers and a novel azathioprine associated mutational signature. Nat Commun 2018; 9: 3667. [DOI] [PMC free article] [PubMed] [Google Scholar]
- 29. Simon R, Burger H, Semjonow A, et al. Patterns of chromosomal imbalances in muscle invasive bladder cancer. Int J Oncol 2000; 17: 1025–1029. [DOI] [PubMed] [Google Scholar]
- 30. Hurst CD, Platt FM, Taylor CF, et al. Novel tumor subgroups of urothelial carcinoma of the bladder defined by integrated genomic analysis. Clin Cancer Res 2012; 18: 5865–5877. [DOI] [PMC free article] [PubMed] [Google Scholar]
- 31. Lambert SA, Jolma A, Campitelli LF, et al. The human transcription factors. Cell 2018; 172: 650–665. [DOI] [PubMed] [Google Scholar]
- 32. Boldrup L, Coates PJ, Laurell G, et al. p63 transcriptionally regulates BNC1, a Pol I and Pol II transcription factor that regulates ribosomal biogenesis and epithelial differentiation. Eur J Cancer 2012; 48: 1401–1406. [DOI] [PubMed] [Google Scholar]
- 33. Yamashita H, Kawasawa YI, Shuman L, et al. Repression of transcription factor AP‐2 alpha by PPARgamma reveals a novel transcriptional circuit in basal‐squamous bladder cancer. Oncogenesis 2019; 8: 69. [DOI] [PMC free article] [PubMed] [Google Scholar]
- 34. Huntley S, Baggott DM, Hamilton AT, et al. A comprehensive catalog of human KRAB‐associated zinc finger genes: insights into the evolutionary history of a large family of transcriptional repressors. Genome Res 2006; 16: 669–677. [DOI] [PMC free article] [PubMed] [Google Scholar]
- 35. Jones SA, Jenkins BJ. Recent insights into targeting the IL‐6 cytokine family in inflammatory diseases and cancer. Nat Rev Immunol 2018; 18: 773–789. [DOI] [PubMed] [Google Scholar]
- 36. Kucia‐Tran JA, Tulkki V, Scarpini CG, et al. Anti‐oncostatin M antibody inhibits the pro‐malignant effects of oncostatin M receptor overexpression in squamous cell carcinoma. J Pathol 2018; 244: 283–295. [DOI] [PubMed] [Google Scholar]
- 37. Jahani‐Asl A, Yin H, Soleimani VD, et al. Control of glioblastoma tumorigenesis by feed‐forward cytokine signaling. Nat Neurosci 2016; 19: 798–806. [DOI] [PMC free article] [PubMed] [Google Scholar]
- 38. Harvey K, Tapon N. The Salvador‐Warts‐Hippo pathway – an emerging tumour‐suppressor network. Nat Rev Cancer 2007; 7: 182–191. [DOI] [PubMed] [Google Scholar]
- 39. Kang MH, Jeong GS, Smoot DT, et al. Verteporfin inhibits gastric cancer cell growth by suppressing adhesion molecule FAT1. Oncotarget 2017; 8: 98887–98897. [DOI] [PMC free article] [PubMed] [Google Scholar]
- 40. de Bock CE, Ardjmand A, Molloy TJ, et al. The Fat1 cadherin is overexpressed and an independent prognostic factor for survival in paired diagnosis‐relapse samples of precursor B‐cell acute lymphoblastic leukemia. Leukemia 2012; 26: 918–926. [DOI] [PubMed] [Google Scholar]
- 41. Dikshit B, Irshad K, Madan E, et al. FAT1 acts as an upstream regulator of oncogenic and inflammatory pathways, via PDCD4, in glioma cells. Oncogene 2013; 32: 3798–3808. [DOI] [PubMed] [Google Scholar]
- 42. Madan E, Dikshit B, Gowda SH, et al. FAT1 is a novel upstream regulator of HIF1alpha and invasion of high grade glioma. Int J Cancer 2016; 139: 2570–2582. [DOI] [PMC free article] [PubMed] [Google Scholar]
- 43. Srivastava C, Irshad K, Dikshit B, et al. FAT1 modulates EMT and stemness genes expression in hypoxic glioblastoma. Int J Cancer 2018; 142: 805–812. [DOI] [PubMed] [Google Scholar]
- 44. Morris LG, Kaufman AM, Gong Y, et al. Recurrent somatic mutation of FAT1 in multiple human cancers leads to aberrant Wnt activation. Nat Genet 2013; 45: 253–261. [DOI] [PMC free article] [PubMed] [Google Scholar]
- 45. Martin D, Degese MS, Vitale‐Cross L, et al. Assembly and activation of the Hippo signalome by FAT1 tumor suppressor. Nat Commun 2018; 9: 2372. [DOI] [PMC free article] [PubMed] [Google Scholar]
- 46. Li Z, Razavi P, Li Q, et al. Loss of the FAT1 tumor suppressor promotes resistance to CDK4/6 inhibitors via the Hippo pathway. Cancer Cell 2018; 34: 893–905. [DOI] [PMC free article] [PubMed] [Google Scholar]
- 47. Tago K, Nakamura T, Nishita M, et al. Inhibition of Wnt signaling by ICAT, a novel beta‐catenin‐interacting protein. Genes Dev 2000; 14: 1741–1749. [PMC free article] [PubMed] [Google Scholar]
- 48. Mai Y, Zhang Z, Yang H, et al. BMP and activin membrane‐bound inhibitor (BAMBI) inhibits the adipogenesis of porcine preadipocytes through Wnt/beta‐catenin signaling pathway. Biochem Cell Biol 2014; 92: 172–182. [DOI] [PubMed] [Google Scholar]
- 49. Cordenonsi M, Zanconato F, Azzolin L, et al. The Hippo transducer TAZ confers cancer stem cell‐related traits on breast cancer cells. Cell 2011; 147: 759–772. [DOI] [PubMed] [Google Scholar]
- 50. Wang Y, Xu X, Maglic D, et al. Comprehensive molecular characterization of the Hippo signaling pathway in cancer. Cell Rep 2018; 25: 1304–1317. [DOI] [PMC free article] [PubMed] [Google Scholar]
- 51. Zhao B, Ye X, Yu J, et al. TEAD mediates YAP‐dependent gene induction and growth control. Genes Dev 2008; 22: 1962–1971. [DOI] [PMC free article] [PubMed] [Google Scholar]
- 52. Zhang J, Smolen GA, Haber DA. Negative regulation of YAP by LATS1 underscores evolutionary conservation of the Drosophila Hippo pathway. Cancer Res 2008; 68: 2789–2794. [DOI] [PubMed] [Google Scholar]
- 53. Song S, Honjo S, Jin J, et al. The Hippo coactivator YAP1 mediates EGFR overexpression and confers chemoresistance in esophageal cancer. Clin Cancer Res 2015; 21: 2580–2590. [DOI] [PMC free article] [PubMed] [Google Scholar]
- 54. Zanconato F, Forcato M, Battilana G, et al. Genome‐wide association between YAP/TAZ/TEAD and AP‐1 at enhancers drives oncogenic growth. Nat Cell Biol 2015; 17: 1218–1227. [DOI] [PMC free article] [PubMed] [Google Scholar]
- 55. Gill MK, Christova T, Zhang YY, et al. A feed forward loop enforces YAP/TAZ signaling during tumorigenesis. Nat Commun 2018; 9: 3510. [DOI] [PMC free article] [PubMed] [Google Scholar]
- 56. Chan KS, Espinosa I, Chao M, et al. Identification, molecular characterization, clinical prognosis, and therapeutic targeting of human bladder tumor‐initiating cells. Proc Natl Acad Sci U S A 2009; 106: 14016–14021. [DOI] [PMC free article] [PubMed] [Google Scholar]
- 57. Yang Z, He L, Lin K, et al. The KMT1A‐GATA3‐STAT3 circuit is a novel self‐renewal signaling of human bladder cancer stem cells. Clin Cancer Res 2017; 23: 6673–6685. [DOI] [PubMed] [Google Scholar]
- 58. Song S, Ajani JA, Honjo S, et al. Hippo coactivator YAP1 upregulates SOX9 and endows esophageal cancer cells with stem‐like properties. Cancer Res 2014; 74: 4170–4182. [DOI] [PMC free article] [PubMed] [Google Scholar]
- 59. Takahashi K, Tanabe K, Ohnuki M, et al. Induction of pluripotent stem cells from adult human fibroblasts by defined factors. Cell 2007; 131: 861–872. [DOI] [PubMed] [Google Scholar]
- 60. Imajo M, Ebisuya M, Nishida E. Dual role of YAP and TAZ in renewal of the intestinal epithelium. Nat Cell Biol 2015; 17: 7–19. [DOI] [PubMed] [Google Scholar]
- 61. Miao J, Hsu PC, Yang YL, et al. YAP regulates PD‐L1 expression in human NSCLC cells. Oncotarget 2017; 8: 114576–114587. [DOI] [PMC free article] [PubMed] [Google Scholar]
- 62. Hsu PC, Yang CT, Jablons DM, et al. The role of yes‐associated protein (YAP) in regulating programmed death‐ligand 1 (PD‐L1) in thoracic cancer. Biomedicine 2018; 6: 114. [DOI] [PMC free article] [PubMed] [Google Scholar]
- 63. Janse van Rensburg HJ, Azad T, Ling M, et al. The Hippo pathway component TAZ promotes immune evasion in human cancer through PD‐L1. Cancer Res 2018; 78: 1457–1470. [DOI] [PubMed] [Google Scholar]
- 64. Safari E, Ghorghanlu S, Ahmadi‐Khiavi H, et al. Myeloid‐derived suppressor cells and tumor: current knowledge and future perspectives. J Cell Physiol 2019; 234: 9966–9981. [DOI] [PubMed] [Google Scholar]
- 65. Hu X, Zhai Y, Kong P, et al. FAT1 prevents epithelial mesenchymal transition (EMT) via MAPK/ERK signaling pathway in esophageal squamous cell cancer. Cancer Lett 2017; 397: 83–93. [DOI] [PubMed] [Google Scholar]
- 66. Necchi A, Madison R, Raggi D, et al. Comprehensive assessment of immuno‐oncology biomarkers in adenocarcinoma, urothelial carcinoma, and squamous‐cell carcinoma of the bladder. Eur Urol 2020; 77: 548–556. [DOI] [PubMed] [Google Scholar]
- 67. Gao YB, Chen ZL, Li JG, et al. Genetic landscape of esophageal squamous cell carcinoma. Nat Genet 2014; 46: 1097–1102. [DOI] [PubMed] [Google Scholar]
- 68. Schmitt K, Molfenter B, Laureano NK, et al. Somatic mutations and promotor methylation of the ryanodine receptor 2 is a common event in the pathogenesis of head and neck cancer. Int J Cancer 2019; 145: 3299–3310. [DOI] [PubMed] [Google Scholar]
- 69. Cimas FJ, Manzano A, Baliu‐Piqué M, et al. Genomic mapping identifies mutations in RYR2 and AHNAK as associated with favorable outcome in basal‐like breast tumors expressing PD1/PD‐L1. Cancers (Basel) 2020; 12: 2243. [DOI] [PMC free article] [PubMed] [Google Scholar]
- 70. Chang D, Shain AH. The landscape of driver mutations in cutaneous squamous cell carcinoma. NPJ Genom Med 2021; 6: 61. [DOI] [PMC free article] [PubMed] [Google Scholar]
- 71. Li X, Hu Y. Attribution of NF‐kappaB activity to CHUK/IKKalpha‐involved carcinogenesis. Cancers (Basel) 2021; 13: 1411. [DOI] [PMC free article] [PubMed] [Google Scholar]
- 72. Warrick JI, Walter V, Yamashita H, et al. FOXA1, GATA3 and PPAR cooperate to drive luminal subtype in bladder cancer: a molecular analysis of established human cell lines. Sci Rep 2016; 6: 38531. [DOI] [PMC free article] [PubMed] [Google Scholar]
- 73. Tseng H, Green H. Association of basonuclin with ability of keratinocytes to multiply and with absence of terminal differentiation. J Cell Biol 1994; 126: 495–506. [DOI] [PMC free article] [PubMed] [Google Scholar]
- 74. Matheny KE, Barbieri CE, Sniezek JC, et al. Inhibition of epidermal growth factor receptor signaling decreases p63 expression in head and neck squamous carcinoma cells. Laryngoscope 2003; 113: 936–939. [DOI] [PubMed] [Google Scholar]
- 75. Cordani N, Pozzi S, Martynova E, et al. Mutant p53 subverts p63 control over KLF4 expression in keratinocytes. Oncogene 2011; 30: 922–932. [DOI] [PubMed] [Google Scholar]
- 76. Abrigo M, Alvarez R, Paparella ML, et al. Impairing squamous differentiation by Klf4 deletion is sufficient to initiate tongue carcinoma development upon K‐Ras activation in mice. Carcinogenesis 2014; 35: 662–669. [DOI] [PubMed] [Google Scholar]
- 77. Li XM, Kim SJ, Hong DK, et al. KLF4 suppresses the tumor activity of cutaneous squamous cell carcinoma (SCC) cells via the regulation of SMAD signaling and SOX2 expression. Biochem Biophys Res Commun 2019; 516: 1110–1115. [DOI] [PubMed] [Google Scholar]
- 78. Senft AD, Macfarlan TS. Transposable elements shape the evolution of mammalian development. Nat Rev Genet 2021; 22: 691–711. [DOI] [PubMed] [Google Scholar]
- 79. Ito J, Kimura I, Soper A, et al. Endogenous retroviruses drive KRAB zinc‐finger protein family expression for tumor suppression. Sci Adv 2020; 6: eabc3020. [DOI] [PMC free article] [PubMed] [Google Scholar]
- 80. Ecco G, Imbeault M, Trono D. KRAB zinc finger proteins. Development 2017; 144: 2719–2729. [DOI] [PMC free article] [PubMed] [Google Scholar]
- 81. Chen W, Schwalie PC, Pankevich EV, et al. ZFP30 promotes adipogenesis through the KAP1‐mediated activation of a retrotransposon‐derived Pparg2 enhancer. Nat Commun 2019; 10: 1809. [DOI] [PMC free article] [PubMed] [Google Scholar]
- 82. Zhang C, Xiang T, Li S, et al. The novel 19q13 KRAB zinc‐finger tumour suppressor ZNF382 is frequently methylated in oesophageal squamous cell carcinoma and antagonises Wnt/beta‐catenin signalling. Cell Death Dis 2018; 9: 573. [DOI] [PMC free article] [PubMed] [Google Scholar]
- 83. Sun R, Xiang T, Tang J, et al. 19q13 KRAB zinc‐finger protein ZNF471 activates MAPK10/JNK3 signaling but is frequently silenced by promoter CpG methylation in esophageal cancer. Theranostics 2020; 10: 2243–2259. [DOI] [PMC free article] [PubMed] [Google Scholar]
- 84. Hazawa M, Lin DC, Handral H, et al. ZNF750 is a lineage‐specific tumour suppressor in squamous cell carcinoma. Oncogene 2017; 36: 2243–2254. [DOI] [PMC free article] [PubMed] [Google Scholar]
- 85. Gordetsky JB, Montgomery KW, Giannico GA, et al. The significance of squamous histology on clinical outcomes and PD‐L1 expression in bladder cancer. Int J Surg Pathol 2022; 30: 6–14. [DOI] [PubMed] [Google Scholar]
- 86. Kim B, Lee C, Kim YA, et al. PD‐L1 expression in muscle‐invasive urinary bladder urothelial carcinoma according to basal/squamous‐like phenotype. Front Oncol 2020; 10: 527385. [DOI] [PMC free article] [PubMed] [Google Scholar]
- 87. Gulinac M, Dikov D, Velikova T, et al. Increased PD‐L1 expression in high‐grade bladder cancer with squamous cell differentiation in Bulgarian and French patients' samples. Ann Diagn Pathol 2020; 49: 151640. [DOI] [PubMed] [Google Scholar]
- 88. Morsch R, Rose M, Maurer A, et al. Therapeutic implications of PD‐L1 expression in bladder cancer with squamous differentiation. BMC Cancer 2020; 20: 230. [DOI] [PMC free article] [PubMed] [Google Scholar]
- 89. Rebouissou S, Bernard‐Pierrot I, de Reyniès A, et al. EGFR as a potential therapeutic target for a subset of muscle‐invasive bladder cancers presenting a basal‐like phenotype. Sci Transl Med 2014; 6: 244ra291. [DOI] [PubMed] [Google Scholar]
- 90. Rose M, Maurer A, Wirtz J, et al. EGFR activity addiction facilitates anti‐ERBB based combination treatment of squamous bladder cancer. Oncogene 2020; 39: 6856–6870. [DOI] [PMC free article] [PubMed] [Google Scholar]
- 91. Geethadevi A, Nair A, Parashar D, et al. Oncostatin M receptor‐targeted antibodies suppress STAT3 signaling and inhibit ovarian cancer growth. Cancer Res 2021; 81: 5336–5352. [DOI] [PMC free article] [PubMed] [Google Scholar]
- 92. Cheng H, Zhang Z, Rodriguez‐Barrueco R, et al. Functional genomics screen identifies YAP1 as a key determinant to enhance treatment sensitivity in lung cancer cells. Oncotarget 2016; 7: 28976–28988. [DOI] [PMC free article] [PubMed] [Google Scholar]
- 93. Hsu PC, Miao J, Wang YC, et al. Inhibition of yes‐associated protein down‐regulates PD‐L1 (CD274) expression in human malignant pleural mesothelioma. J Cell Mol Med 2018; 22: 3139–3148. [DOI] [PMC free article] [PubMed] [Google Scholar]
- 94. Zeng R, Dong J. The Hippo signaling pathway in drug resistance in cancer. Cancers (Basel) 2021; 13: 318. [DOI] [PMC free article] [PubMed] [Google Scholar]
- 95. Lee BS, Park DI, Lee DH, et al. Hippo effector YAP directly regulates the expression of PD‐L1 transcripts in EGFR‐TKI‐resistant lung adenocarcinoma. Biochem Biophys Res Commun 2017; 491: 493–499. [DOI] [PubMed] [Google Scholar]
- 96. Ciamporcero E, Shen H, Ramakrishnan S, et al. YAP activation protects urothelial cell carcinoma from treatment‐induced DNA damage. Oncogene 2016; 35: 1541–1553. [DOI] [PMC free article] [PubMed] [Google Scholar]
- 97. Lee TF, Tseng YC, Chang WC, et al. YAP1 is essential for tumor growth and is a potential therapeutic target for EGFR‐dependent lung adenocarcinomas. Oncotarget 2017; 8: 89539–89551. [DOI] [PMC free article] [PubMed] [Google Scholar]
- 98. Tung JN, Lin PL, Wang YC, et al. PD‐L1 confers resistance to EGFR mutation‐independent tyrosine kinase inhibitors in non‐small cell lung cancer via upregulation of YAP1 expression. Oncotarget 2018; 9: 4637–4646. [DOI] [PMC free article] [PubMed] [Google Scholar]
- 99. WHO . Histological Typing of Urinary Bladder Tumours. International Histological Classification of Tumours, Volume 10. Springer: Berlin, 1973. [Google Scholar]
- 100. Mills RE, Luttig CT, Larkins CE, et al. An initial map of insertion and deletion (INDEL) variation in the human genome. Genome Res 2006; 16: 1182–1190. [DOI] [PMC free article] [PubMed] [Google Scholar]
- 101. Bergmann EA, Chen BJ, Arora K, et al. Conpair: concordance and contamination estimator for matched tumor‐normal pairs. Bioinformatics 2016; 32: 3196–3198. [DOI] [PMC free article] [PubMed] [Google Scholar]
- 102. Benjamin D, Sato T, Cibulskis K, et al. Calling somatic SNVs and indels with Mutect2. bioRxiv 2019. 10.1101/861054 [Not peer reviewed]. [DOI] [Google Scholar]
- 103. Fan Y, Xi L, Hughes DS, et al. MuSE: accounting for tumor heterogeneity using a sample‐specific error model improves sensitivity and specificity in mutation calling from sequencing data. Genome Biol 2016; 17: 178. [DOI] [PMC free article] [PubMed] [Google Scholar]
- 104. Shiraishi Y, Sato Y, Chiba K, et al. An empirical Bayesian framework for somatic mutation detection from cancer genome sequencing data. Nucleic Acids Res 2013; 41: e89. [DOI] [PMC free article] [PubMed] [Google Scholar]
- 105. Koboldt DC, Zhang Q, Larson DE, et al. VarScan 2: somatic mutation and copy number alteration discovery in cancer by exome sequencing. Genome Res 2012; 22: 568–576. [DOI] [PMC free article] [PubMed] [Google Scholar]
- 106. Kim S, Scheffler K, Halpern AL, et al. Strelka2: fast and accurate calling of germline and somatic variants. Nat Methods 2018; 15: 591–594. [DOI] [PubMed] [Google Scholar]
- 107. Alexandrov LB, Nik‐Zainal S, Wedge DC, et al. Deciphering signatures of mutational processes operative in human cancer. Cell Rep 2013; 3: 246–259. [DOI] [PMC free article] [PubMed] [Google Scholar]
- 108. Blokzijl F, Janssen R, van Boxtel R, et al. MutationalPatterns: comprehensive genome‐wide analysis of mutational processes. Genome Med 2018; 10: 33. [DOI] [PMC free article] [PubMed] [Google Scholar]
- 109. Gartner JJ, Davis S, Wei X, et al. Comparative exome sequencing of metastatic lesions provides insights into the mutational progression of melanoma. BMC Genomics 2012; 13: 505. [DOI] [PMC free article] [PubMed] [Google Scholar]
Associated Data
This section collects any data citations, data availability statements, or supplementary materials included in this article.
Supplementary Materials
Supplementary materials and methods
Figure S1. Mutational signature of bladder SCC
Figure S2. Comparison of mutation frequencies in samples with SD and those without in the TCGA study of MIBC
Figure S3. Copy number alterations in 9p
Figure S4. Gene Set Enrichment Analysis results depicting differential expression of Hallmark gene sets between pure bladder SCC and non‐squamous muscle‐invasive tumours
Figure S5. Heatmaps showing z‐scores for selected GO biological process categories and Wnt/β‐catenin signalling genes in pure SCC and MIBC without SD
Figure S6. Differential expression of key gene sets in samples with SD and those without (non‐SD) in the TCGA study of MIBC
Figure S7. Gene Set Enrichment Analysis results depicting differential expression of Hallmark gene sets in samples with SD and those without (non‐SD) in the TCGA study of MIBC
Figure S8. Heatmaps (z‐scores) and boxplots (log2 mRNA levels) depicting differential expression of EGFR and EGFR ligands
Figure S9. Heatmap showing z‐scores for transcriptional regulators in pure SCC samples, samples with SD, basal squamous tumours with no SD recorded (other basal), and all other subtypes in the TCGA study of MIBC
Figure S10. Heatmap showing z‐scores for Wnt/β‐catenin signalling genes
Figure S11. Differential expression of selected genes implicated in YAP/TAZ‐mediated stemness and modulation of the immune response in pure SCC and MIBC without SD (non‐SD)
Figure S12. Differential expression of selected genes implicated in YAP/TAZ‐mediated stemness and modulation of the immune response in samples with SD and those without (non‐SD) in the TCGA study of MIBC
Table S1. Details of patients, samples, and analysis platforms
Table S2. Summary of copy number alterations per sample and significant regions of copy number alteration identified in >25% of samples
Table S3. Focal high‐level copy number gains and regions of focal copy number loss
Table S4. Genes with significant correlation between copy number and expression level
Table S5. Genes significantly differentially expressed between sample groups and functional categories enriched in each of the groups
Table S6. Transcription factors differentially expressed between pure SCC and non‐SD MIBC
Data Availability Statement
Microarray data are available at the Gene Expression Omnibus under accession number GSE186691. Raw sequencing data are available at The European Genome‐phenome Archive (EGA), accession number EGAS00001005960.