

Abstract
Background
Intensive care unit (ICU)‐acquired weakness is characterized by muscle atrophy and impaired contractility that may persist after ICU discharge. Dysregulated muscle repair and regeneration gene co‐expression networks are present in critical illness survivors with persistent muscle wasting and weakness. We aimed to identify microRNAs (miRs) regulating the gene networks and determine their role in the self‐renewal of muscle in ICU survivors.
Methods
Muscle whole‐transcriptome expression was assessed with microarrays in banked quadriceps biopsies obtained at 7 days and 6 months post‐ICU discharge from critically ill patients (n = 15) in the RECOVER programme and healthy individuals (n = 8). We conducted an integrated miR–messenger RNA analysis to identify miR/gene pairs associated with muscle recovery post‐critical illness and evaluated their impact on myoblast proliferation and differentiation in human AB1167 and murine C2C12 cell lines in vitro. Select target genes were validated with quantitative PCR.
Results
Twenty‐two miRs were predicted to regulate the Day 7 post‐ICU muscle transcriptome vs. controls. Thirty per cent of all differentially expressed genes shared a 3'UTR regulatory sequence for miR‐424‐3p/5p, which was 10‐fold down‐regulated in patients (P < 0.001) and correlated with quadriceps size (R = 0.86, P < 0.001), strength (R = 0.75, P = 0.007), and physical function (Functional Independence Measures motor subscore, R = 0.92, P < 0.001) suggesting its potential role as a master regulator of early recovery of muscle mass and strength following ICU discharge. Network analysis demonstrated enrichment for cellular respiration and muscle fate commitment/development related genes. At 6 months post‐ICU discharge, a 14‐miR expression signature, including miRs‐490‐3p and ‐744‐5p, identified patients with muscle mass recovery vs. those with sustained atrophy. Constitutive overexpression of the novel miR‐490‐3p significantly inhibited AB1167 and C2C12 myoblast proliferation (cell count AB1167 miR‐490‐3p mimic or scrambled‐miR transfected myoblasts 7926 ± 4060 vs. 14 159 ± 3515 respectively, P = 0.006; proportion Ki67‐positive nuclei AB1167 miR‐490‐3p mimic or scrambled‐miR transfected myoblasts 0.38 ± 0.07 vs. 0.54 ± 0.06 respectively, P < 0.001; proliferating cell nuclear antigen expression AB1167 miR‐490‐3p mimic or scrambled‐miR transfected myoblasts 11.48 ± 1.97 vs. 16.75 ± 1.19 respectively, P = 0.040). Constitutive overexpression of miR‐744‐5p, a known regulator of myogenesis, significantly inhibited AB1167 and C2C12 myoblast differentiation (fusion index AB1167 miR‐744‐5p mimic or scrambled‐miR transfected myoblasts 8.31 ± 7.00% vs. 40.29 ± 9.37% respectively, P < 0.001; myosin heavy chain expression miR‐744‐5p mimic or scrambled‐miR transfected myoblasts 0.92 ± 0.39 vs. 13.53 ± 5.5 respectively, P = 0.01).
Conclusions
Combined functional transcriptomics identified 36 miRs including miRs‐424‐3p/5p, ‐490‐3p, and ‐744‐5p as potential regulators of gene networks associated with recovery of muscle mass and strength following critical illness. MiR‐490‐3p is identified as a novel regulator of myogenesis.
Keywords: ICU‐acquired weakness, Microarray, Gene network analysis, Muscle weakness, Muscle atrophy, Muscle regeneration
Introduction
Intensive care unit‐acquired weakness (ICUAW) develops secondary to mixed combinations of peripheral nerve dysfunction, rapid skeletal muscle proteolysis, decreased muscle protein synthesis, and impaired contractility. It is associated with prolonged mechanical ventilation, longer hospital stays, increased mortality, and major physical functional impairment. 1 , 2
Muscle recovery and repair are heterogeneous. While some patients exhibit sustained weakness with permanent disability, others achieve functional recovery within 6 months (6M) post‐ICU discharge, before plateauing at 1 year. 2 , 3 , 4 This time period is thus critical to the institution of impactful interventions. Therapeutic approaches currently focus primarily on modulating known ICUAW risk factors, such as prolonged inactivity and hyperglycaemia, with early mobility and intensive insulin therapy. Early mobility has positive effects on short‐term outcomes, but efficacy in the long term remains unproven. 5 Intensive insulin therapy reduces the duration of mechanical ventilation but poses a significant hypoglycaemic risk. No treatment universally averts or corrects ICUAW. 5
We previously reported on the mechanistic processes underscoring sustained muscle weakness in mechanically ventilated critically ill patients by serially assessing their physical functional capacity, strength, and quadriceps size and performing vastus lateralis biopsies for molecular analyses over a 6M period after ICU discharge. 3 , 6 Persistent weakness resulted variably from sustained muscle wasting and/or impaired contractility. Patients with sustained muscle atrophy had a decreased muscle progenitor (satellite) cell content. 3 We profiled muscle RNA content and identified groups of co‐expressed genes (modules) that were differentially regulated between healthy individuals and ICUAW patients, termed ICUAW‐relevant modules. 6 These modules were highly correlated with measures of muscle mass, strength, and/or physical function and contained genes known to regulate skeletal muscle regeneration. Collectively, these findings suggested a link between persistent muscle atrophy and impairment of muscle regeneration in individuals with sustained ICUAW at 6M after ICU discharge. 3 , 6
Here, we advance discovery using microRNA (miR) profiling to identify novel regulator(s) of human myogenesis that may play a role in muscle wasting and weakness in survivors of ICU care. MiRs are single‐stranded RNAs (18‐25 nucleotides) that bind to and impact messenger RNA (mRNA) stability, inducing mRNA degradation and altering transcription. Although small, miRs are potent effectors of gene expression where a single aberrant miR can regulate entire gene networks, thereby substantially contributing to disease development and progression (e.g. cancer). 7 , 8 Moreover, miR‐based therapies are now emerging as promising innovative treatment strategies for disease. 9 , 10 , 11 In skeletal muscle, nine miRs (miR‐1,‐133a/b, ‐486, ‐499a/b, ‐206, and ‐208a/b) are key regulators of myogenesis, well known to impact myoblast proliferation and differentiation. 12
We hypothesized that alterations in miR expression mediate aberrant expression of muscle regenerative genes post‐ICU discharge, inducing sustained muscle wasting and weakness vs recovery in critical illness survivors. To test this hypothesis, we performed paired miR and mRNA expression analysis of banked muscle biopsy samples obtained at 7 days (7D) and 6M post‐ICU discharge from patients with and without sustained ICUAW and from healthy individuals. We adapted a previously published computational approach 13 to identify gene expression modules that contained mRNAs that shared binding sequences for differentially expressed miRs, and then selected specific miRs for further in vitro analysis based on their functional relevance as indicated by the degree of association with features of ICUAW (decreased muscle mass or strength, or impaired physical function). Top miRs predicted to regulate muscle atrophy and weakness associated gene expression networks in critical illness survivors were termed master miR‐regulators. Gain and loss of function experiments in muscle cells were used to demonstrate a causal relationship between selected master miR‐regulators and myogenesis in vitro. Importantly, such miRs might serve as therapeutic targets or agents themselves for ICUAW.
Materials and methods
Detailed material and methods are presented in the supporting information.
Patient population
The study population has been previously described. 3 , 6 Briefly, patients were prospectively recruited to this nested study (n = 27, Supporting Information, Figure S1 ) at St Michael’s Hospital (SMH) and the University Health Network (UHN), Toronto, Canada from the RECOVER programme, a Canadian multicenter longitudinal study evaluating 1 year physical functional outcomes in critically ill patients undergoing prolonged (≥1 week) mechanical ventilation. 4 All patients had full physical functional capacity and were ambulatory without an aid prior to their critical illness. Vastus lateralis biopsies, skeletal muscle electrophysiologic studies (electromyography & nerve conduction studies), and clinical measures of muscle mass, strength, and physical function (Functional Independence Measures score, Medical Research Council sum score, quadriceps isometric peak torque, and computed tomography‐determined quadriceps cross‐sectional area) were obtained serially at 7D and 6M post‐ICU discharge. 3 Fifteen and eleven patients completed the 7D and 6M post‐ICU analyses, respectively. Demographics, pre‐morbid status, severity, and duration of critical illness of patients completing the study [median age 53 years, interquartile range (IQR) 40–62; 47% female patients; median mechanical ventilation duration 14 days (IQR 10–29); median hospital length of stay 38 days (IQR 27–58); comorbidities (Charlson Index median score 1, IQR 0–1); critical illness severity (APACHE II median score 22; IQR 14–30)] were not different from patients who were lost to follow up, died, or withdrew and were representative of the larger RECOVER patient cohort (n = 103) at SMH and UHN. 3
Adequate RNA was available from fourteen 7D and eight 6M muscle biopsies for total RNA (miR and mRNA) profiling. Banked muscle biopsy specimens from healthy, non‐sedentary individuals (n = 8, median age 43, 50% male patients) were used for comparator purposes and previously reported. 3 Written informed consent was obtained from all participants or their surrogate decision makers, and participants were re‐consented when capacity was regained. The study protocol was approved by the UHN and SMH Research Ethics Boards
MicroRNA and messenger RNA profiling
MicroRNAs were profiled using miRCURY LNA miR Arrays (Exiqon, 7th generation). mRNA was profiled using IlluminaHT‐12 V4 arrays as published. 6 Electronic data have been deposited (Gene Expression Omnibus: GSE78929).
Master miR‐regulator analysis
Here, we adapted and modified the Master MiR‐regulator analysis, a previously published protocol (R code available at http://eda.polito.it/MMRA) 13 that combines statistical tests, target prediction, and unsupervised network analysis to identify miRs predicted to best ‘drive’ the differential expression of target genes in disease‐specific cohorts or study subgroups. Figure 1 shows a schematic of our analysis approach. In Step 1, we identified miRs and mRNAs that were differentially expressed over time (7D and 6M post‐ICU discharge) between patient and healthy individual subgroups. In Step 2, we used miR‐target enrichment analysis to identify those miRs whose known (experimentally proven and published) or predicted (based on binding sequence complementarity) mRNA targets were over‐represented (‘enriched’) in the genes differentially expressed between subgroups. In Step 3, we used the miR:mRNA pairs to (A) build a miR:mRNA regulatory network and then (B) performed a functional enrichment analysis to identify those miRs whose network target genes were over‐represented in the differentially expressed gene lists for each subgroup comparison and our previously reported ICUAW‐relevant modules. 6 In Step 4, stepwise linear regression was used to filter out weak miR/gene relationships, so that only the most statistical co‐regulatory miR:mRNA relationships were retained. We then determined the association between each network with measured clinical features of muscle status (i.e. muscle mass, strength, or/and physical function). The final output of the analysis delineates the gene sets differentially expressed in each ICUAW subgroup, which are robustly associated with the network miRs. The relative contribution of a miR to the regulation of each ICUAW subgroup gene signature was defined as the percentage of the differentially expressed genes in each subgroup predicted to be a target of that miR. Statistical cut‐offs were defined for each step, and miRs satisfying all thresholds were deemed putative master miR‐regulators. Detailed methods and statistical analyses for each step are described in the supporting information.
Figure 1.
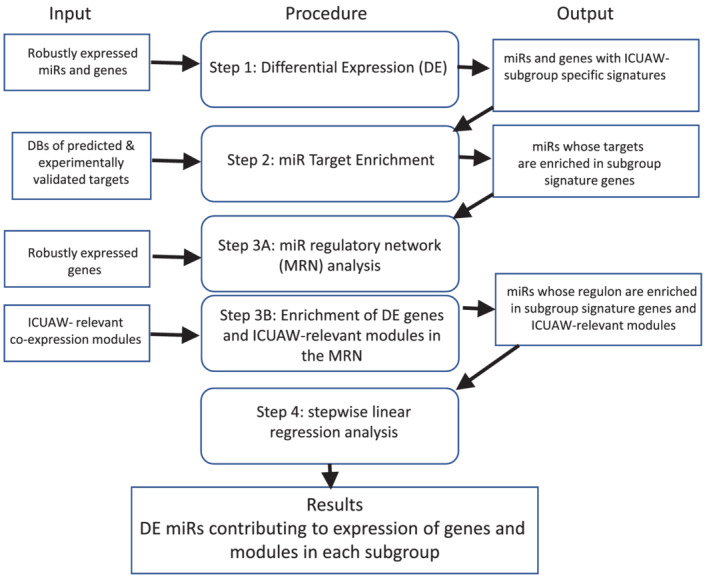
Workflow of master MiR‐regulator analysis (MMRA) pipeline 13 adapted based on this study's research objectives. The figure indicates the procedure performed in each of the four analytic steps (middle panels) using data required as initial input (left panels) and/or the outputs of preceding analytic steps (right panels). DBs, databases; DE, differential expression; ICUAW, ICU‐acquired weakness; MiR, microRNA; MRN, miR regulatory network.
Functional validation of in silico predictions with muscle cell culture
Impact of select master miR‐regulators on myoblast proliferation and differentiation was determined in murine C2C12 14 and/or human AB1167 skeletal muscle (generated by A. Bigot Sorbonne University, France) cell lines in vitro. Endogenous miR expression was determined using (TaqMan) qPCR (Applied Biosystems, ThermoFisher Scientific). For gain‐of‐function and loss‐of‐function experiments, myoblasts were transfected with either miR mimics or inhibitors (mirVana™, ThermoFisher Scientific), respectively, and scrambled miRs as negative controls. Proliferation assays (determination of ki67 nuclear localization, cell count, & proliferating cell nuclear antigen expression) and differentiation assays (determination of fusion index & myosin heavy chain expression) were performed at serial time points post‐myoblast plating as detailed in the supporting information. A minimum of three replicates per experimental condition and four repeated experiments per assay were performed. Statistical analyses for cell culture experiments were undertaken using two‐way analysis of variance with repeated measures. Statistical significance was assumed if P < 0.05.
Differential expression of miR‐specific putative gene targets following miR transfection was determined using nCounter Gene Expression System and Advanced Analysis Module (Nanostring Technologies) for C2C12 cells or relative quantitative RT‐PCR (Applied Biosystems) for C2C12 and AB1167 cells.
Results
Identification of putative master miR‐regulators
We analysed 30 vastus lateralis muscle samples from 14 patients at 7D and 8 follow‐up biopsies at 6M post‐ICU discharge, and 8 healthy individuals. In Step 1, linear models in limma were used to identify differentially expressed miRs and mRNAs adjusting for age, sex, and correlation within samples from the same individual. 15 A total of 55 miRs and 3 miRs were differentially expressed at 7D and 6M post‐ICU discharge respectively, compared with healthy individuals (false discovery rate < 5%, fold change > 1.5; Table S1a,S1b). Differentially expressed genes are shown in Table S1d,S1e.
Unsupervised hierarchical clustering showed miR expression profiles from patients 7D post‐ICU discharge clustered together, separately from healthy individuals and independent of age, sex, severity of critical illness, and pre‐morbid status (Figure 2A). By 6M post‐ICU discharge however, clustering of patient miR expression profiles was no longer evident. We speculated that this variability in miR regulation reflected heterogeneity in long‐term (6M) muscle outcomes in critical illness survivors. Indeed, we previously reported that a subset of patients (n = 3, deemed ‘improvers’ here) normalized their quadriceps cross‐sectional area relative to age‐matched and sex‐matched population‐based norms with a significant increase is muscle size (>10 cm2) at 6M post‐ICU discharge, while the rest of the patients did not, experiencing sustained quadriceps wasting (n = 5, ‘non‐improvers’). 3 , 6 MiRs were expected to be differentially regulated between improvers and non‐improvers. Accordingly, 50 differentially expressed miRs at 6M post‐ICU distinctly separate improvers from non‐improvers (Figure 2B, Table S1c, gene targets Table S1f), suggesting an association between the degree of muscle mass recovery and miR expression.
Figure 2.
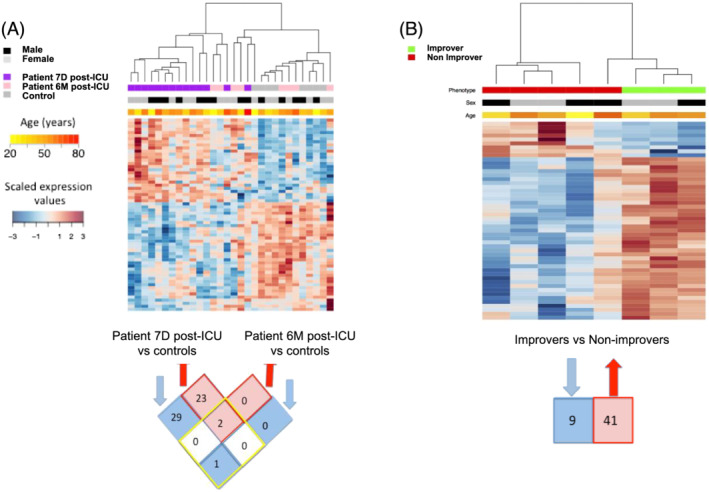
Expression patterns of quadriceps differentially expressed (DE) miRs in survivors of ICU care. (A) Heatmap of 55 miRs DE in quadriceps biopsies between patients at Day 7 (n = 14, 7D) and Month 6 (n = 8, 6M) post‐ICU discharge vs. healthy individuals (n = 8, controls). The top bars indicate study subgroup, age, and sex (values are colour coded according to respective legends to the left of the heat map). Below heatmap is a Venn diagram of DE miRs in Patient 7D (left) and Patient 6M (right) post‐ICU vs. controls. Number of overlapping genes shared between 7D and 6M are shown within the four squares within the yellow diamond. Number of probes exclusively DE in 7D (left) or 6M (right) post‐ICU are shown in the four squares outside the yellow diamond. (B) Heatmap of 50 miRs DE between patient ‘improvers’ and ‘non‐improvers' at Month 6 post‐ICU. The top bar indicates subgroups (red, non‐improvers and green, improvers). Number of down‐regulated and up‐regulated probes are shown below heatmap. Forty‐one miRs were up‐regulated in the improvers vs. non‐improvers, and nine were down‐regulated [Differential expression was assessed at false positive discovery rate (FDR) < 0.05 and fold change > 1.5. Scaled expression values are colour coded according to the legend to the far left of the heat maps].
We then used miR‐target enrichment analysis (Step 2) to determine that 25 of the 55 miRs had mRNA targets over‐represented in the differentially expressed gene signatures at 7D post‐ICU vs. control, 2 of the 3 miRs were enriched for targets at 6M post‐ICU vs. control, and 37 of the 50 miRs were enriched for targets in improvers vs. non‐improvers (Table S2).
For each miR and its corresponding set of differentially expressed genes, a network composed of a single‐hub miR‐regulated gene targets was constructed using Algorithm for the Reconstruction of Accurate Cellular Networks, 16 which computationally assists in delineating direct transcriptional interactions. The complete set of genes putatively regulated by a miR is termed its ‘regulon’. 17 The number of miR‐target interactions in the regulons varied from 29 to 414 genes, and the mutual information values (theoretic measures of the mutual dependence between each input miR and the putative gene targets) within each network ranged between 0.3 and 0.51 (Table S3). We used the regulons to determine which miRs were most responsible for the transcriptional profile documented in each comparison between study subgroups (Step 3): 25 of the 25 miRs were enriched at 7D post‐ICU vs. healthy individuals, 0 of the 2 miRs enriched at 6M post‐ICU vs. healthy individuals, and 27 of the 37 miRs for improvers vs. non‐improvers were identified (Table S4).
MicroRNAs were further restricted using stepwise linear regression (Step 4) to determine the final master miR‐regulators. Thirty‐six miRs (Table 1) were identified, found to be significantly co‐expressed with their putative network targets (Table S5) and with significant correlation between miR expression and clinical measures (Table 1) of strength, muscle size or physical function.
Table 1.
Identification of putative ICUAW master miR‐regulators
| MiR | MiR association with ICUAW | Gene targets association with ICUAW | SLR‐estimated association (%) | Association with phenotypes, R (P)* | ICUAW modules regulated | GO terms (FDR P value) | ||
|---|---|---|---|---|---|---|---|---|
| Strength | Mass | Function | ||||||
| hsa‐mir‐424‐3p | Down in 7D | Up in 7D | 12.2 | 0.72 (1.32e‐02) | 0.68 (2.15e‐02) | 0.89 (2.12e‐04) | M1, M2, M3, M4, M17 | Response to muscle activity (1.67E‐02) |
| hsa‐mir‐424‐5p | Down in 7D | Up in 7D | 10.4 | 0.75 (7.36e‐03) | 0.86 (7.72e‐04) | 0.92 (5.66e‐05) | M1, M2, M3, M4, M7 | NA |
| hsa‐mir‐4780 | Down in 7D | Up in 7D | 10.2 | 0.75 (7.36e‐03) | 0.65 (2.99e‐02) | 0.76 (6.30e‐03) | M1, M2, M3, M4 | Cellular respiration (3.01E‐03) |
| hsa‐mir‐424‐5p | Down in 7D | Down in 7D | 7.2 | 0.75 (7.36e‐03) | 0.86 (7.72e‐04) | 0.92 (5.66e‐05) | M1, M2, M3, M4, M7 | NA |
| hsa‐mir‐3175 | Down in 7D | Up in 7D | 6.8 | 0.83 (1.57e‐03) | 0.75 (7.39e‐03) | 0.88 (3.05e‐04) | M1, M2, M3, M4 | Mitochondrial matrix (9.02E‐07) |
| hsa‐mir‐3622a‐3p | Up in 7D | Down in 7D | 6.7 | −0.65 (2.95e‐02) | −0.77 (5.34e‐03) | −0.89 (2.12e‐04) | M1, M2, M3, M4 | Mitochondrial inner membrane (2.17E‐09) |
| hsa‐mir‐600 | Up in 7D | Up in 7D | 5.8 | −0.77 (5.92e‐03) | −0.74 (9.95e‐03) | −0.78 (4.49e‐03) | M1, M3, M4, M13 | Mitochondrial matrix (1.29E‐20) |
| hsa‐mir‐3175 | Down in 7D | Down in 7D | 5.5 | 0.83 (1.57e‐03) | 0.75 (7.39e‐03) | 0.88 (3.05e‐04) | M1, M2, M3, M4 | Mitochondrial matrix (9.02E‐07) |
| hsa‐mir‐23a‐3p | Down in 7D | Up in 7D | 5.4 | 0.82 (2.13e‐03) | 0.86 (7.72e‐04) | 0.8 (3.10e‐03) | M1, M2, M3 | Muscle cell fate commitment (4.08E‐02) |
| hsa‐mir‐3136‐3p | Up in 7D | Up in 7D | 5.4 | −0.58 (5.99e‐02) | −0.56 (7.14e‐02) | −0.6 (5.09e‐02) | M1, M2, M3, M4 | Cellular respiration (6.14E‐11) |
| hsa‐mir‐206 | Down in 7D | Up in 7D | 5.3 | 0.8 (2.82e‐03) | 0.83 (1.64e‐03) | 0.81 (2.53e‐03) | M2, M11 | Actin cytoskeleton (4.81E‐02) |
| hsa‐mir‐4795‐5p | Up in 7D | Up in 7D | 4.7 | −0.72 (1.32e‐02) | −0.51 (1.08e‐01) | −0.78 (4.49e‐03) | M1, M2, M3, M4 | Cellular respiration (2.64E‐05) |
| hsa‐mir‐502‐3p | Down in 7D | Up in 7D | 4.7 | 0.75 (8.17e‐03) | 0.79 (4.11e‐03) | 0.67 (2.55e‐02) | M1, M2, M3 | Cofactor biosynthetic process (1.76E‐02) |
| hsa‐mir‐574‐3p | Up in 7D | Up in 7D | 4.6 | −0.89 (2.12e‐04) | −0.79 (3.75e‐03) | −0.75 (7.39e‐03) | M1, M2, M3, M4 | Cellular respiration (1.35E‐07) |
| hsa‐mir‐29b‐3p | Down in 7D | Up in 7D | 3.6 | 0.44 (1.79e‐01) | 0.53 (9.33e‐02) | 0.65 (2.99e‐02) | M1, M2, M3, M4, M7 | Telomere cap complex (8.75E‐04) |
| hsa‐mir‐29a‐3p | Down in 7D | Down in7D | 3.5 | 0.56 (7.08e‐02) | 0.62 (4.04e‐02) | 0.61 (4.44e‐02) | M1, M2, M3, M4, M7 | NA |
| hsa‐mir‐502‐3p | Down in 7D | Down in 7D | 3.4 | 0.75 (8.17e‐03) | 0.79 (4.11e‐03) | 0.67 (2.55e‐02) | M1, M2, M3 | Cofactor biosynthetic process (1.76E‐02) |
| hsa‐mir‐29a‐3p | Down in 7D | Up in 7D | 3.1 | 0.56 (7.08e‐02) | 0.62 (4.04e‐02) | 0.61 (4.44e‐02) | M1, M2, M3, M4, M7 | NA |
| hsa‐mir‐3133 | Up in 7D | Up in 7D | 3.1 | −0.54 (8.74e‐02) | −0.61 (4.65e‐02) | −0.5 (1.19e‐01) | M2, M4 | Cellular respiration (1.50E‐02) |
| hsa‐mir‐29b‐3p | Down in 7D | Down in 7D | 3 | 0.44 (1.79e‐01) | 0.53 (9.33e‐02) | 0.65 (2.99e‐02) | M1, M2, M3, M4, M7 | Telomere cap complex (8.75E‐04) |
| hsa‐mir‐4488 | Down in 7D | Up in 7D | 2.7 | 0.83 (1.57e‐03) | 0.91 (9.22e‐05) | 0.75 (7.39e‐03) | M1, M3, M6, M11 | Collagen‐containing extracellular matrix (1.99E‐02) |
| hsa‐mir‐663a | Down in 7D | Down in 7D | 2.7 | 0.8 (2.82e‐03) | 0.86 (7.72e‐04) | 0.8 (3.10e‐03) | M1, M2, M3 | Translational initiation (7.30E‐05) |
| hsa‐mir‐638 | Down in 7D | Down in 7D | 2.5 | 0.8 (2.82e‐03) | 0.87 (4.98e‐04) | 0.68 (2.03e‐02) | M1, M2, M3, M4 | Mitochondrial respiratory chain (8.57E‐03) |
| hsa‐mir‐4732‐3p | Up in improver | Up in improver | 2.4 | 0.76 (2.74e‐02) | 0.74 (3.75e‐02) | 0.67 (6.91e‐02) | M1 | NA |
| hsa‐mir‐4732‐3p | Up in improver | Down in improver | 2.1 | 0.76 (2.74e‐02) | 0.74 (3.75e‐02) | 0.67 (6.91e‐02) | M1 | NA |
| hsa‐mir‐5704 | Up in 7D | Up in 7D | 2 | −0.48 (1.34e‐01) | −0.32 (3.43e‐01) | −0.29 (3.90e‐01) | M1, M3, M4 | Cellular respiration (3.06E‐09) |
| hsa‐mir‐4516 | Down in 7D | Up in 7D | 1.9 | 0.8 (2.82e‐03) | 0.83 (1.46e‐03) | 0.69 (1.80e‐02) | M1, M2, M3, M4 | Cytoskeletal Adaptor activity (4.42E‐02) |
| hsa‐mir‐490‐3p | Up in improver | Up in improver | 1.9 | 0.79 (1.94e‐02) | 0.85 (7.54e‐03) | 0.77 (2.59e‐02) | NA | Spindle microtubule (1.17E‐02) |
| hsa‐mir‐551a | Up in 7D | Down in 7D | 1.7 | −0.59 (5.65e‐02) | −0.76 (6.30e‐03) | −0.68 (2.15e‐02) | M2, M4 | NA |
| hsa‐mir‐589‐5p | Down in improver | Down in improver | 1.7 | −0.74 (3.72e‐02) | −0.72 (4.27e‐02) | −0.49 (2.15e‐01) | M4, M13 | Cellular respiration (2.44E‐05) |
| hsa‐mir‐4764‐3p | Up in 7D | Down in 7D | 1.5 | −0.44 (1.72e‐01) | −0.25 (4.56e‐01) | −0.16 (6.42e‐01) | NA | Cellular respiration (8.82E‐10) |
| hsa‐mir‐4739 | Up in improver | Down in improver | 1.5 | 0.85 (8.17e‐03) | 0.88 (4.42e‐03) | 0.77 (2.59e‐02) | M1, M3, M4 | NA |
| hsa‐mir‐597 | Down in improver | Down in improver | 1.5 | −0.79 (1.94e‐02) | −0.67 (6.78e‐02) | −0.57 (1.39e‐01) | M4 | Cellular respiration (3.01E‐05) |
| hsa‐mir‐4762‐5p | Up in improver | Down in improver | 1.4 | 0.74 (3.72e‐02) | 0.6 (1.19e‐01) | 0.3 (4.77e‐01) | NA | NA |
| hsa‐mir‐490‐3p | Up in improver | Down in improver | 1.4 | 0.79 (1.94e‐02) | 0.85 (7.54e‐03) | 0.77 (2.59e‐02) | NA | Spindle microtubule (1.17E‐02) |
| hsa‐mir‐485‐3p | Up in improver | Up in improver | 1.3 | 0.08 (8.47e‐01) | −0.13 (7.65e‐01) | −0.79 (2.02e‐02) | NA | Axon cytoplasm (3.61E‐02) |
| hsa‐mir‐638 | Down in 7D | Up in 7D | 1.2 | 0.8 (2.82e‐03) | 0.87 (4.98e‐04) | 0.68 (2.03e‐02) | NA | Mitochondrial respiratory chain (8.57E‐03) |
| hsa‐mir‐205‐3p | Up in improver | Down in improver | 1.2 | 0.46 (2.47e‐01) | 0.32 (4.44e‐01) | 0.16 (7.09e‐01) | M4 | Regulation of IL‐8 secretion (3.77E‐03) |
| hsa‐mir‐4530 | Up in improver | Down in improver | 1.2 | 0.71 (4.88e‐02) | 0.49 (2.13e‐01) | 0.33 (4.17e‐01) | M1, M2, M3, M4 | Skeletal muscle organ development (1.24E‐05) |
| hsa‐mir‐744‐5p | Up in improver | Down in improver | 1.2 | 0.87 (4.66e‐03) | 0.66 (7.52e‐03) | 0.51 (1.94e‐01) | M6 | Mitochondrial ribosome (4.51E‐02) |
| hsa‐mir‐4279 | Up in improver | Down in improver | 1.1 | 0.68 (6.25e‐02) | 0.76 (2.83e‐02) | 0.59 (1.23e‐01) | NA | Myofibril (2.49E‐02) |
| hsa‐mir‐4701‐5p | Down in improver | Down in improver | 1.1 | −0.74 (3.72e‐02) | −0.72 (4.27e‐02) | −0.49 (2.15e‐01) | M4 | NA |
| hsa‐mir‐642b‐5p | Up in improver | Down in improver | 1.1 | 0.68 (6.25e‐02) | 0.76 (2.83e‐02) | 0.59 (1.23e‐01) | NA | NA |
| hsa‐mir‐3611 | Up in improver | Up in improver | 1 | 0.33 (4.29e‐01) | 0.25 (5.44e‐01) | −0.60 (8.89e‐01) | M4 | NA |
Master MiR‐regulator analysis, 13 a data‐driven analytic pipeline, was used to identify miRs that best ‘explained’ the gene signatures and ICUAW‐relevant modules we observed in patients at 7 days post‐ICU discharge (7D) vs. healthy individuals, and in patients who normalized their quadriceps cross‐sectional area compared with age‐matched and sex‐matched population‐based norms (improvers) vs. those with sustained muscle atrophy (non‐improvers) at 6 months post‐ICU discharge. The degree of regulation by a miR for each subgroup signature was defined as the percentage of differentially expressed genes (up or down) in each subgroup identified by stepwise linear regression (SLR, positive or negative coefficient). Module phenotype Spearman's correlations (R, *unadjusted P values) performed for muscle strength (based on the Medical Research Council sum score at 7 days post‐discharge, and % predicted quadriceps isometric peak torque 6 months post‐discharge), muscle mass (quadriceps cross‐sectional area), and physical function [motor subscore of the Functional Independence Measures (FIM) score]. Regulons controlled by master miR‐regulators were enriched for Gene Ontology (GO) functions (FDR‐adjusted P values). ICUAW‐relevant modules identified by gene co‐expression analysis we previously characterized to be highly correlated with clinical measures of muscle outcome post‐ICU discharge 6 were significantly enriched in at least one master miR regulon.
Twenty‐two miRs (miR‐424‐3p/5p, ‐4780, ‐3175, ‐3622a‐3p,‐600, 23a‐3p, 3136‐3p, ‐206, ‐4795‐5p, ‐502‐3p, ‐574‐3p, ‐29a/b‐3p, ‐3133, ‐4488, ‐663a, ‐638, ‐5704, ‐4516, ‐551a, and ‐4764‐3p) were identified as predicted master regulators of the Day 7 post‐ICU vs. healthy control muscle transcriptome (Table 1, Figure 3A and 3C). Notably, 30% of all differentially expressed genes shared a 3'UTR regulatory sequence for miR‐424‐3p/5p, which was 10‐fold down‐regulated in patients (Table S1a) and highly correlated with quadriceps size (R = 0.86, P < 0.001), strength (R = 0.75, P = 0.007) and physical function (R = 0.92, P < 0.001) (Table 1). Seven miRs, including miR‐424‐3p/5p, and miRs‐206, ‐29b‐3p, ‐29a‐3p, ‐23a‐3p, and ‐502‐3p were collectively identified as putative master regulators of two‐thirds of the 7D skeletal muscle transcriptome (Table 1, Figure 3C). Notably, these seven miRs are well known to modulate skeletal muscle development, regeneration, hypertrophy, and/or atrophy, and all were down‐regulated in 7D muscle, indicating a potential pro‐myogenic response. Additionally, regulons associated with master miR‐regulators at 7D were enriched for Gene Ontology functions relating to cellular respiration/mitochondrial structure or muscle fate commitment/muscle development (Table 1).
Figure 3.
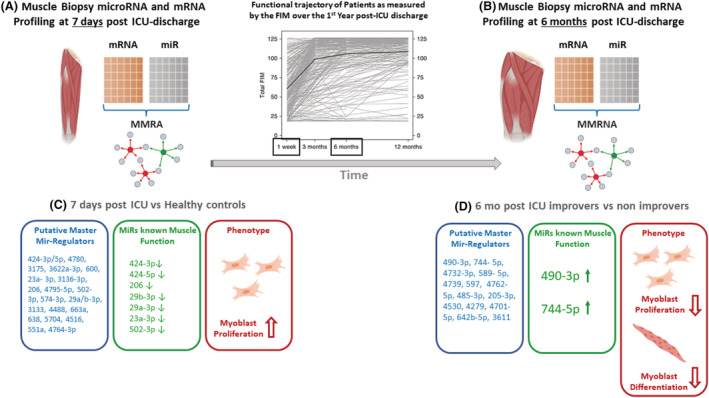
Master MiR‐regulator analysis (MMRA) identifies miRs predicted to best ‘drive’ the differential expression of putative target genes in study subgroups. Muscle biopsies from patients enrolled in the RECOVER programme 4 were used for miR and mRNA expression profiling and MMRA analysis. Graph (top middle panel) showing the functional trajectory of patients enrolled in RECOVER, as measured by the Functional Independence Measure (FIM), over the first‐year post‐ICU discharge is reproduced 4 to underscore changes in functional measures over time. MMRA analysis (miR:mRNA integration) identified 22 miRs (A,C) and 14 miRs (B,D) as putative master regulators of the Day 7 post‐ICU vs. healthy control and ‘improver’ vs. ‘non‐improver’ 6 months post‐ICU muscle transcriptome, respectively. Seven miRs down‐regulated at Day 7 (C, middle panel) are known to negatively impact myoblast proliferation or muscle hypertrophy, 29 , 30 , 31 , 32 , 33 , 34 , 35 , 36 indicating a potential pro‐myogenic phenotype in all patients immediately post‐ICU discharge. In the 6 month improver vs. non‐improver transcriptome, muscle function of the majority of miRs is unknown (D, left panel). miRs‐490‐3p and ‐744‐5p were up‐regulated in improver relative to non‐improvers (D, middle panel); in vitro gain and loss of function experiments showed miR‐490‐3p to be a negative regulator of myoblast proliferation and miR‐744‐5p to be a negative regulator of differentiation (D, right panel). Their increased expression in improvers potentially represents a normal muscle baseline and the relative decrease of miR‐490‐3p and ‐744‐5p in the non‐improvers may enable continued efforts at muscle regrowth.
At 6M post‐ICU discharge, a 14‐miR expression signature (miR‐490‐3p, ‐744‐5p, ‐4732‐3p, ‐589‐5p,‐4739, ‐597, ‐4762‐5p, ‐485‐3p, ‐205‐3p, ‐4530, ‐4279, ‐4701‐5p, ‐642b‐5p, and ‐3611) (Table 1; Figure 3B and 3D, left panel) identified critical illness survivors with recovery of quadriceps mass vs. those with sustained atrophy. MiR‐490‐3p was increased in improvers vs. non‐improvers and associated with approximately 4% of differentially expressed genes in the transcriptome. The biologic relevance of the vast majority of the 14 miRs identified as master regulators of the gene signature in improvers vs. non‐improvers, including miR‐490‐3p, is unknown.
Of the 11 ICUAW‐relevant modules we previously characterized to be highly correlated with measures of muscle mass, strength, and/or physical function post‐ICU discharge, 6 nine modules were significantly enriched in at least one master miR regulon (Tables 1 and S6).
MiRs‐490‐3p and ‐744‐5p are negative regulators of myoblast proliferation and differentiation, respectively
Because the biologic relevance in muscle of the miRs associated with the transcriptome of improvers vs. non‐improvers is unknown, we previously reported muscle satellite cell content correlates with recovery of muscle mass in ICUAW patients 3 and miRs can be developed as therapeutic agents, and we sought to determine the impact of select master miR‐regulators on muscle regeneration/myogenesis using murine C2C12 and human AB1167 skeletal muscle cell lines. We selected miRs‐490‐3p and ‐744‐5p, both increased in improvers vs. non‐improvers, as they robustly correlated with clinical measures of quadriceps size (R = 0.85, P = 0.008 and R = 0.66, P = 0.008 respectively; Table 1) and human and murine orthologues have high sequence homology enabling the use of common Taqman probes for functional genomics experiments in both species.
We found miRs‐490‐3p and ‐744‐5p expressed in proliferating myoblasts (Figure S2). MiR‐744‐5p expression remained relatively constant in differentiated myotubes, but the expression of miR 490‐3p decreased significantly with differentiation. Given both miRs were differentially expressed during myogenesis in vitro, we next performed gain and loss of function experiments, transfecting miRs‐744‐5p and ‐490‐3p mimics or inhibitors respectively into C2C12 and/or AB1167 myoblasts and assessed their impact on myoblast proliferation (determined by cell count, Ki67 nuclear localization, and proliferating cell nuclear antigen expression) and differentiation (determined by myotube fusion index and myosin heavy chain expression). We found miR‐490‐3p negatively regulates myoblast proliferation of both AB1167 and C2C12 myoblasts (Figure 3D, right panel; Figure 4A,C,D; Figures S3 to S6) but did not alter myoblast differentiation to mature myotubes in either cell line (Figures 5A–C, S7, and S8). In contrast, we found miR‐744‐5p is a negative regulator of AB1167 and C2C12 myoblast differentiation (Figures 3D [right panel], 5A–C, S7, and S8). However, its impact on proliferation was not consistent between the cell lines. MiR‐744‐5p inhibited AB1167 myoblast proliferation but had no impact on C2C12 myoblast proliferation (Figures 4B–D and S3–S6).
Figure 4.
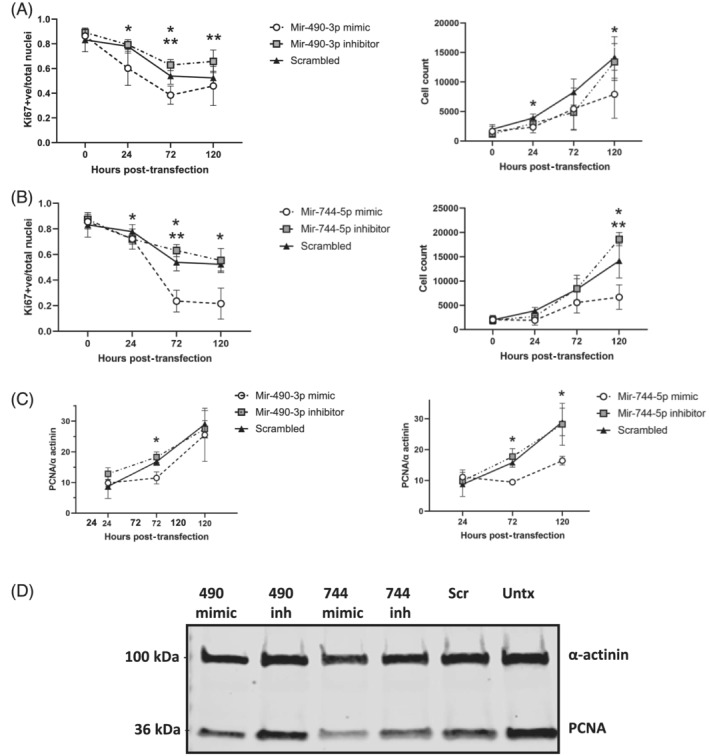
MiRs‐490‐3p and ‐744‐5p are negative regulators of AB1167 human myoblast proliferation. AB1167 proportion of Ki67 (proliferation marker) positive nuclei (left panels) and myoblast cell count (right panels) at 24, 72, and 120 h post‐transfection with (A) miR‐490‐3p mimic or inhibitor or (B) miR‐744‐5p mimic or inhibitor and a negative (scrambled) control. Representative confocal images of Ki67 immunostaining are shown in Figure S4. (C) Quantification of western blots of transfected myoblast protein lysate for proliferating cell nuclear antigen (PCNA) normalized to α‐actinin loading control. (D) Representative western blot is shown (72 h post‐transfection). MiR‐490‐3p and miR‐744‐5p mimics significantly decreased myoblast proliferation (*P < 0.05), while miR‐490‐3p and miR‐744‐5p inhibitors significantly increased myoblast proliferation (**P < 0.05), relative to scramble transfected negative control (n = 4 experiments/assay, cells plated in triplicate/experimental condition, data are mean ± SD, Scr = scrambled miR, Untx = untransfected, inh = inhibitor, 490 = miR‐490‐3p, 744 = miR‐744‐5p).
Figure 5.
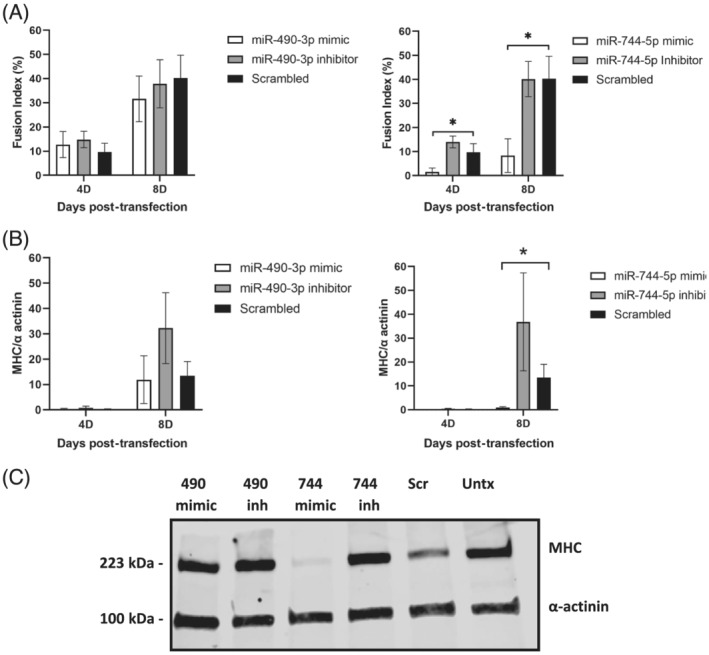
MiR‐744‐5p is a negative regulator of AB1167 human myoblast differentiation. (A) Fusion indices and (B) quantification of western blots for myosin heavy chain (MHC) normalized to α‐actinin loading control for AB1167 myoblasts transfected with miR‐490‐3p mimic or inhibitor (left panels) and miR‐744‐5p mimic or inhibitor (right panels) at 4 days (4D) and 8 days (8D) post‐transfection. (C) Representative western blot of cellular lysate 8D post‐transfection is shown. Representative confocal images of MHC immunostaining are shown in Figure S7. MiR‐744‐5p mimic inhibited differentiation as indicated by decreased fusion index and MHC expression (*p < 0.05), while miR‐744‐5p inhibition increased MHC expression (**P < 0.05). MiR‐490‐3p did not significantly impact differentiation [n = 4 experiments/assay, cells plated in triplicate/experimental condition, data are mean ± SD, fusion index = percentage of nuclei in fused myotubes (MHC positive cells with two or more nuclei) relative to the total number of nuclei, per image, Scr = scrambled miR, Untx = untransfected, inh = inhibitor, 490 = miR‐490‐3p, 744 = miR‐744‐5p].
Putative miR‐490‐3p target expression in C2C12 and AB1167 muscle cells
During preparation of this manuscript, miR‐744‐5p was reported to promote bovine myoblast proliferation and inhibit differentiation, and its cellular signalling was described. 18 We therefore focused on miR‐490‐3p as the novel regulator of myogenesis identified here. To begin to delineate the mechanism of its anti‐proliferative effect, we used (relative) qPCR and the Nanostring Skeletal Myogenesis and Myopathies Plexset pathway panel to determine the impact of miR‐490‐3p constitutive expression on AB1167 and C2C12 myoblast gene expression. Genes assessed included select putative miR‐490‐3p targets identified by the master miR‐regulator analysis, known miR‐490‐3p targets in other biologic systems, and genes well known to modulate myogenesis and present on the Plexset (Table 2).
Table 2.
MiR‐490‐3p putative target gene expression in C2C12 and AB1167 transfected myoblasts
| Cells | Method | Gene | Log2 fold change | Standard error | P value |
|---|---|---|---|---|---|
| C2C12 | Plexset 48 h | ASXL1 | −0.55 | 0.18 | 0.014 * |
| C2C12 | Plexset 48 h | Mapk‐14 | −0.39 | 0.14 | 0.024 * |
| C2C12 | Plexset 48 h | SMARCA4 | 0.44 | 0.17 | 0.028 * |
| C2C12 | Plexset 48 h | Myf5 | −0.79 | 0.31 | 0.032 * |
| C2C12 | Plexset 48 h | MyoD | −0.67 | 0.28 | 0.039 * |
| C2C12 | Plexset 48 h | Ctnnb1 | 0.33 | 0.14 | 0.040 * |
| C2C12 | Plexset 48 h | Capn3 | 0.98 | 0.27 | 0.005 * |
| C2C12 | Plexset 96 h | NCAM1 | −0.57 | 0.20 | 0.017 * |
| C2C12 | Plexset 96 h | Mef2d | −0.61 | 0.26 | 0.044 * |
| C2C12 | qRT‐PCR 48 h | CDK1 | −0.66 | 0.09 | 0.018 |
| C2C12 | qRT‐PCR 48 h | HMGA2 | 1.35 | 0.08 | 0.004 |
| C2C12 | qRT‐PCR 48 h | ANTXR1 | 0.02 | 0.17 | 0.92 |
| C2C12 | qRT‐PCR 48 h | FBX09 | 0.32 | 0.11 | 0.092 |
| C2C12 | qRT‐PCR 48 h | SAPS2 | 0.17 | 0.51 | 0.77 |
| AB1167 | qRT‐PCR 72 h | CDK1 | −1.51 | 0.40 | 0.049 |
| AB1167 | qRT‐PCR 72 h | HMGA2 | 0.06 | 1.48 | 0.972 |
| AB1167 | qRT‐PCR 72 h | Myf5 | −0.27 | 0.06 | 0.045 |
| AB1167 | qRT‐PCR 72 h | MyoD | −1.29 | 0.30 | 0.050 |
| AB1167 | qRT‐PCR 72 h | Ctnnb1 | 0.23 | 0.15 | 0.369 |
| AB1167 | qRT‐PCR 72 h | ANTXR1 | 0.66 | 0.58 | 0.371 |
| AB1167 | qRT‐PCR 72 h | Mef2d | −0.05 | 0.05 | 0.468 |
| AB1167 | qRT‐PCR 72 h | NCAM1 | 1.21 | 1.72 | 0.552 |
| AB1167 | qRT‐PCR 72 h | Capn3 | 1.03 | 0.37 | 0.050 |
| AB1167 | qRT‐PCR 8D | Mef2d | −1.02 | 0.29 | 0.017 |
| AB1167 | qRT‐PCR 8D | NCAM1 | 0.112 | 0.20 | 0.607 |
| AB1167 | qRT‐PCR 8D | MyoD | −1.77 | 0.37 | 0.005 |
mRNA was harvested from miR‐490‐3p or scrambled control transfected C2C12 myoblasts at 48 h (proliferation) and 4 days (differentiation) and AB1167 myoblasts at 72 h (proliferation) and 8 days (differentiation) post‐transfection. Gene expression in miR‐490‐3p transfected cells was determined relative to scrambled control with Nanostring nCounter technology (Skeletal Myogenesis and Myopathies Plexset pathway panel) and/or qPCR (2∆∆CT relative quantification with HPRT and GAPDH as housekeeper genes). Genes quantified by qPCR were select genes identified as putative mir‐490‐3p targets in the master miR‐regulator analysis of improvers vs non‐improvers (NCAM1, ASXL1, SMARCA4, Capn3, FBx09, ANTRX1, and SAPS2), known miR‐490‐3p targets reported in the literature in other systems (CDK1 and HMGA2), or genes expressed on the Nanostring Plexset (N = 3 to 4 experiments/assay, cells were transfected in triplicate/experimental condition; significant P value < 0.05 in bold; *P value corrected for multiple testing).
ANTRX1, anthrax toxin receptor 1; ASXL1; ASXL transcriptional regulator 1; Capn3, calpain 3; CDK1, cyclin‐dependent kinase 1; Ctnnb1, catenin beta 1; FBx09, F box protein 9; HMGA2, high mobility group A2; MAPK‐14, mitogen‐activated protein kinase 14; Mef2D, myocyte‐specific enhancer factor 2D; Myf5, myogenic factor 5; myoD1, myogenic differentiation 1; NCAM1, neural cell adhesion molecule; qRT‐PCR, real‐time quantitative PCR; SAPS2, SAPS domain family, member 2; SMARCA4, SWI/SNF‐related, matrix‐associated, actin‐dependent regulator of chromatin, subfamily a, member 4.
P value corrected for multiple testing.
We found cyclin‐dependent kinase 1 (CDK1), a known miR‐490‐3p target, 19 significantly decreased in transfected proliferating C2C12 and AB1167 myoblasts. In contrast, the expression of HMGA2 (high mobility group A2), another known miR‐490‐3p target, 20 was not altered in transfected AB1167 cells, and was increased in C2C12 myoblasts. Of the putative miR‐490‐3p targets identified in the master miR‐regulator analysis on quadriceps biopsies, Capn3 (calpain 3), ASXL1 (ASXL transcriptional regulator 1), NCAM‐1 (neural cell adhesion molecule), and SMARCA4 (SWI/SNF‐related, matrix‐associated, actin‐dependent regulator of chromatin, subfamily A, member 4) were differentially expressed in miR‐490‐3p mimic transfected C2C12 and/or AB1167 myoblasts, but FBX09 (F box protein 9), ANTRX1 (anthrax toxin receptor 1) and SAPS2 (saps domain family, member 2) expression were not impacted. Myogenic regulatory proteins Myf5 (myogenic factor 5), MyoD1 (myogenic differentiation 1), and Mef2D (myocyte‐specific enhancer factor 2D) were down‐regulated in mir‐490‐3p transfected proliferating and/or differentiating C2C12 and AB1167 myoblasts.
Discussion
We have previously shown that muscle weakness in critical illness survivors is a complex composite of defects in contractility and failure to regain muscle mass. 3 Here, we used a multi‐omics approach to exploit the canonical relationship between miRs and their putative mRNA targets to demonstrate that transcriptional regulation in muscles from individuals who recover muscle mass 6M post‐ICU discharge is distinct from those who have persistent muscle atrophy. Moreover, we delineate miR‐dependent regulons associated with long‐term ICUAW sustained 6M after ICU discharge and predicted to impact clinically relevant features of muscle cellular dysfunction such as impaired myoblast proliferation and differentiation. Our data in patients and muscle cells suggests a small number of miRs drive the pathophysiology of ICUAW vs. muscle recovery following ICU care. miR‐424‐3p/5p is predicted to account for 30% of the transcriptional changes associated with muscle wasting and weakness in survivors 7D post‐ICU discharge. Combined in silico and cell culture analyses demonstrate miRs‐490‐3p (novel) and ‐744‐5p (known) are regulators of myogenesis that potentially impact long‐term reconstitution of muscle mass following critical illness.
The master MiR‐regulator analysis strategy integrates statistics and unsupervised network theory to identify miR:mRNA regulatory networks containing a set of genes putatively regulated by a miR, termed its regulon, offering two levels of evidence in support for our findings. We found significant overlap between genes within regulons and the majority of ICUAW‐related modules, the groups of co‐expressed genes separating critical illness survivors from healthy individuals that we previously identified. 6 The majority of master miR‐regulators predicted to drive the transcriptome at 7D post‐ICU discharge targeted multiple overlapping ICUAW‐related modules. Such combinatorial regulation is characteristic of the global architecture of mammalian miR regulatory networks, 21 that is, for one miR to regulate multiple targets thereby impacting global cellular phenomena. This has important clinical relevance because miR signatures obtained from small focal muscle biopsies may be used in the future to guide further research, detect patients at risk for sustained muscle dysfunction, and/or to monitor response to therapy (e.g. exercise). Moreover, miR‐modulatory strategies (e.g. mimics and inhibitors) may be used to prevent and/or to treat acute and/or persistent muscle dysfunction. This approach is currently being investigated for the treatment of monogenic muscle disorders, and in polygenic disorders, miR‐based therapeutics are already in clinical trials. 11 , 22 , 23 , 24 While future studies will be required to determine the diagnostic and prognostic utility of miR‐regulon profiles for acute and sustained ICUAW, here we provide, despite our small sample size, robust data demonstrating a potentially causative link between entirely novel miR‐regulons and muscle cell dysfunction relevant to patients with sustained post‐ICU muscle wasting.
Concordant with our findings from ICUAW‐related modules, 6 a number of regulons contained genes involved in cellular respiration and skeletal muscle commitment/development, suggesting that the master miR‐regulators may have critical roles in bioenergy homeostasis and dysfunctional muscle regeneration. Studies have reported decreased muscle mitochondrial content, bioenergetic dysfunction and depressed ATP synthesis during critical illness, 25 , 26 , 27 and decreased mitochondrial content persists at 7D post‐ICU discharge. 3 In keeping with the premise of altered muscle bioenergy status, we found here, master miR‐regulators associated with target gene networks related to cellular respiration and mitochondrial function at 7D post‐ICU.
The seven miRs (‐424‐3p/5p, ‐206, ‐29b‐3p, ‐29a‐3p, ‐23a‐3p, and ‐502‐3p), predicted to collectively drive two‐thirds of the transcriptome at 7D post‐ICU, are well known to modulate myogenesis and muscle growth and all were down‐regulated in critical illness survivors vs. healthy individuals. The murine homologue of miR‐424 (miR‐322), miR‐206, and miR‐29 all block cell cycle progression during myogenesis and promote myoblast differentiation. 28 , 29 , 30 , 31 Loss of miR‐23a delays myoblast differentiation and maintains myoblasts with proliferative potential. 32 In the early stages of critical illness recovery (7D), wasted muscle begins mass reconstitution, albeit to varying degrees and ultimately with variable success. We suggest down‐regulation of these miRs in patients releases inhibition of cell cycle progression and allow muscle to undertake hyperplastic (regenerative) growth.
Down‐regulation of both miR‐424 and miR‐29b may also enable hypertrophic growth at 7D. MiR‐424‐5p inhibits rRNA and thus protein synthesis, it is increased in conditions associated with muscle wasting 33 and overexpression of its homologue mir‐322 induces muscle atrophy in mice (49). MiR‐29b overexpression promotes muscle atrophy while its inhibition attenuates atrophy induced by denervation and immobilization. 34 Interestingly, miR‐206 plays a complex role regulating both repression and stimulation of muscle hypertrophy. 35 , 36 Further studies will be needed to elucidate how this might regulate muscle growth in survivors with ICUAW.
While these master miR‐regulators generate a muscle growth favourable environment at 7D presumably enabling an early attempted reparative response following critical illness resolution, this is not maintained to 6M when patients have separated into non‐improvers and improvers, that is, those with persistent muscle wasting vs. those who regain and normalize muscle mass. Although miRs are mitotically and meiotically heritable, it remains unclear if failure to maintain this muscle pro‐proliferative, pro‐hypertrophic signature is heritable or a product of post‐critical illness epigenetic remodelling in muscle.
At 6M, muscle mass increase was associated with a distinct 14 master miR‐regulator signature. Although the function of the majority of these miRs in skeletal muscle remains unknown, we showed miR‐490‐3p, which was up‐regulated in improvers vs. non‐improvers, to be a novel negative regulator of myoblast proliferation and myogenesis. In malignancy, miR‐490‐3p inhibits cellular proliferation and protects against cancer progression by targeting CDK1. 19 We found miR‐490‐3p overexpression similarly decreased myoblast CDK1 transcript levels, suggesting it may be a common target by which miR‐490‐3p mediates its anti‐proliferative effects. While in osteosarcoma cells, miR‐490‐3p targets HMGA2 (high mobility group A2) to induce G1 arrest, 20 we did not observe a similar decrease in HMGA2 expression in the muscle cells.
Of the miR‐490‐3p putative target genes identified in the quadriceps biopsies by the master miR‐regulator analysis, Capn3 is interesting as it is a skeletal muscle‐specific protease mutated in limb‐girdle muscle dystrophy 2A whose deficiency enhances myoblast proliferation, 37 , 38 and it was increased in AB1167 and C2C12 myoblasts following miR‐490‐3p transfection. Capn3 also mediates repressed transcriptional activity of the myogenic regulatory factor MyoD, which is normally highly expressed in proliferating myoblasts and which was down‐regulated in miR‐490‐3p transfected myoblasts. Mir‐490‐3p overexpression similarly down‐regulated myocyte enhancer factor MEF2D. The MEF2A isoform is a positive regulator of primary myoblast proliferation in vitro, 39 although others have demonstrated the individual loss of MEF2 A, B, or D, does not impact satellite cell proliferation in vivo. 40 Myf5 is one of the most prominent myogenic regulatory factors expressed in proliferating myoblasts and was down‐regulated by miR‐490‐3p transfection. In contrast to the changes in expression levels of these aforementioned miR 490‐3p known and potential targets, all of which are in keeping with decreased myoblast proliferation, miR‐490‐3p overexpression also induced increased transcript expression of pro‐proliferative SMARCA4 42 and CTNNB1 43 and down‐regulation of MAPK‐14, 44 an inhibitor of muscle progenitor proliferation. Future study is necessary to delineate downstream signalling engaged by miR‐490‐3p to mediate its anti‐myogenic effects.
The increased expression of miR‐490‐3p in patients who have recovered muscle mass may serve to prevent dysregulated growth, consistent with its role as a tumour suppressor. Improvement in muscle mass and strength begins to plateau at 6M post‐ICU discharge, and increased miR‐490‐3p expression at this time‐point may represent an observed ‘brake’ in muscle mass reconstitution. Alternatively, the increased expression of miR‐490‐3p in improvers vs. non‐improvers may represent a normal baseline level of muscle expression, and the relative decrease of miR‐490‐3p in the non‐improvers may enable continued efforts at hyperplastic muscle regrowth.
MiR‐744‐5p was recently reported to be a novel regulator of myogenesis, stimulating proliferation and inhibiting differentiation of bovine myoblasts. 18 While we also found miR‐744‐5p delayed myogenic differentiation of myoblasts, we in contrast found it inhibited proliferation of AB1167 myoblasts and had no effect on C2C12 cells. Thus, the impact of miR‐744‐5p on proliferation appears to be specific to the cell culture system studied. We found miR‐744‐5p up‐regulated in patients who reconstitute their muscle mass at 6M vs. those with sustained wasting. We speculate the anti‐differentiation effect of miR‐744‐5p may represent a normal baseline of expression with decreased expression noted in non‐improvers, permitting ongoing attempts at muscle regrowth.
Our study has several limitations. While we provide direct mechanistic evidence in vitro that miRs‐490‐3p and ‐744‐5p are negative regulators of myogenesis (proliferation and differentiation respectively), we show only association with clinical measures of muscle recovery post‐ICU. It remains possible the differences in expression observed between improvers vs. non‐improvers represent normal variance in the population. Alternatively, the miR:mRNA signatures at 6M may simply be reflective of muscle that is unable to mount a reparative response, as opposed to playing a causative role. Although the patient cohort assessed here was representative of the larger study population, our analysis was limited by the small number of patients. Given the nature and severity of their illness, we experienced patient attrition due to medical complications precluding, or refusal of muscle biopsy, ICU repatriation, study withdrawal, and death. We may be underpowered for some comparisons, and results may not be applicable to the larger population, which will need to be evaluated in other ICU cohorts. The focus on the transcriptome in the humans is also limiting the scope of understanding the biology in full as transcript levels do not necessarily reflect protein expression and cannot delineate protein functional status.
In summary, we have demonstrated that a small group of master miR‐regulators predicted to impact myogenesis and muscle bioenergy utilization and establish the differentially expressed gene modules may drive the sustained muscle wasting and weakness vs. muscle recovery in critical illness survivors. A reparative proliferative and hypertrophic response appears evident early post‐ICU discharge in all patients based on the miR signatures, which is no longer evident long term in those with sustained muscle wasting vs. those who successfully reconstitute muscle mass. Given that miR mimics and miR inhibitors hold potential to be developed as therapeutic agents, these findings may enable future potential clinical intervention.
Conflict of interest
The authors declare that they have no conflict of interest.
Funding
This work was supported by the Canadian Institutes of Health Research (CIHR Grants MOP‐106545 to C.C.D.S.; MOV‐137002 and MOV‐408235 to J.B., M.J.H., S.M., and C.C.D.S.), Physicians Services Incorporated (Grant PSI 09‐21 to J.B., C.C.D.S. and M.H.), and the Lung Association/Canadian Thoracic Society Research Studentship (2015) to C.W.
Supporting information
Figure S1. Flow diagram of participant recruitment and study completion. Of 103 RECOVER trialpatients recruited in 1 trauma and 2 medical‐surgical ICUs at the University Health Network (UHN) and St. Michaels Hospital (SMH) Toronto, Canada, 59 eligible patients were invited to participate in the study. 27 patients consented to study enrollment. 12 patients died, were repatriated to another institution or withdrew prior to the 7D post‐ICU assessment. 15 and 11 patients completed the 7D and 6 M post‐ICU analyses respectively. One muscle biopsy obtained at 7D and three taken at 6 M did not provide sufficient RNA for miR expression profiling and were therefore excluded from the analysis. (7D = 7 days, 6 M = 6 months).
Figure S2. miR‐490‐3p and mir‐744‐5p endogenous expression during myoblast proliferation and differentiation. Absolute copy number of miRs490‐3p and 744‐5p in AB1167 human myoblasts (left panel) as determined by droplet digital PCR (ddPCR) and relative expression in C2C12 murine myoblasts (right panel) as determined by qPCR at serial time points post plating. C2C12 miR expression was calculated as fold change (2∆∆CT relative quantification method) between time points proliferation; baseline −2 days (D) and differentiation; 2D‐7D, relative to geometric mean of two reference RNA [snoRNA234 and RNU6b]. MiR‐490‐3p was expressed in early proliferative AB1167 and C2C12 myoblasts (4 hours [H], 2D) but then decreased with progression to differentiation (4D, 7D, 10D). miR‐744‐5p expression was consistent across all time points with no significant changes as cells moved from highly proliferative at 4H to fully differentiated at 7D and 10D post plating. (#p < 0.05 between time points; *p < 0.05 relative fold change; n = minimum of 4 experiments/cell line; cells plated in triplicate/experimental condition).
Figure S3. Droplet Digital PCR (ddPCR) to demonstrate myoblast transfection. To confirm miR transfection for all experiments, isolated RNA from miR‐transfected (miR‐490‐3p or miR‐744‐5p) and control (scrambled) myoblast cultures was assayed using Taqman‐based ddPCR, providing absolute quantitation. (a) ddPCRvisual report for miR‐744‐5p (left panels) and miR‐490‐3p (right panels) in AB1167 (upper panels) and C2C12 (lower panels) transfected myoblasts 48 hours post transfection and (b) miRcopy number. Representative results are shown. miRexpression was maintained for the duration of experiments (data not shown).
Figure S4. miRs490‐3p and 744‐5p are negative regulators of AB1167 human myoblast proliferation. Representative confocal images of immunostaining for proliferation antigen Ki67 (red) in AB1167 myoblasts transfected with miR‐490‐3p mimic, miR‐490‐3p inhibitor, miR‐744‐5p mimic, miR‐744‐5p inhibitor, or scrambled negative control and untransfected cells, 72 hours post‐transfection. Nuclei are stained with Dapi (blue). Image quantification is shown in Figure 4.
Figure S5. miR‐490‐3p overexpression significantly reduces C2C12 myoblast proliferation. (a) C2C12 myoblast counts and proportion of Ki67–positive nuclei at 24 h (n = 4), 48 h (n = 6), 72 h (n = 4) and 96 h (n = 4) post transfection with miR490‐3p (left panels), miR744‐5p (right panels) and negative controls (scrambled miR, mock transfection). (B) Representative confocal images of immunostaining for DAPI (blue) and proliferation antigen Ki67 (red) in C2C12 myoblasts transfected with miR490‐3p, miR744‐5p or scrambled miR at 48 hours post plating. miR‐490‐3p overexpression inhibits C2C12 myoblast proliferation compared to scrambled control, but miR‐744‐5p overexpression has no effect on C2C12 cells. (Data are mean +/‐SD; *P <0.05; ** P <0.01. Cells plated in triplicate per experimental condition)
Figure S6. miR490‐3p overexpression significantly reduces C2C12 myoblast proliferation. C2C12 myoblasts were transfected with miR‐490‐3p or miR‐744‐5p and scrambled negative control. 48 (n = 3) or 96 (n = 3) hours post transfection protein lysates were separated by SDS‐PAGE, transferred to nitrocellulose and immunoblotted for proliferating cell nuclear antigen (PCNA) and α‐actinin (loading control). (a) Images were acquired and Western blot band intensities quantified with Biorad GelDoc Easy Imager and ImageLabs software. PCNA expression was normalized to α‐actinin for each miR treatment. Fold change of miR490‐3p and miR744‐5p transfected myoblasts was expressed relative to scrambled miR. (b) Representative Western Blot at 48 h post‐transfection. miR‐490‐3p constitutive expression inhibits C2C12 myoblast proliferation, but miR‐744‐5p overexpression has no effect. (Data are mean +/‐SEM, *p < 0.05. Cells plated in triplicate/experimental condition).
Figure S7. miR‐744‐5p is a negative regulator of AB1167 human myoblast differentiation. Representative immunofluorescence images of miR‐490‐3p mimic, miR‐490‐3p inhibitor, miR‐744‐5p mimic, miR‐744‐5p inhibitor, or scramble‐miR transfected and untransfected AB1167 myoblasts at 8 days post‐transfection, immunostained for Myosin Heavy Chain (MHC, yellow) and DAPI (blue to indicate nuclei) to detect differentiation and fusion to myotubes. Image quantification is shown in Figure 5. MiR‐744‐5p negatively regulates myoblast differentiation, but miR‐490‐3p has no effect.
Figure S8. miR744‐5p overexpression decreases C2C12 differentiation
(a) Representative images of miR‐490‐3p, miR‐744‐5p, and scrambled miR transfected C2C12 cells at 96 h post‐transfection, stained for myosin heavy chain (MHC, red) and DAPI (blue, nuclei) to detect myoblasts differentiating to myotubes. (b) Fusion Index at 72 (n = 3) and 96 (n = 3) hours post‐transfection. MiR‐744‐5p significantly reduced the fusion index compare to scrambled control. Mir‐490‐3p constitutive expression had no effect. (Fusion index = percentage of nuclei in fused myotubes [MHC positive cells with 2 or more nuclei] relative to the total number of nuclei/image. Data are mean +/‐SD, *P < 0.05. Cells are plated in triplicate/experimental condition).
Data S1. Supporting Information.
Table S1. Differentially expressed miRs and genes between patient subgroups and healthy individuals.
Table S2a to f. Differentially expressed MiRs with the number of targets in the signature(s) for the subgroup(s) in which they are differentially expressed.
Table S3. Network reconstruction output.
Table S4. Results of the master regulator analysis (MRA) for each miR regulon.
Table S5a to d. Putative gene targets of ICUAW Master MiR‐Regulators.
Table S6. miR regulons and the Intensive Care Unit Acquired Weakness (ICUAW)‐relevant co‐expression gene modules having significant enrichment for genes within the regulon
Acknowledgements
We thank all the research coordinators, family, and patients who contributed to make the work possible. We thank Myoline, the platform for immortalization of human cells from the Institute of Myology, for provision of the AB1167 human skeletal muscle cell line and Dr Linglong Kong, University of Alberta, for his expert statistical and computational review of the manuscript. The authors of this manuscript certify that they comply with the ethical guidelines for authorship and publishing in the Journal of Cachexia, Sarcopenia and Muscle. 41
Walsh C. J., Escudero King C., Gupta M., Plant P. J., Herridge M. J., Mathur S., Hu P., Correa J., Ahmed S., Bigot A., dos Santos C. C., Batt J., and Submitted on behalf of the MusclE and Nerve Dysfunction (MEND)‐ICU Group and Canadian Critical Care Translational Biology Group (CCCTBG) (2022) MicroRNA regulatory networks associated with abnormal muscle repair in survivors of critical illness, Journal of Cachexia, Sarcopenia and Muscle, 13, 1262–1276, 10.1002/jcsm.12903
Christopher Walsh, Carlos Escudero, and Muskan Gupta contributed equally to the manuscript as co‐first authors.
Claudia C. dos Santos and Jane Batt are co‐senior authors.
Contributor Information
Claudia C. dos Santos, Email: claudia.dossantos@unityhealth.to.
Jane Batt, Email: jane.batt@utoronto.ca.
References
- 1. Vanhorebeek I, Latronico N, Van den Berghe G. ICU‐acquired weakness. Intensive Care Med. 2020;46:637–654. [DOI] [PMC free article] [PubMed] [Google Scholar]
- 2. Dos Santos C, Herridge M, Batt J. From skeletal muscle wasting to functional outcomes following critical illness. Thorax. 2019;74:1091–1098. [DOI] [PubMed] [Google Scholar]
- 3. Dos Santos C, Hussain SN, Mathur S, Picard M, Herridge M, Correa J, et al. Mechanisms of chronic muscle wasting and dysfunction after an intensive care unit stay. A pilot study. Am J Respir Crit Care Med. 2016;194:821–830. [DOI] [PubMed] [Google Scholar]
- 4. Herridge MS, Chu LM, Matte A, Tomlinson G, Chan L, Thomas C, et al. The RECOVER program: disability risk groups and 1‐year outcome after 7 or more days of mechanical ventilation. Am J Respir Crit Care Med. 2016;194:831–844. [DOI] [PubMed] [Google Scholar]
- 5. Latronico N, Herridge M, Hopkins RO, Angus D, Hart N, Hermans G, et al. The ICM research agenda on intensive care unit‐acquired weakness. Intensive Care Med. 2017;43:1270–1281. [DOI] [PubMed] [Google Scholar]
- 6. Walsh CJ, Batt J, Herridge MS, Mathur S, Bader GD, Hu P, et al. Transcriptomic analysis reveals abnormal muscle repair and remodeling in survivors of critical illness with sustained weakness. Sci Rep. 2016;6:29334. [DOI] [PMC free article] [PubMed] [Google Scholar]
- 7. Vasudevan S. Posttranscriptional upregulation by microRNAs. Wiley Interdiscip Rev RNA. 2012;3:311–330. [DOI] [PubMed] [Google Scholar]
- 8. Lai X, Bhattacharya A, Schmitz U, Kunz M, Vera J, Wolkenhauer O. A systems' biology approach to study microRNA‐mediated gene regulatory networks. Biomed Res Int. 2013; 2013: 703849, 1, 15. [DOI] [PMC free article] [PubMed] [Google Scholar]
- 9. Hanna J, Hossain GS, Kocerha J. The potential for microRNA therapeutics and clinical research. Front Genet. 2019;10:478. [DOI] [PMC free article] [PubMed] [Google Scholar]
- 10. Jones KJ, Searles CD. Development of microRNA‐based therapeutics for vascular disease. Circ Res. 2020;127:1179–1181. [DOI] [PMC free article] [PubMed] [Google Scholar]
- 11. Rupaimoole R, Slack FJ. MicroRNA therapeutics: towards a new era for the management of cancer and other diseases. Nat Rev Drug Discov. 2017;16:203–222. [DOI] [PubMed] [Google Scholar]
- 12. Wang J, Yang LZ, Zhang JS, Gong JX, Wang YH, Zhang CL, et al. Effects of microRNAs on skeletal muscle development. Gene. 2018;668:107–113. [DOI] [PubMed] [Google Scholar]
- 13. Cantini L, Isella C, Petti C, Picco G, Chiola S, Ficarra E, et al. MicroRNA‐mRNA interactions underlying colorectal cancer molecular subtypes. Nat Commun. 2015;6:8878. [DOI] [PMC free article] [PubMed] [Google Scholar]
- 14. Burattini S, Ferri P, Battistelli M, Curci R, Luchetti F, Falcieri E. C2C12 murine myoblasts as a model of skeletal muscle development: morpho‐functional characterization. Eur J Histochem. 2004;48:223–233. [PubMed] [Google Scholar]
- 15. Ritchie ME, Phipson B, Wu D, Hu Y, Law CW, Shi W, et al. Limma powers differential expression analyses for RNA‐sequencing and microarray studies. Nucleic Acids Res. 2015;43:e47. [DOI] [PMC free article] [PubMed] [Google Scholar]
- 16. Lachmann A, Giorgi FM, Lopez G, Califano A. ARACNe‐AP: gene network reverse engineering through adaptive partitioning inference of mutual information. Bioinformatics. 2016;32:2233–2235. [DOI] [PMC free article] [PubMed] [Google Scholar]
- 17. Carro MS, Lim WK, Alvarez MJ, Bollo RJ, Zhao X, Snyder EY, et al. The transcriptional network for mesenchymal transformation of brain tumours. Nature. 2010;463:318–325. [DOI] [PMC free article] [PubMed] [Google Scholar]
- 18. Peng S, Song C, Li H, Cao X, Ma Y, Wang X, et al. Circular RNA SNX29 sponges miR‐744 to regulate proliferation and differentiation of myoblasts by activating the Wnt5a/Ca(2+) signaling pathway. Mol Ther Nucleic Acids. 2019;16:481–493. [DOI] [PMC free article] [PubMed] [Google Scholar]
- 19. Chen S, Chen X, Xiu YL, Sun KX, Zhao Y. MicroRNA‐490‐3P targets CDK1 and inhibits ovarian epithelial carcinoma tumorigenesis and progression. Cancer Lett. 2015;362:122–130. [DOI] [PubMed] [Google Scholar]
- 20. Liu W, Xu G, Liu H, Li T. MicroRNA‐490‐3p regulates cell proliferation and apoptosis by targeting HMGA2 in osteosarcoma. FEBS Lett. 2015;589:3148–3153. [DOI] [PubMed] [Google Scholar]
- 21. Shalgi R, Lieber D, Oren M, Pilpel Y. Global and local architecture of the mammalian microRNA‐transcription factor regulatory network. PLoS Comput Biol. 2007;3:e131. [DOI] [PMC free article] [PubMed] [Google Scholar]
- 22. Chakraborty C, Sharma AR, Sharma G, Doss CGP, Lee SS. Therapeutic miRNA and siRNA: moving from bench to clinic as next generation medicine. Mol Ther Nucleic Acids. 2017;8:132–143. [DOI] [PMC free article] [PubMed] [Google Scholar]
- 23. Kreth S, Hubner M, Hinske LC. MicroRNAs as clinical biomarkers and therapeutic tools in perioperative medicine. Anesth Analg. 2018;126:670–681. [DOI] [PubMed] [Google Scholar]
- 24. Li J, Wang L, Hua X, Tang H, Chen R, Yang T, et al. CRISPR/Cas9‐mediated miR‐29b editing as a treatment of different types of muscle atrophy in mice. Mol Ther. 2020;28:1359–1372. [DOI] [PMC free article] [PubMed] [Google Scholar]
- 25. Fredriksson K, Hammarqvist F, Strigard K, Hultenby K, Ljungqvist O, Wernerman J, et al. Derangements in mitochondrial metabolism in intercostal and leg muscle of critically ill patients with sepsis‐induced multiple organ failure. Am J Physiol Endocrinol Metab. 2006;291:E1044–E1050. [DOI] [PubMed] [Google Scholar]
- 26. Puthucheary ZA, Astin R, McPhail MJW, Saeed S, Pasha Y, Bear DE, et al. Metabolic phenotype of skeletal muscle in early critical illness. Thorax. 2018;73:926–935. [DOI] [PubMed] [Google Scholar]
- 27. Jiroutkova K, Krajcova A, Ziak J, Fric M, Waldauf P, Dzupa V, et al. Mitochondrial function in skeletal muscle of patients with protracted critical illness and ICU‐acquired weakness. Crit Care. 2015;19(448). [DOI] [PMC free article] [PubMed] [Google Scholar]
- 28. Sarkar S, Dey BK, Dutta A. MiR‐322/424 and ‐503 are induced during muscle differentiation and promote cell cycle quiescence and differentiation by down‐regulation of Cdc25A. Mol Biol Cell. 2010;21:2138–2149. [DOI] [PMC free article] [PubMed] [Google Scholar]
- 29. Kim HK, Lee YS, Sivaprasad U, Malhotra A, Dutta A. Muscle‐specific microRNA miR‐206 promotes muscle differentiation. J Cell Biol. 2006;174:677–687. [DOI] [PMC free article] [PubMed] [Google Scholar]
- 30. Wei W, He HB, Zhang WY, Zhang HX, Bai JB, Liu HZ, et al. miR‐29 targets Akt3 to reduce proliferation and facilitate differentiation of myoblasts in skeletal muscle development. Cell Death Dis. 2013;4:e668. [DOI] [PMC free article] [PubMed] [Google Scholar]
- 31. McCarthy JJ. MicroRNA‐206: the skeletal muscle‐specific myomiR. Biochim Biophys Acta. 2008;1779:682–691. [DOI] [PMC free article] [PubMed] [Google Scholar]
- 32. Mercatelli N, Fittipaldi S, De Paola E, Dimauro I, Paronetto MP, Jackson MJ, et al. MiR‐23‐ TrxR1 as a novel molecular axis in skeletal muscle differentiation. Sci Rep. 2017;7:7219. [DOI] [PMC free article] [PubMed] [Google Scholar]
- 33. Connolly M, Paul R, Farre‐Garros R, Natanek SA, Bloch S, Lee J, et al. miR‐424‐5p reduces ribosomal RNA and protein synthesis in muscle wasting. J Cachexia Sarcopenia Muscle. 2018;9:400–416. [DOI] [PMC free article] [PubMed] [Google Scholar]
- 34. Li J, Chan MC, Yu Y, Bei Y, Chen P, Zhou Q, et al. miR‐29b contributes to multiple types of muscle atrophy. Nat Commun. 2017;8:15201. [DOI] [PMC free article] [PubMed] [Google Scholar]
- 35. Chen J‐F, Tao Y, Li J, Deng Z, Yan Z, Xiao X, et al. microRNA‐1 and microRNA‐206 regulate skeletal muscle satellite cell proliferation and differentiation by repressing Pax7. J Cell Biol. 2010;190:867–879. [DOI] [PMC free article] [PubMed] [Google Scholar]
- 36. Ma G, Wang Y, Li Y, Cui L, Zhao Y, Zhao B, et al. MiR‐206, a key modulator of skeletal muscle development and disease. Int J Biol Sci. 2015;11:345–352. [DOI] [PMC free article] [PubMed] [Google Scholar]
- 37. Yalvac ME, Amornvit J, Braganza C, Chen L, Hussain SA, Shontz KM, et al. Impaired regeneration in calpain‐3 null muscle is associated with perturbations in mTORC1 signaling and defective mitochondrial biogenesis. Skelet Muscle. 2017;7:27. [DOI] [PMC free article] [PubMed] [Google Scholar]
- 38. Stuelsatz P, Pouzoulet F, Lamarre Y, Dargelos E, Poussard S, Leibovitch S, et al. Down‐ regulation of MyoD by calpain 3 promotes generation of reserve cells in C2C12 myoblasts. J Biol Chem. 2010;285:12670–12683. [DOI] [PMC free article] [PubMed] [Google Scholar]
- 39. Wang YN, Yang WC, Li PW, Wang HB, Zhang YY, Zan LS. Myocyte enhancer factor 2A promotes proliferation and its inhibition attenuates myogenic differentiation via myozenin 2 in bovine skeletal muscle myoblast. PLoS ONE. 2018;13:e0196255. [DOI] [PMC free article] [PubMed] [Google Scholar]
- 40. Liu N, Nelson BR, Bezprozvannaya S, Shelton JM, Richardson JA, Bassel‐Duby R, et al. Requirement of MEF2A, C, and D for skeletal muscle regeneration. Proc Natl Acad Sci U S A. 2014;111:4109–4114. [DOI] [PMC free article] [PubMed] [Google Scholar]
- 41. von Haehling S, Morley JE, Coats AJS, Anker SD. Ethical guidelines for publishing in the Journal of Cachexia, Sarcopenia and Muscle: update 2019. J Cachexia Sarcopenia Muscle. 2019;10:1143–1145. [DOI] [PMC free article] [PubMed] [Google Scholar]
- 42. Padilla‐Benavides T, Nasipak BT, Imbalzano AN. Brg1 controls the expression of Pax7 to promote viability and proliferation of mouse primary myoblasts. J Cell Physiol. 2015;230:2990–2997. [DOI] [PMC free article] [PubMed] [Google Scholar]
- 43. Suzuki A, Scruggs A, Iwata J. The temporal specific role of WNT/B‐catenin signalling during myogenesis. J Nat Sci. 2016;1:e143. [PMC free article] [PubMed] [Google Scholar]
- 44. Brien P, Pugazhendhi D, Woodhouse S, Oxley D, Pell JM. P38alpha MAPK regulates adult muscle stem cell fate by restricting progenitor proliferation during postnatal growth and repair. Stem Cells. 2013;31(8):1597–1610. [DOI] [PubMed] [Google Scholar]
Associated Data
This section collects any data citations, data availability statements, or supplementary materials included in this article.
Supplementary Materials
Figure S1. Flow diagram of participant recruitment and study completion. Of 103 RECOVER trialpatients recruited in 1 trauma and 2 medical‐surgical ICUs at the University Health Network (UHN) and St. Michaels Hospital (SMH) Toronto, Canada, 59 eligible patients were invited to participate in the study. 27 patients consented to study enrollment. 12 patients died, were repatriated to another institution or withdrew prior to the 7D post‐ICU assessment. 15 and 11 patients completed the 7D and 6 M post‐ICU analyses respectively. One muscle biopsy obtained at 7D and three taken at 6 M did not provide sufficient RNA for miR expression profiling and were therefore excluded from the analysis. (7D = 7 days, 6 M = 6 months).
Figure S2. miR‐490‐3p and mir‐744‐5p endogenous expression during myoblast proliferation and differentiation. Absolute copy number of miRs490‐3p and 744‐5p in AB1167 human myoblasts (left panel) as determined by droplet digital PCR (ddPCR) and relative expression in C2C12 murine myoblasts (right panel) as determined by qPCR at serial time points post plating. C2C12 miR expression was calculated as fold change (2∆∆CT relative quantification method) between time points proliferation; baseline −2 days (D) and differentiation; 2D‐7D, relative to geometric mean of two reference RNA [snoRNA234 and RNU6b]. MiR‐490‐3p was expressed in early proliferative AB1167 and C2C12 myoblasts (4 hours [H], 2D) but then decreased with progression to differentiation (4D, 7D, 10D). miR‐744‐5p expression was consistent across all time points with no significant changes as cells moved from highly proliferative at 4H to fully differentiated at 7D and 10D post plating. (#p < 0.05 between time points; *p < 0.05 relative fold change; n = minimum of 4 experiments/cell line; cells plated in triplicate/experimental condition).
Figure S3. Droplet Digital PCR (ddPCR) to demonstrate myoblast transfection. To confirm miR transfection for all experiments, isolated RNA from miR‐transfected (miR‐490‐3p or miR‐744‐5p) and control (scrambled) myoblast cultures was assayed using Taqman‐based ddPCR, providing absolute quantitation. (a) ddPCRvisual report for miR‐744‐5p (left panels) and miR‐490‐3p (right panels) in AB1167 (upper panels) and C2C12 (lower panels) transfected myoblasts 48 hours post transfection and (b) miRcopy number. Representative results are shown. miRexpression was maintained for the duration of experiments (data not shown).
Figure S4. miRs490‐3p and 744‐5p are negative regulators of AB1167 human myoblast proliferation. Representative confocal images of immunostaining for proliferation antigen Ki67 (red) in AB1167 myoblasts transfected with miR‐490‐3p mimic, miR‐490‐3p inhibitor, miR‐744‐5p mimic, miR‐744‐5p inhibitor, or scrambled negative control and untransfected cells, 72 hours post‐transfection. Nuclei are stained with Dapi (blue). Image quantification is shown in Figure 4.
Figure S5. miR‐490‐3p overexpression significantly reduces C2C12 myoblast proliferation. (a) C2C12 myoblast counts and proportion of Ki67–positive nuclei at 24 h (n = 4), 48 h (n = 6), 72 h (n = 4) and 96 h (n = 4) post transfection with miR490‐3p (left panels), miR744‐5p (right panels) and negative controls (scrambled miR, mock transfection). (B) Representative confocal images of immunostaining for DAPI (blue) and proliferation antigen Ki67 (red) in C2C12 myoblasts transfected with miR490‐3p, miR744‐5p or scrambled miR at 48 hours post plating. miR‐490‐3p overexpression inhibits C2C12 myoblast proliferation compared to scrambled control, but miR‐744‐5p overexpression has no effect on C2C12 cells. (Data are mean +/‐SD; *P <0.05; ** P <0.01. Cells plated in triplicate per experimental condition)
Figure S6. miR490‐3p overexpression significantly reduces C2C12 myoblast proliferation. C2C12 myoblasts were transfected with miR‐490‐3p or miR‐744‐5p and scrambled negative control. 48 (n = 3) or 96 (n = 3) hours post transfection protein lysates were separated by SDS‐PAGE, transferred to nitrocellulose and immunoblotted for proliferating cell nuclear antigen (PCNA) and α‐actinin (loading control). (a) Images were acquired and Western blot band intensities quantified with Biorad GelDoc Easy Imager and ImageLabs software. PCNA expression was normalized to α‐actinin for each miR treatment. Fold change of miR490‐3p and miR744‐5p transfected myoblasts was expressed relative to scrambled miR. (b) Representative Western Blot at 48 h post‐transfection. miR‐490‐3p constitutive expression inhibits C2C12 myoblast proliferation, but miR‐744‐5p overexpression has no effect. (Data are mean +/‐SEM, *p < 0.05. Cells plated in triplicate/experimental condition).
Figure S7. miR‐744‐5p is a negative regulator of AB1167 human myoblast differentiation. Representative immunofluorescence images of miR‐490‐3p mimic, miR‐490‐3p inhibitor, miR‐744‐5p mimic, miR‐744‐5p inhibitor, or scramble‐miR transfected and untransfected AB1167 myoblasts at 8 days post‐transfection, immunostained for Myosin Heavy Chain (MHC, yellow) and DAPI (blue to indicate nuclei) to detect differentiation and fusion to myotubes. Image quantification is shown in Figure 5. MiR‐744‐5p negatively regulates myoblast differentiation, but miR‐490‐3p has no effect.
Figure S8. miR744‐5p overexpression decreases C2C12 differentiation
(a) Representative images of miR‐490‐3p, miR‐744‐5p, and scrambled miR transfected C2C12 cells at 96 h post‐transfection, stained for myosin heavy chain (MHC, red) and DAPI (blue, nuclei) to detect myoblasts differentiating to myotubes. (b) Fusion Index at 72 (n = 3) and 96 (n = 3) hours post‐transfection. MiR‐744‐5p significantly reduced the fusion index compare to scrambled control. Mir‐490‐3p constitutive expression had no effect. (Fusion index = percentage of nuclei in fused myotubes [MHC positive cells with 2 or more nuclei] relative to the total number of nuclei/image. Data are mean +/‐SD, *P < 0.05. Cells are plated in triplicate/experimental condition).
Data S1. Supporting Information.
Table S1. Differentially expressed miRs and genes between patient subgroups and healthy individuals.
Table S2a to f. Differentially expressed MiRs with the number of targets in the signature(s) for the subgroup(s) in which they are differentially expressed.
Table S3. Network reconstruction output.
Table S4. Results of the master regulator analysis (MRA) for each miR regulon.
Table S5a to d. Putative gene targets of ICUAW Master MiR‐Regulators.
Table S6. miR regulons and the Intensive Care Unit Acquired Weakness (ICUAW)‐relevant co‐expression gene modules having significant enrichment for genes within the regulon