

Abstract
Background
Duchenne muscular dystrophy (DMD) is caused by DMD mutations leading to dystrophin loss. Full‐length Dp427 is the primary dystrophin isoform expressed in muscle and is also expressed in the central nervous system (CNS). Two shorter isoforms, Dp140 and Dp71, are highly expressed in the CNS. While a role for Dp140 and Dp71 on DMD CNS comorbidities is well known, relationships between mutations expected to disrupt Dp140 and Dp71 and motor outcomes are not.
Methods
Functional outcome data from 387 DMD boys aged 4–15 years were subdivided by DMD mutation expected effects on dystrophin isoform expression; Group 1 (Dp427 absent, Dp140/Dp71 present, n = 201); Group 2 (Dp427/Dp140 absent, Dp71 present, n = 152); and Group 3 (Dp427/Dp140/Dp71 absent, n = 34). Relationships between isoform group and North Star ambulatory assessment (NSAA) scores, 10 m walk/run velocities and rise time velocities were explored using regression analysis.
Western blot analysis was used to study Dp427, Dp140 and Dp71 production in myogenic cells (control and DMD human), control skeletal muscle, DMD skeletal muscle from the three isoform groups and cerebral cortex from mice (wild‐type and DMD models). Grip strength and rotarod running test were studied in wild‐type mice and DMD mouse models. DMD mouse models were mdx (Dp427 absent, Dp140/Dp71 present), mdx52 (Dp427/Dp140 absent, Dp71 present) and DMD‐null (lacking all isoforms).
Results
In DMD boys, mean NSAA scores at 5 years of age were 6.1 points lower in Group 3 than Group 1 (P < 0.01) and 4.9 points lower in Group 3 than Group 2 (P = 0.05). Mean peak NSAA scores were 4.0 points lower in Group 3 than Group 1 (P < 0.01) and 1.6 points lower in Group 2 than Group 1 (P = 0.04).
Mean four‐limb grip strength was 1.5 g/g lower in mdx52 than mdx mice (P = 0.003) and 1.5 g/g lower in DMD‐null than mdx mice (P = 0.002).
Dp71 was produced in myogenic cells (control and DMD human) and skeletal muscle from humans in Groups 1 and 2 and mdx mice, but not skeletal muscle from human controls, myogenic cells and skeletal muscle from humans in Group 3 or skeletal muscle from wild‐type, mdx52 or DMD‐null mice.
Conclusions
Our results highlight the importance of considering expected effects of DMD mutations on dystrophin isoform production when considering patterns of DMD motor impairment and the implications for clinical practice and clinical trials. Our results suggest a complex relationship between dystrophin isoforms expressed in the brain and DMD motor function.
Keywords: Duchenne muscular dystrophy, Isoform, Motor function
Introduction
Duchenne muscular dystrophy (DMD) is an X‐linked recessive condition caused by DMD mutations leading to dystrophin deficiency. 1 , 2 DMD boys typically present with delayed motor milestones, frequent falls and speech delay. 2 Neurobehavioural comorbidities, including intellectual disability, attention deficit hyperactivity disorder and/or autism spectrum disorder, occur in approximately one third of patients. 2 Loss of ambulation (LOA) typically occurs by 12 years of age, followed by cardiomyopathy and respiratory insufficiency. 2 Life expectancy is reduced to around the thirties. 3
Duchenne muscular dystrophy shows significant clinical heterogeneity. Some heterogeneity is related to DMD genotypes allowing low level dystrophin production. 4 Gene modifiers other than DMD have recently been identified. 5 , 6 , 7 However, each modifier only modestly contributes to DMD heterogeneity, suggesting other, as yet unidentified, factors.
The DMD locus encodes multiple isoforms. 8 Full‐length Dp427 (427 represents molecular weight in kDa) exists in three isoforms. Dp427m is expressed highly in skeletal muscle and, together with Dp427c and Dp427p, at low levels in human brain. 8 , 9 Shorter dystrophin isoforms are driven by intronic promoters further downstream the gene. Dp140 and Dp71 are abundantly expressed in brain, with Dp71 having a broader pattern of expression, including liver, testis, lung and kidney. 8 , 10 , 11 While in DMD all mutations affect Dp427 production, the DMD mutation location can also disrupt production of one or both of Dp140 and Dp71. Dp260 and Dp116 expression is limited to retina and peripheral nerves respectively. 8
Several studies have suggested a role of Dp140 and Dp71 in DMD central nervous system (CNS) involvement. 12 , 13 , 14 , 15 , 16 , 17 , 18 15% of DMD boys lacking only Dp427 had intellectual disability, compared with 25% of boys lacking Dp427 and Dp140 and 64% of boys lacking Dp427, Dp140 and Dp71. 18
We hypothesized that DMD mutations expected to disrupt different dystrophin isoforms may have a different impact on DMD motor outcomes. We conducted a series of studies addressing this. We evaluated relationships between DMD mutations expected to lead to loss of Dp427/Dp140 and Dp427/Dp140/Dp71 compared with loss of Dp427 alone on motor function in a large cohort of DMD boys. We focused on the following motor outcomes commonly used in clinical trials: (1) North Star ambulatory assessment (NSAA) score, (2) rise from supine time and rise from supine time velocity, (3) 10 m walk/run (10MWR) time and velocity and (4) age at LOA. We conducted parallel experiments in three DMD mouse models with mutations leading to differential involvement of the three isoforms. Finally, we evaluated dystrophin isoform protein production in human control and DMD (from the three isoform groups) skeletal muscle and myogenic cells in culture, and in muscle and brain of wild‐type and three DMD mouse models.
Methods
Duchenne muscular dystrophy boys
Study design and participants
Three hundred eighty‐seven participants aged 4–15 years with DMD or intermediate muscular dystrophy (IMD) and an out‐of‐frame DMD deletion or duplication were included. Participants with in‐frame DMD deletions/duplications and IMD, Becker muscular dystrophy, female carriers and clinical trial participants were excluded. Participants were recruited from the North Star network of UK centres looking after DMD patients. 19 , 20 Clinical data, collected six monthly using standard operating procedures, is stored, with written consent, in an electronic database managed by CertusLtd. The NSAA is a 17‐item DMD‐specific motor function scale with maximum total score of 34. 21
DMD mutation data
Participants were grouped into 3 groups based on predicted DMD mutation effects on dystrophin isoform expression: Group 1 (Dp427 absent, Dp140/Dp71 present, n = 201); Group 2 (Dp427/Dp140 absent, Dp71 present, n = 152); and Group 3 (Dp427/Dp140/Dp71 absent, n = 34). Participants with DMD mutations only involving the region upstream of intron 44 were considered Dp427 negative and Dp140/Dp71 positive (Group 1), participants with DMD mutations involving the region from exon 51 to exon 62 inclusive and not involving the region of exon 63 or downstream of exon 63 were considered Dp427/Dp140 negative and Dp71 positive (Group 2) and participants with DMD mutations involving exon 63 and/or the region downstream of exon 63 were considered Dp427/Dp140/Dp71 negative (Group 3). 10 , 22 Participants with DMD mutations involving exon 45 to exon 50 inclusive and not involving the region of exon 51 and downstream of exon 51 were excluded from analysis due to difficulties predicting their effects on Dp140 expression as the Dp140 promoter is in intron 44 and its translation start site in exon 51. 10 , 22
Cognition grouping
Cognitive status was evaluated by formal testing of intelligence quotient (IQ) in a subset of 40 boys who have participated in other previously reported studies at our centre 16 , 23 or presence/absence of learning difficulties as determined by parental and/or physician and/or educational report. The cognitive impairment group had learning disabilities [as reported by parent/guardian(s) and/or physician and/or educational services] and/or an IQ of less than 85 (>1 standard deviation below mean population IQ). 24 , 25 The normal cognition group had no learning disability [as reported by parent/guardian(s) and/or physician and/or educational services] and/or an IQ of 85 or above.
Statistical analysis
Patient characteristics were summarized using mean and standard deviation for continuous data and frequency and proportion for categorical data. Glucocorticoid (GC) regimen was summarized as the regime (daily, intermittent/other or none) taken for the longest duration over both the full longitudinal period (majority regimen) and the duration prior to peak NSAA (early regime). Where age of GC initiation was not available, this was estimated based on mean age of GC initiation in the cohort. Ambulatory function at 5 years was described for patients with a visit between 4.5 and 5.5 years of age.
Comparisons between isoform and cognitive impairment groups were made using one‐way analysis of variance and χ 2 tests. For NSAA score, 10MWR velocity and rise time velocity, relationships with age were explored for each isoform group; additionally, relationships for NSAA score with age were explored in the two cognition groups. Fractional polynomial regression, accounting for the longitudinal data, was used to find best fitting models by comparing model deviances. 26 Noting the different mean peak functional scores for the isoform and cognition groups, subsequent analysis focussed on the age range 5.5–8 years, when we expected most participants to reach peak motor function, calculating age and magnitude of peak observed motor function.
Multivariable regression analysis was used to compare maximum scores between isoform and cognition groups. We assessed whether differences in GC early regime accounted for differences between isoform groups. Kaplan–Meier survival estimation was used to estimate median time to LOA for each isoform group. P value ≤0.05 was considered statistically significant.
Statistical analysis and figure creation for DMD patient analysis was conducted by Dr Deborah Ridout in Stata v 15 StataCorp. 2017. Stata Statistical Software: Release 15. College Station, TX, USA: StataCorp LLC.
Human pathology studies
We studied Dp71 protein expression in normal and DMD skeletal muscle biopsies using Western blot and immunohistochemistry. See Table S1 for sample details. We also studied Dp71 expression in myogenic cells derived either by myogenic conversion of dermal fibroblasts from skin biopsies following transduction by a lentiviral‐mediated MyoD construct carrying a puromycin selection cassette (for transduced cell enrichment) and a DsRed cassette (for assessing transduction efficiency) or from human‐induced pluripotent stem cell (iPSC)‐derived myogenic cells. Human iPSC‐derived myogenic cells are outlined in Table S1 [Sample 13 27 and sample 14 (hpscreg.eu line UCLi011‐A). 28 Sample 14 was differentiated as previously described 29 ].
Proteins from control and DMD cells and muscles were solubilized in lysis buffer (urea 4 M, Tris 125 mM pH 6.8, SDS 4%) containing protease and phosphatase inhibitors (Roche, Merck, Hertfordshire, UK). Protein concentrations were measured using the Pierce BCA Protein assay kit (Thermo Scientific 23225), according to manufacturer instructions.
Capillary Western immunoassay (Wes) analysis was performed on a Wes system (ProteinSimple) according to manufacturer instructions using a 66–440 kDa Separation Module (ProteinSimple). For dystrophin, a rabbit polyclonal anti‐dystrophin antibody (ab15277, dilution 1/50 or ab154168, epitope dilution 1:1000, both from Abcam) and an anti‐rabbit secondary antibody (042‐206, Protein Simple) were used.
For immunocytochemistry, frozen muscle sections were stained with an antibody against the C‐terminus (Dys2, Leica Biosystem, UK) according to standard procedures followed in the diagnostic laboratory. 30
Patients and controls provided written informed consent for biopsy samples. Fibroblasts, iPSCs and muscle tissues were supplied by the MRC Centre for Neuromuscular Disease Biobank London (REC reference number 06/Q0406/33). The human pathology studies were conducted under the REC reference numbers 13/LO/1894 and 13/LO/1826.
Mouse studies
Mice used in this study were maintained at the National Center of Neurology and Psychiatry (NCNP). 31 Three DMD mouse models were studied; mdx (Dp427 absent, Dp140/Dp71 present), mdx52 (Dp427/Dp140 absent, Dp71 present) and DMD‐null (lacking all dystrophin isoforms). 31 , 32 , 33 Mdx52 mice were kindly provided by Dr T. Sasaoka (Brain Research Institute, Niigata University, Niigata, Japan). 33 DMD‐null mice were generated by Dr Kazunori Hanaoka. 32 C57BL/6 control mice were used to match the C57BL/6 background of the 3 DMD mouse models. Genotyping was performed using the previously described PCR method. 31 , 32 , 33 Animal care was provided by the NCNP Small Animal Research Facility. Mice were allowed ad libitum access to food and drinking water. All behavioural experiments were performed between 9:00 am and 1:00 pm in strict accordance with the regulations of the National Institute of Neuroscience and the National Center of Neurology and Psychiatry (Japan) for animal experiments and were approved by the institute's Animal Investigation Committee. GraphPad Prism8 (GraphPad Software Inc., La Jolla, CA, USA) was used for statistical analysis and figure creation.
Four‐limb grip strength
The grip strength test was conducted on wild‐type, mdx, mdx52 and DMD‐null (n = 10 for each group) mice at 3 months of age. Mice were tested to determine peak paw grip strength, positioned horizontally from a grip bar using a grip strength meter (MK‐380 M; Muromachi Kikai Co., Ltd., Japan) as previously described, and pulled back slowly and steadily until mice released their grip. 34 This was repeated six times, and peak force for the four‐limb paws was measured. Grip strength was normalized for mouse body weight measured on the same date as grip strength. The degree of grip fatigue (force‐decline rate) was calculated by comparing the first two and last two pulls. The formula (5th + 6th) / (1st + 2nd) * 100 (%) gives a measure of fatigue.
Rotarod running test
Wild‐type, mdx, mdx52 and DMD‐null (n = 7 for each group) mice at 3 months of age were tested on an accelerating rotarod apparatus (Ugo Basile, Comerio, Italy) set to accelerate from 5 to 45 rpm for 500 s. 35 Time taken for each mouse to either fall off the rod or cling onto it for one complete rotation was recorded. Mice were tested for two more consecutive days, two trials per day. Maximum running time was used for further analysis.
Western blotting
Total protein was extracted from tibialis anterior (TA) muscle and cerebral cortex, including motor area, using SDS buffer with protease inhibitors (Roche, Indianapolis, IN, USA). Lysates were crushed with beads and centrifuged at 14 000 × g for 15 min at 4°C. Supernatant was collected and protein concentrations were determined using a BCA protein assay kit (Thermo Fisher Scientific). After mixing with NuPAGE LDS Sample Buffer (Thermo Fisher Scientific), cell lysates were denatured at 70°C for 10 min, electrophoresed using NuPAGE Novex Tris‐Acetate Gel 3–8% (Invitrogen) at 150 V for 75 min, then transferred to PVDF membranes. Following three washes in PBS‐T, membranes were incubated with ECL western blot substrate (GE Healthcare Life Sciences). Membranes were incubated with primary antibodies, followed by incubation with a secondary antibody. Primary antibodies used were: rabbit anti‐dystrophin (ab15277, Abcam, 1/250; P34a from NCNP, 1/2000 36 ), mouse anti‐ dystrophin (MAB1692, Minneapolis, 1/50; NCL‐DYSA, Leica, 1/250), and mouse anti‐GAPDH (MAB374, Sigma‐Aldrich, 1/100) antibody overnight at 4°C. Secondary antibodies (1/5000) of anti‐mouse or anti‐rabbit IgG horseradish peroxidase (HRP) linked F (ab′)2 fragment (Cytiva) for 60 min at room temperature. Data were analysed with Image Lab 6.0 (Bio‐Rad).
Immunohistochemistry
Dystrophin‐positive revertant fibres were detected by immunohistochemistry. Transverse frozen sections (10 μm thick) from TA muscle were cut using a CryoStar NX70 cryostat (Thermo Fisher Scientific). Serial sections were picked up on poly‐l‐lysine‐coated glass microscope slides and air‐dried for 30 min. Unfixed sections were treated with 0.1% TritonX‐100 for 10 min then blocked in phosphate‐buffered saline (PBS) with 10% bovine serum albumin (BSA) for 1 h at room temperature. Dystrophin was detected with rabbit polyclonal primary antibody against human dystrophin C‐terminal (1/400) in the blocking solution by overnight incubation at 4°C. After three washes with PBS, primary antibody was detected with AlexaFluorTM 488‐conjugated goat anti‐rabbit IgG secondary antibody (1/2000) (Molecular Probes, OR, USA) with 1 h room temperature incubation. Nuclear counterstaining was performed with 4′,6‐diamidino‐2‐phenylindole (DAPI) in a mounting agent (Vectashield; Vector Laboratories, CA, USA). Muscle revertant fibre assessment was performed as previously reported. 37
Results
Duchenne muscular dystrophy boys
Results from the studies in DMD boys are reported below grouped by DMD mutation expected effects on dystrophin isoform expression as follows; Group 1 (Dp427 absent, Dp140/Dp71 present); Group 2 (Dp427/Dp140 absent, Dp71 present); and Group 3 (Dp427/Dp140/Dp71 absent).
Patient characteristics
Of the 387 DMD boys studied, 201 were in Group 1, 152 in Group 2 and 34 in Group 3, Table 1. Group 2 participants had a 6 month earlier mean age of diagnosis than those in Group 1 (P = 0.05, Table 1).
Table 1.
Patient characteristics
| Demographics | |||||
|---|---|---|---|---|---|
| Group 1 (n = 201) | Group 2 (n = 152) | Group 3 (n = 34) | All patients (n = 387) | P value between groups* | |
| Mean (SD) age at diagnosis of DMD (years) G1 n = 171, G2 n = 123, G3 n = 31 | 4.2 (2.0) | 3.6 (2.0) | 3.8 (2.0) | 3.9 (2.0) | 0.05 |
| Mean (SD) age range at baseline (years) | 4.0, 15.4 | 4.0, 12.0 | 4.0, 12.2 | 4.0, 15.4 | |
| GC use | |||||
| Mean (SD) age at initiation (years) G1 = 94, G2 = 71, G3 = 12 | 5.8 (1.4) | 5.5 (1.3) | 6.0 (1.5) | 5.7 (1.5) | 0.22 |
| GC use recorded at any time (n and %) | 189 (94.0%) | 147 (96.7%) | 31 (91.2%) | 367 (94.8%) | 0.32 |
| Majority GC regimen | |||||
| Daily (n and %) | 94 (46.8%) | 78 (51.3%) | 13 (38.2%) | 185 (47.8%) | 0.09 |
| Int/other (n and %) | 85 (42.3%) | 58 (38.2%) | 12 (35.3%) | 155 (40.1%) | |
| None (n and %) | 22 (10.9%) | 16 (10.5%) | 9 (26.5%) | 47 (12.1%) | |
| Ambulatory function at 5 years of age | |||||
| Group 1 (n = 44) Mean (SD) | Group 2 (n = 37) Mean (SD) | Group 3 (n = 9) Mean (SD) | All patients (n = 90) a Mean (SD) | P value between groups* | |
| NSAA score at 5 years of age | 22.6 (5.4) | 21.4 (5.0) | 16.5 (6.7) | 21.5 (5.6) | 0.01 |
| Rise from supine time at 5 years of age (seconds) G1 n = 40, G2 n = 37, G3 n = 9 | 4.9 (2.1) | 4.9 (2.0) | 9.5 (11.5) | 5.4 (4.3) | <0.01 |
| 10 m walk/run time at 5 years of age (seconds) G1 n = 41, G2 n = 29, G3 n = 9 | 6.7 (2.6) | 6.6 (2.4) | 7.0 (2.2) | 6.7 (2.5) | 0.90 |
| Loss of ambulation | |||||
| Group 1 (n = 148) | Group 2 (n = 108) | Group 3 (n = 23) | All patients (n = 279)* | P value between groups* | |
| Median (IQR) age of loss of ambulation (years) | 15.7 (11.7, na) | 13.0 (12.1, 14.9) | 13.6 (12.9, 14.1) | 13.6 (11.8, 16.1) | P = 0.67 |
DMD, Duchenne muscular dystrophy; G1, Group 1; G2, Group 2; G3, Group 3; GC, glucocorticoid; int, intermittent; na, not estimable; NSAA, North Star ambulatory assessment; SD, standard deviation.
Ninety patients had a NSAA recorded between ages 4.5–5.5 years.
P values in this table represent P values for differences in the outcome when compared with isoform group as a whole. P values representing pairwise comparisons of isoform groups are quoted in the text.
Dystrophin isoform grouping in the above table is according to DMD mutation expected effects on dystrophin isoform expression as follows; Group 1 (Dp427 absent, Dp140/Dp71 present); Group 2 (Dp427/Dp140 absent, Dp71 present); and Group 3 (Dp427/Dp140/Dp71 absent).
We did not find a significant difference in age of GC initiation, GC regime or GC use recorded at any time between isoform groups (Table 1). There was a non‐significant trend for Group 3 to be more likely on no GC (P = 0.09, Table 1).
Motor function at 5 years of age
Mean NSAA scores at 5 years were over 6 points lower in Group 3 than Group 1 (P < 0.01) and 4.9 points lower in Group 3 than Group 2 (P = 0.05), with no difference between Groups 1 and 2 (P = 0.99, Table 1). Mean rise from supine times at 5 years were 4.6 s slower in Group 3 than Group 1 (P < 0.01) and 4.6 s slower in Group 3 than in Group 2 (P = 0.01), with no difference between Groups 1 and 2 (P = 0.99). There was no difference in mean 10MWR times at 5 years between isoform groups (P = 0.99).
Peak motor function
Mean NSAA score trajectories peaked between 5.5 and 8.0 years (Figure 1). Therefore, we assessed differences in peak mean NSAA score, 10MWR velocity and rise from supine time velocity in the observed data for those aged 5.5–8.0 years (Table 2).
Figure 1.
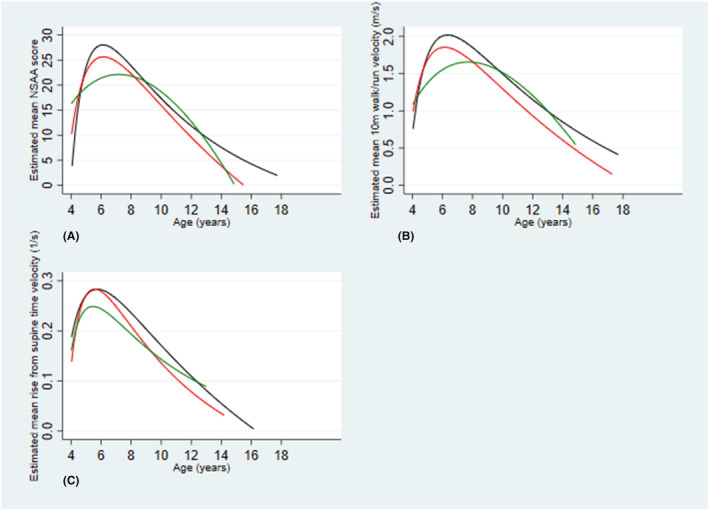
Estimated mean motor outcome trajectory with age models in the dystrophin isoform groups in Duchenne muscular dystrophy (DMD) boys. Dystrophin isoform grouping is according to DMD mutation expected effects on dystrophin isoform expression as follows; Group 1 (Dp427 absent, Dp140/Dp71 present); Group 2 (Dp427/Dp140 absent, Dp71 present); and Group 3 (Dp427/Dp140/Dp71 absent). Each line represents estimated mean motor outcome plotted against age for the dystrophin isoform group. Group 1 = blue, Group 2 = red, Group 3 = green. (A) represents estimated mean NSAA score trajectories with age, (B) represents estimated mean 10MWR velocities with age and (C) represents estimated mean rise from supine time velocities with age. 10 m = ten metre
Table 2.
Mean peak NSAA scores, mean peak 10 m walk/run velocities and mean peak rise from supine time velocities stratified by dystrophin isoform group after adjusting for GC regime
| Group 1 | Group 2 | Group 3 | All groups | |
|---|---|---|---|---|
| Mean (SD) peak NSAA score | 26.6 (5.5) | 25.0 (5.9) | 22.1 (7.1) | 25.6 (5.9) |
| n = 129 | n = 114 | n = 20 | n = 263 | |
| Mean (SD) peak 10 m walk/run velocity overall (m/s) | 2.1 (0.5) | 1.9 (0.6) | 1.7 (0.5) | 2.0 (0.6) |
| n = 121 | n = 108 | n = 18 | n = 247 | |
| Mean (SD) peak rise from supine time velocity overall (rises/s) | 0.29 (0.12) | 0.28 (0.13) | 0.25 (0.12) | 0.28 (0.12) |
| n = 126 | n = 105 | n = 17 | n = 248 |
GC, glucocorticoid; G1, Group 1; G2, Group 2; G3, Group 3.
This table considers the dataset for a subset (n = 263) of boys, aged 5.5–8.0 years, for whom GC regime data and peak North Star ambulatory assessment (NSAA)scores were available for all 262 boys. This subset of 5.5–8.0 years of age was used as this is the age in which the majority of participants reach peak motor function. 20 Dystrophin isoform grouping reported in the above table is according to DMD mutation expected effects on dystrophin isoform expression as follows; Group 1 (Dp427 absent, Dp140/Dp71 present); Group 2 (Dp427/Dp140 absent, Dp71 present); and Group 3 (Dp427/Dp140/Dp71 absent). m/s = metres/second. rises/s = rises/second.
Mean peak NSAA scores were 4.0 points lower in Group 3 than Group 1 (P < 0.01), 2.4 points lower in Group 3 than Group 2 (P = 0.09) and 1.6 points lower in Group 2 than Group 1 (P = 0.04, Table 2).
Mean peak 10MWR velocity was 0.4 m/s [95% confidence interval (CI) 0.2–0.7] slower in Group 3 than Group 1 (P < 0.001) and 0.2 m/s (95% CI (0.05–0.4) slower in Group 2 than Group 1 (P < 0.001, Table 2), and non‐significantly lower in Group 3 compared with Group 2 (P = 0.10, Table 2).
Ages of mean peak NSAA score and 10MWR velocity were not significantly different between isoform groups (Table 2).
Mean peak rise from supine time velocity was 0.04 rises/s slower in Group 3 than Group 1 and 0.03 rises/s slower in Group 3 than Group 2; however, this was not significant (Table 2).
Age at loss of ambulation
Median age of LOA was lower in Groups 2 and 3 than Group 1; however, this did not reach statistical significance (Table 1).
Trajectory models
In NSAA score trajectory with age models, mean NSAA scores were lower in Group 2 than Group 1 and between 4.5 and 8.5 years of age were lower in Group 3 than in Groups 1 and 2 with cumulative effect of loss of isoforms (Figure 1). In 10MWR velocity trajectory with age models, velocities were higher in Group 1 than Groups 2 and 3 with a cumulative effect of loss of isoforms (Figure 1). In mean rise from supine time velocity trajectory with age models, Group 3 had a slower mean rise from supine time velocity than Groups 1 and 2 between approximately 5–11 years of age (Figure 1).
Relationship between isoform group and cognition group
In keeping with previous studies, DMD boys in isoform Groups 2 and 3 were more likely to be in the cognition impaired group than those in Group 1, with a cumulative effect of loss of isoforms (P < 0.001, Table S2). 12 , 16 , 17 , 18 32% (20/63) of boys in Group 1 were in the impaired cognition group, compared with 53% (29/55) in Group 2 and 78% (7/9) in Group 3 (Table S2).
Relationships between cognition group and NSAA scores
We evaluated the influence of cognitive impairment on peak NSAA scores in a subset of 127 boys for whom cognition group, GC regimen and peak NSAA scores were available. Mean peak NSAA scores were 2.2 points lower in those in the impaired cognition group than those in the normal cognition group (P = 0.04, Table S2).
In NSAA trajectory models stratified by cognition group, mean NSAA scores were lower in the impaired cognition group than those in the normal cognition group (Figure S1).
Human pathology studies
Results from the human pathology studies are reported below grouped by DMD mutation expected effects on dystrophin isoform expression as follows; Group 1 (Dp427 absent, Dp140/Dp71 present); Group 2 (Dp427/Dp140 absent, Dp71 present); and Group 3 (Dp427/Dp140/Dp71 absent).
In the Wes studies, a band corresponding to Dp427 was seen in control myogenic cells and muscle, but not DMD cells or DMD muscle (Figure 2). Dp140 expression could not be detected in any samples studied. A band corresponding to Dp71 was seen in control and DMD myogenic cells and muscle from isoform Groups 1 and 2, but not DMD myogenic cells and muscle from patients in isoform Group 3 (Figure 2).
Figure 2.
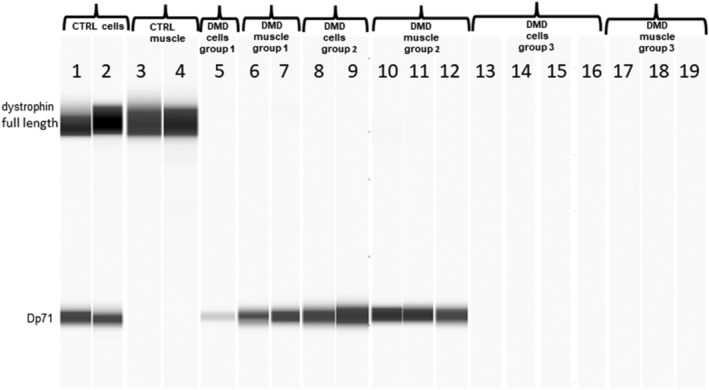
Virtual blot of dystrophin signal detected by Wes using C‐terminus polyclonal anti dystrophin antibodies (Abcam 15277 and 154168). Lanes:1 and 2) control fibroblasts MyoD transduced; 3 and 4) control muscles (CTRL); 5) Duchenne muscular dystrophy (DMD) myotubes Group 1; 6 and 7) DMD muscle Group 1; 8 and 9) DMD fibroblasts MyoD transfected Group 2; 10,11 and 12) DMD muscle Group 2; 13, 14, 15 and 16) DMD cells Group 3; 17,18 and 19 DMD muscle Group 3. All the patient details are summarized in Table S1. Full length dystrophin bands can only be observed in control cells and muscles. Patients with DMD mutations not expected to disrupt Dp71 production showed the Dp71 signal (Groups 1 and 2). No Dp71 bands in Group 3 patients can be detected. Dystrophin isoform grouping is according to DMD mutation expected effects on dystrophin isoform expression as follows; Group 1 (Dp427 absent, Dp140/Dp71 present); Group 2 (Dp427/Dp140 absent, Dp71 present); and Group 3 (Dp427/Dp140/Dp71 absent).
Immunoperoxidase staining of muscle sections
Sarcolemmal staining to C‐terminus dystrophin (Dys2, Novocastra) was present in all control muscle fibres, but no staining was seen in sections from any boys with DMD in dystrophin isoform Groups 1–3, apart from a single fibre in one section from one patient in Group 1 (Figure S2).
Mouse studies
Mouse study results are reported for 3 DMD mouse models; mdx (Dp427 absent, Dp140/Dp71 present), mdx52 (Dp427/Dp140 absent, Dp71 present) and DMD‐null (lacking all dystrophin isoforms). 31 , 32 Average four‐limb grip strength in peak force at 3 months of age was 1.5 g/g lower in mdx52 than mdx mice (P = 0.003) and 1.5 g/g lower in DMD‐null than mdx mice (P = 0.002), with no statistically significant difference between mdx52 and DMD‐null mice (Figure 3A and Table S3). There were no statistically significant differences in grip fatigue and longest‐running time between the DMD mouse models (Figure 3B,C and Table S3). In TA muscle, Dp427 was detected in wild‐type mice and not the DMD mouse models; Dp140 was not detected in any TA muscle studied; and Dp71 was detected in mdx, but not wild‐type, mdx52 or DMD‐null mice by dystrophin western blot using DysA antibody (Figure 3D). In cerebral cortex near the motor area, Dp140 was detected in wild‐type and mdx mice, but not mdx52 or DMD‐null mice, and Dp71 was detected in wild‐type, mdx and mdx52 mice, but not DMD‐null mice, by western blot using P34a antibody (Figure 3D). Revertant fibres were detected in TA muscle in mdx (32 revertant fibres/section) and mdx52 (9 revertant fibres/section) mice, but not DMD‐null mice (Figure 3E).
Figure 3.
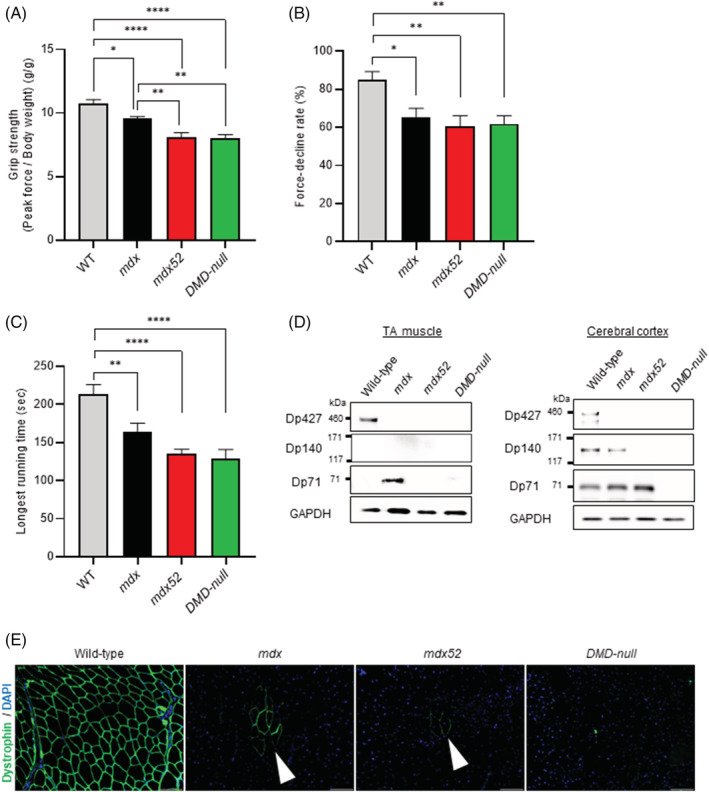
Muscle function and dystrophin expression analysis in wild‐type, mdx (Dp427 absent, Dp140/Dp71 present), mdx52 (Dp427/Dp140 absent, Dp71 present) and DMD‐null (lacking all dystrophin isoforms) mice at the age of 3 months. The data are presented as mean ± SEM. Statistical differences were assessed by one‐way analysis of variance with differences among the groups assessed by a Dunnett comparison. (A) Repeat grip strength testing. P = 0.0166 (wild‐type vs. mdx), P < 0.0001 (wild‐type vs. mdx52), P < 0.0001 (wild‐type vs. DMD‐null), P = 0.0032 (mdx vs. mdx52), P = 0.0023 (mdx vs. DMD‐null). N = 10 (wild‐type), n = 10 (mdx), n = 10 (mdx52) and n = 10 (DMD‐null) (B) force decline rate. P = 0.0139 (wild‐type vs mdx), P = 0.0021 (wild‐type vs mdx52), P = 0.0039 (wild‐type vs DMD‐null). n = 10 (wild‐type), n = 10 (mdx), n = 10 (mdx52) and n = 10 (DMD‐null) (C) Rotarod running test. P = 0.0088 (wild‐type vs. mdx), P < 0.0001 (wild‐type vs. mdx52), P < 0.0001 (wild‐type vs. DMD‐null). n = 7 (wild‐type), n = 7 (mdx), n = 7 (mdx52) and n = 7 (DMD‐null) (D) dystrophin western blot using anti dystrophin antibodies (Abcam 15277, NCL‐DYSA, MAB1692, P34a) and anti‐GAPDH antibodies (as an internal standard) in tibialis anterior (TA) muscle and cerebral cortex, including motor area. n = 1 (wild‐type), n = 1 (mdx), n = 1 (mdx52) and n = 1 (DMD‐null) (E) dystrophin immunochemistry using a C‐terminus polyclonal anti dystrophin antibody (Abcam 15277) in TA muscle. White arrowheads denote revertant fibres. *P < 0.05; **P < 0.01; ***P < 0.001; ****P < 0.0001.
Discussion
We hypothesized that DMD mutations expected to differentially impact on dystrophin isoform production could differentially affect motor function in DMD in humans and mouse models. We stratified motor outcome data from boys with DMD based on the predicted effect of their DMD mutations on three dystrophin isoforms produced in the brain (Dp427, Dp140 and Dp71) and cognitive function. We evaluated production of these three isoforms in normal and DMD myogenic and skeletal muscle from patient's representative of the three isoform groups. Finally, we characterized functional abilities and assessed dystrophin isoform production in muscle and brain in wild‐type and three DMD mouse models with differential production of the three isoforms.
Our results from DMD boys clearly demonstrate marked reductions in motor function at 5 years of age (reduced mean NSAA score and rise from supine time) and peak motor function (reduced mean peak NSAA score and 10MWR velocity) in those lacking Dp140 and Dp71, with a clear cumulative effect of loss of isoforms. Mean peak NSAA score was lower in those with cognitive impairment than those with normal cognition. Differences in NSAA score between isoform groups were considerable, often exceeding the minimally clinically important difference of approximately three points. 38 It is not current practice to stratify clinical trial patients according to expected dystrophin isoform involvement. Clinical trials are increasingly recruiting younger DMD boys aged within the key time points of our study. 39 –42 NSAA scores, rise from supine times and 10MWR times are frequently used as DMD clinical trial outcome measures. 39 –42 Not considering expected effects of DMD mutation type on dystrophin isoform production when recruiting patients to treatment and placebo arms could result in an imbalance of background DMD severity that clouds interpretation of clinical trial results and/or masks treatment effects.
We demonstrated that grip strength in mdx52 and DMD‐null mice was significantly reduced compared with mdx mice. However, we did not detect a significant difference in grip strength between DMD‐null and mdx52 mice. This suggests a strong association between lack of Dp140 and poorer grip strength in DMD mouse models. A recent study identified significant reduction in locomotion of mdx52 compared with mdx mice, further supporting our findings.43 While the lack of additional functional impairment in the DMD‐null compared with the mdx52 is at odds with our clinical findings in the boys expected to be Dp71 deficient, it is interesting to note that deficiency of all DMD isoforms in the mdx3cv mouse is not associated with a more severe learning impairment compared with mdx,44 in sharp contrast with the major effect of Dp71 deficiency on human cognitive function. 12 , 13 , 14 , 15 , 16
Our human and mouse data suggest differences in outcomes between isoform groups are not likely related to an effect of these isoforms on the severity of dystrophic muscle pathology.
We firstly considered whether differences in Dp140 and Dp71 production in skeletal muscle could have determined these functional outcomes, but we discarded this hypothesis.
Regarding Dp140, several studies indicate Dp140 expression is restricted to the brain and developing kidney. 8 , 11 ,45,46 Our study confirms Dp140 absence in all muscle and myogenic cultures studied. As expected, Dp140 deficiency was observed in mdx52 and DMD‐null brain, while Dp140 production was preserved in mdx and wild‐type mouse cortex. We cannot exclude a possible compromised role of Dp140 in motoneuron function contributing to the worse trajectories in Dp140 deficient boys and mice.43 Future neuropathological motoneuron studies with mutations affecting Dp140 would be required to address this. Nevertheless, a major role of Dp140 deficiency on cognitive function has been universally recognized in DMD humans and mouse models. 16 , 17 , 18 ,43,47
Regarding Dp71, Dp71 is expressed more ubiquitously, with transcripts detectable in brain and also skeletal muscle, during fetal development and adult life.48,49 The Dp71 promoter is ubiquitous, and Dp71 is transcribed at similar levels during development and adult life. However, higher protein levels during development suggest a significant degree of Dp71 post‐transcriptional regulation.48 In our studies, Dp71 was produced in small amounts in control and DMD myogenic cells, muscle from DMD boys in isoform Groups 1 and 2 and mdx mouse muscle, but not detected in muscle from wild‐type, mdx52 and DMD‐null mice or DMD patients in isoform Group 3.
Despite the low level detection of Dp71 in muscle in DMD boys and mdx mice using Wes, endogenous Dp71 cannot be visualized at the sarcolemma.49,50 We also could not detect sarcolemmal dystrophin staining in any DMD human muscle studied from the three isoform groups, in keeping with the notion that DMD patients and mdx mice demonstrate absent C‐terminal dystrophin at the sarcolemma. 30 ,49,50 A recent study suggested a tagged Dp71 is expressed in nucleoplasm.51 Sarcolemmal localization of Dp71 can, however, be detected by transgenic experimental studies overexpressing Dp71 in myogenic cell lines52 or on a wild‐type background, where Dp71 overexpression is associated with muscle degeneration resembling muscular dystrophy.53 Dp71 overexpression in mdx mouse muscle is unable to avoid progressive muscle pathology despite partially increasing expression of proteins of the dystrophin associated glycoprotein complex (DAPC).54,55 This likely relates to the fact that while Dp71 binds to the DAPC protein beta dystroglycan, it lacks the Dp427 actin‐binding domain, which is essential for protecting muscle from contraction‐induced damage.
The higher level of Dp71 observed during muscle development and its role during early myogenesis might provide an explanation for Dp71 detection by Wes in DMD and mdx mouse muscle.56 Several studies have suggested a role for Dp71 in myoblast cell proliferation and satellite cell activation,57–59 suggesting that low‐level Dp71 production in DMD muscle is a secondary phenomenon related to the muscle degeneration and regeneration characteristic of this condition.
Finally, we considered the possible role of different amounts of revertant fibres between mouse models. We detected revertant fibres at higher levels in TA muscle in mdx than mdx52 mice, but not in DMD‐null mice, in keeping with previous findings.60 While we cannot exclude a small contribution of this finding to the worse outcome of mdx52, lack of further decrease in grip strength in the DMD‐null, completely lacking revertant fibres, argues against this.
Considering the role of Dp140 and Dp71 in brain function, a plausible explanation for our findings is that the observed differences in motor function could be related to a direct impact of CNS involvement on motor executive function. 12 , 17 , 18 ,61 While the concept of an impact of brain function on motor performance is novel in the DMD field, this is well‐recognized in other conditions. Children with learning disability have been found to have lower locomotor scores than typically developing children.62
Duchenne muscular dystrophy boys exhibit executive function deficits, specifically planning and directing goal oriented behaviour.63 Dp140 negative male participants exhibit slower information processing speeds than Dp140 positive.64 Mdx52 mice exhibit more severe amygdala dependent Pavlovian learning impairment than mdx mice.43
Previous studies have hypothesized a role of the cerebellum and/or the cerebellar thalamic cortical connectivity in DMD cognitive difficulties.63 Dp427, Dp140 and Dp71 are all expressed in adult human cerebellum. 8 The cerebellum plays a crucial role in control of goal‐directed movements and timing of coordinated movement.65 Features of paediatric cerebellar movement dysfunction include gross motor delay and poor coordination with complex movements (with relative sparing of simple motor tasks).66 Of NSAA, rise from supine velocity and 10MWR velocity, NSAA score was the only outcome showing impairment in those expected to lack Dp140 and Dp140/Dp71 at both 5 years and peak motor function. Of these three outcomes, NSAA is the most complex, requiring the highest level of motor coordination and planning.
Taken together, we consider the most plausible explanation of our findings is that the more severe motor impairment in boys and mdx52 mice lacking Dp140 or Dp140/Dp71 are linked to deficits in higher centres of motor control and coordination, with a possible role of deficits in the cerebellum and/or the cerebellar thalamic cortical connectivity.
The strengths of this study include the large patient numbers, ‘real world’ clinical setting of data collection and the longitudinal data. Limitations included some missing data, typical of a real‐world setting, which we nevertheless accounted for statistically.
In summary, we found that DMD mutations expected to lead to deficiency of dystrophin isoforms produced in the brain are associated with poorer motor function in DMD boys and mouse models, with a cumulative effect of loss of isoforms in DMD boys. Given these isoforms' major role in brain function, we hypothesize this could be at least partly related to deficits in higher centres of motor control and coordination in those lacking Dp140 and Dp140/Dp71.
Irrespective of the pathophysiological explanation, our novel findings provide evidence for a relationship between DMD mutation site and its effect on Dp140 and Dp71 production on not only cognitive, but also motor outcomes, with crucial implications for clinical practice and clinical trial design.
Conflicts of interest
Mary Chesshyre, Deborah Ridout, Kate Maresh, Lianne Abbott, Vandana Ayyar Gupta, Marion Main, Yoko Ookubo, Yasumasa Hashimoto, Yoshitsugu Aoki, Silvia Torelli, Giulia Ferrari and Anna Kowala report no financial disclosures or potential conflicts of interest.
Valeria Ricotti—Dr Valeria Ricotti is co‐founder, EVP and CMO of DiNAQOR and shareholder of Solid Biosciences
Adnan Manzur—Dr Adnan Manzur is the clinical lead for the North Star clinical network and is one of the co‐ grant holders from the MDUK for maintenance of the network.
Yung‐Yao Lin—Dr Yung‐Yao Lin has received research funding from Pfizer.
Francesco Saverio Tedesco – Professor Francesco Saverio Tedesco has received speaker and consultancy honoraria from Takeda, Sanofi Genzyme and Aleph Farms (via UCL Consultants)
Mariacristina Scoto—Dr Mariacristina Scoto has received speaker and consultancy honoraria For Roche, Avexis, Santhera and Biogen
Giovanni Baranello—Dr Giovanni Baranello has received speaker and consultancy honoraria from AveXis, Roche, PTC, and Sarepta Therapeutics
Francesco Muntoni—Professor Francesco Muntoni is supported by the NIHR Great Ormond Street Hospital Biomedical Research Centre and has received speaker and consultancy honoraria from Sarepta Therapeutics, Avexis, PTC Therapeutics, Roche and Pfizer.
Ethical guidelines and consent
All authors certify that they comply with the ethical guidelines and publishing in the Journal of Cachexia, Sarcopenia and Muscle.67 Written informed consent was obtained for the collection of all clinical data and human tissue samples and the NorthStar clinical network project has Caldicott Guardian approval. All clinical assessments are conducted according to the principles of the Declaration of Helsinki (2000) and its later amendments and the Principles of Good Clinical Practice. Fibroblasts, iPSCs and muscle tissues were supplied by the MRC Centre for Neuromuscular Disease Biobank London (REC reference number 06/Q0406/33). The human pathology studies were conducted under the REC reference numbers 13/LO/1894 and 13/LO/1826. Animal studies were performed in accordance with the appropriate ethics committee and have therefore been performed with the ethical standards laid down in the 1964 Declaration of Helsinki and its later amendments.
Supporting information
Table S1. Sample type, DMD mutation, location and isoform group for samples used in analysis for Figure 2.
Table S2. Relationships between dystrophin isoform group and cognition group and between cognition group and peak NSAA scores.
Table S3. Mean peak 4‐limb grip strength at 3 months of age, mean force decline rate and mean longest running time in rotarod running test for wild‐type (WT), mdx, mdx52 and DMD‐null mice.
Figure S1. Estimated mean NSAA score trajectory with age models in those with and without cognitive impairment.
Figure S2. Immunoperoxidase staining of muscle sections.
Supplementary references (references 40 to 67).
Acknowledgements
We are grateful to the DMD patients and their families, the North Star clinical network senior clinico‐academic coordinator Dr Vandana Ayyar Gupta, the North Star study coordinator Horeja Njai and the Northstar network leads, Professor Francesco Muntoni (f.muntoni@ucl.ac.uk), Dr Adnan Manzur (adnan.manzur@gosh.nhs.uk) and Dr Giovanni Baranello (g.baranello@ucl.ac.uk). We are grateful to Muscular Dystrophy UK for funding the North Star network, grant Reference 16NMDB‐DB60‐0004‐5. We are grateful and acknowledge all the members of the NorthStar network, including the following: Royal Belfast Hospital: Sandya Tirupathi, Melanie Douglas and Grainne Nic Fhirleinn; Birmingham Heartlands Hospital: Deepak Parasuraman, Zoya Alhaswani, Heather McMurchie and Rosanna Rabb; Birmingham Children's Hospital: Tracey Willis, Elizabeth Wright, Claire Rylance and Nicola Birchall; Frenchay Hospital, Bristol: Anirban Majumdar and Faye Mason; University Hospital of Wales, Cardiff: Kate Skone, Frances Gibbon and Bethan Parsons; Armitstead Child Development Centre, Dundee: Karen Naismith, Gavin Cobb and Julie Burslem; Royal Hospital for Sick Children, Edinburgh: Alex Baxter and Clare Eadie; Royal Hospital for Sick Children, Glasgow: Iain Horrocks, Marina Di Marco and Sarah Brown; Yorkshire Regional Muscle Clinic at Leeds General Infirmary: Anne‐Marie Childs, Karen Pysden, Lindsey Pallant and Tiffany Small; Alder Hey Hospital; Stefan Spinty, Allison Shillington and Sarah Gregson; Evelina Children's Hospital: Elizabeth Wraige, Heinz Jungbluth, Miguel Fernandez, Vasantha Gowda and Jennie Sheehan; Dubowitz Neuromuscular Centre: Francesco Muntoni, Adnan Manzur, Giovanni Baranello, Marion Main, Lianne Abbott and Vic Selby; Royal Manchester Children's Hospital: Imelda Hughes, Sinead Warner and Emily Davies; Institute of Genetic Medicine, Newcastle: Volker Straub, Chiara Marini‐Bettolo, Michela Guglieri, Anna Mayhew, Meredith James, Jassi Sodhi; Queens Medical Centre, Nottingham: Gabby Chow and Sarah Williamson; The Muscle Clinic, Robert Jones and Agnes Hunt Orthopaedic Hospital, Oswestry: Tracey Willis, Richa Kulshrestha, Nicholas Emery and Kate Strachan; Oxford Children's Hospital: Sithara Ramdas, Laurent Servais and Hayley Ramjattan; Royal Preston Hospital: Christian De Goede and Andrea Selley; Sheffield Children's Hospital: Min Ong, Tony Hart and Kay White; Southampton General Hospital: Neil Thomas, Marjorie Illingworth, Michelle Geary, Jenni Palmer; Morriston Hospital, Swansea: Cathy White and Kate Greenfield; Leicester Royal Infirmary: Gemunu Hewawitharana and Yvonne Julien; Royal Aberdeen Children's Hospital: Elma Stephen and Jane Tewnion; Addenbrooke's Hospital: Gautam Ambegaonkar, Deepa Krishnakumar, Jacqui Taylor and Catherine Ward; Plymouth Child Development Centre: Kayal Vijayakumar and Claire Frimpong‐Ansah.
We are grateful to Cyrille Vaillend (Neuroscience Paris‐Saclay Institute (Neuro‐PSI), UMR 9197, Université Paris Sud, CNRS, Université Paris Saclay, 91190 Orsay, France) for his helpful review of and feedback on the manuscript and to Sumitava Dastidar for help with cell cultures.
The support of L'Association Française contre les Myopathies for the ‘Outcome measures in Duchenne Muscular Dystrophy: A Natural History Study: Imaging and Neuropsychology Sub‐study’ is gratefully acknowledged. The support of Great Ormond Street Hospital Children's Charity for ‘A Study of Emotional Function in Duchenne Muscular Dystrophy (EmoDe Study)’ is gratefully acknowledged. Kate Maresh was supported by the Medical Research Council (MRC) via the MRC Centre for Neuromuscular Diseases, Institute of Neurology, University College London grant no. MR/K000608/1.
The support of Great Ormond Street Hospital Children's Charity and the NIHR GOSH biomedical research centre (BRC) for the ‘Neurodevelopmental, emotional, and behavioural problems in Duchenne muscular dystrophy in relation to underlying dystrophin gene mutations’ study is gratefully acknowledged. 19
This work is supported by the NIHR GOSH BRC. The views expressed are participants of the author(s) and not necessarily participants of the NHS, the NIHR or the Department of Health.
The support of EUH2020 grant 847826 Brain Involvement iN Dystrophinopathies, European Research Council (759108), Muscular Dystrophy UK (RA4/3023/1) and the National Institute for Health Research (CL‐2018‐18‐008) is also gratefully acknowledged.
Anna Kowala and Yung‐Yao Lin were supported by the Barts Charity grant (MGU0426).
Chesshyre M., Ridout D., Hashimoto Y., Ookubo Y., Torelli S., Maresh K., Ricotti V., Abbott L., Gupta V. A., Main M., Ferrari G., Kowala A., Lin Y.‐Y., Tedesco F. S., Scoto M., Baranello G., Manzur A., Aoki Y., and Muntoni F. (2022) Investigating the role of dystrophin isoform deficiency in motor function in Duchenne muscular dystrophy, Journal of Cachexia, Sarcopenia and Muscle, 13, 1360–1372, 10.1002/jcsm.12914
References
- 1. Darras BT, Jones HR, Ryan MM, De Vivo DC. In Darras BT, Md JJ, eds. Neuromuscular disorders of infancy, childhood, and adolescence: a clinician's approach, Second ed. London: Academic Press; 2015. [Google Scholar]
- 2. Mercuri E, Bönnemann CG, Muntoni F. Muscular dystrophies. Lancet 2019;394:2025–2038. [DOI] [PubMed] [Google Scholar]
- 3. Walter MC, Reilich P. Recent developments in Duchenne muscular dystrophy: facts and numbers. J Cachexia Sarcopenia Muscle 2017;8:681–685. [DOI] [PMC free article] [PubMed] [Google Scholar]
- 4. Anthony K, Arechavala‐Gomeza V, Ricotti V, Torelli S, Feng L, Janghra N, et al. Biochemical characterization of patients with in‐frame or out‐of‐frame DMD deletions pertinent to exon 44 or 45 skipping. JAMA Neurol 2014. [cited 2018 Feb 25;71:32–40, Available from: 10.1001/jamaneurol.2013.4908 [DOI] [PubMed] [Google Scholar]
- 5. Heydemann A, Ceco E, Lim JE, Hadhazy M, Ryder P, Moran JL, et al. Latent TGF‐beta‐binding protein 4 modifies muscular dystrophy in mice. J Clin Invest 2009. Dec;119:3703–3712. [DOI] [PMC free article] [PubMed] [Google Scholar]
- 6. Vetrone SA, Montecino‐Rodriguez E, Kudryashova E, Kramerova I, Hoffman EP, Liu SD, et al. Osteopontin promotes fibrosis in dystrophic mouse muscle by modulating immune cell subsets and intramuscular TGF‐beta. J Clin Invest 2009;119:1583–1594, http://ovidsp.ovid.com/ovidweb.cgi?T=JS&PAGE=reference&D=med6&NEWS=N&AN=19451692 [DOI] [PMC free article] [PubMed] [Google Scholar]
- 7. Bello L, Pegoraro E. The “usual suspects”: genes for inflammation, fibrosis, regeneration, and muscle strength modify duchenne muscular dystrophy. J Clin Med 2019. May;8:649. [DOI] [PMC free article] [PubMed] [Google Scholar]
- 8. Doorenweerd N, Mahfouz A, van Putten M, Kaliyaperumal R, T' Hoen PAC, Hendriksen JGM, et al. Timing and localization of human dystrophin isoform expression provide insights into the cognitive phenotype of Duchenne muscular dystrophy. Sci Rep 2017. Oct;7:12575. [DOI] [PMC free article] [PubMed] [Google Scholar]
- 9. Holder E, Maeda M, Bies RD. Expression and regulation of the dystrophin Purkinje promoter in human skeletal muscle, heart, and brain. Hum Genet 1996. Feb;97:232–239. [DOI] [PubMed] [Google Scholar]
- 10. Muntoni F, Torelli S, Ferlini A. Dystrophin and mutations: one gene, several proteins, multiple phenotypes. Lancet Neurol 2003. Dec;2:731–740. [DOI] [PubMed] [Google Scholar]
- 11. Bar S, Barnea E, Levy Z, Neuman S, Yaffe D, Nudel U. A novel product of the Duchenne muscular dystrophy gene which greatly differs from the known isoforms in its structure and tissue distribution. Biochem J [Internet] 1990. Dec 1;272:557–560, Available from: https://pubmed.ncbi.nlm.nih.gov/2176467 [DOI] [PMC free article] [PubMed] [Google Scholar]
- 12. Daoud F, Angeard N, Demerre B, Martie I, Benyaou R, Leturcq F, et al. Analysis of Dp71 contribution in the severity of mental retardation through comparison of Duchenne and Becker patients differing by mutation consequences on Dp71 expression. Hum Mol Genet 2009. Oct;18:3779–3794. [DOI] [PubMed] [Google Scholar]
- 13. Moizard MP, Toutain A, Fournier D, Berret F, Raynaud M, Billard C, et al. Severe cognitive impairment in DMD: obvious clinical indication for Dp71 isoform point mutation screening. Eur J Hum Genet 2000. Jul;8:552–556. [DOI] [PubMed] [Google Scholar]
- 14. Moizard MP, Billard C, Toutain A, Berret F, Marmin N, Moraine C. Are Dp71 and Dp140 brain dystrophin isoforms related to cognitive impairment in Duchenne muscular dystrophy? Am J Med Genet 1998;80:32–41, http://ovidsp.ovid.com/ovidweb.cgi?T=JS&PAGE=reference&D=med4&NEWS=N&AN=9800909 [DOI] [PubMed] [Google Scholar]
- 15. Lenk U, Hanke R, Thiele H, Speer A. Point mutations at the carboxy terminus of the human dystrophin gene: implications for an association with mental retardation in DMD patients. Hum Mol Genet 1993. Nov;2:1877–1881. [DOI] [PubMed] [Google Scholar]
- 16. Ricotti V, Mandy WPL, Scoto M, Pane M, Deconinck N, Messina S, et al. Neurodevelopmental, emotional, and behavioural problems in Duchenne muscular dystrophy in relation to underlying dystrophin gene mutations. Dev Med Child Neurol 2016. Jan;58:77–84. [DOI] [PubMed] [Google Scholar]
- 17. Felisari G, Martinelli Boneschi F, Bardoni A, Sironi M, Comi GP, Robotti M, et al. Loss of Dp140 dystrophin isoform and intellectual impairment in Duchenne dystrophy. Neurology 2000. Aug;55:559–564. [DOI] [PubMed] [Google Scholar]
- 18. Taylor PJ, Betts GA, Maroulis S, Gilissen C, Pedersen RL, Mowat DR, et al. Dystrophin gene mutation location and the risk of cognitive impairment in Duchenne muscular dystrophy. PLoS ONE 2010. Jan;5:e8803. [DOI] [PMC free article] [PubMed] [Google Scholar]
- 19. Ricotti V, Ridout AD, Scott E, Quinlivan R, Robb AS, Manzur YA, et al. Long‐term benefits and adverse effects of intermittent versus daily glucocorticoids in boys with Duchenne muscular dystrophy. J Neurol Neurosurg Psychiatry 2012;84:698–705. [DOI] [PubMed] [Google Scholar]
- 20. Muntoni F, Domingos J, Manzur AY, Mayhew A, Guglieri M, Sajeev G, et al. Categorising trajectories and individual item changes of the North Star Ambulatory Assessment in patients with Duchenne muscular dystrophy. PLoS ONE 2019;14:e0221097. [DOI] [PMC free article] [PubMed] [Google Scholar]
- 21. Scott E, Eagle M, Mayhew A, Freeman J, Main M, Sheehan J, et al. Development of a functional assessment scale for ambulatory boys with Duchenne muscular dystrophy. Physiother Res Int 2012. Jun;17:101–109. [DOI] [PubMed] [Google Scholar]
- 22. Doorenweerd N, Straathof CS, Dumas EM, Spitali P, Ginjaar IB, Wokke BH, et al. Reduced cerebral gray matter and altered white matter in boys with Duchenne muscular dystrophy. Ann Neurol 2014;76:403–411. [DOI] [PubMed] [Google Scholar]
- 23. Maresh K, Papageorgiou A, Ridout D, Harrison NA, Mandy W, Skuse D, et al. Startle responses in Duchenne muscular dystrophy: a novel biomarker of brain dystrophin deficiency. medRxiv [Internet]. 2021;2021.09.16.21263132. Available from: http://medrxiv.org/content/early/2021/09/22/2021.09.16.21263132.abstract [DOI] [PMC free article] [PubMed]
- 24. Combs D, Edgin JO, Klewer S, Barber BJ, Morgan WJ, Hsu C‐H, et al. OSA and neurocognitive impairment in children with congenital heart disease. Chest 2020. Sep;158:1208–1217. [DOI] [PMC free article] [PubMed] [Google Scholar]
- 25. Jenni OG, Fintelmann S, Caflisch J, Latal B, Rousson V, Chaouch A. Stability of cognitive performance in children with mild intellectual disability. Dev Med Child Neurol 2015. May;57:463–469. [DOI] [PubMed] [Google Scholar]
- 26. Royston PAD. Regression using fractional polynomials of continuous covariates: parsimonious parametric modelling. Appl Stat 1994;43:429. [Google Scholar]
- 27. Paredes‐Redondo A, Harley P, Maniati E, Ryan D, Louzada S, Meng J, et al. Optogenetic modeling of human neuromuscular circuits in Duchenne muscular dystrophy with CRISPR and pharmacological corrections. Sci Adv 2021. Sep;7:eabi8787. [DOI] [PMC free article] [PubMed] [Google Scholar]
- 28. Ferrari G, Muntoni F, Tedesco FS. Generation of two genomic‐integration‐free DMD iPSC lines with mutations affecting all dystrophin isoforms and potentially amenable to exon‐skipping. Stem Cell Res 2020. Mar;43:101688. [DOI] [PMC free article] [PubMed] [Google Scholar]
- 29. Maffioletti SM, Gerli MFM, Ragazzi M, Dastidar S, Benedetti S, Loperfido M, et al. Efficient derivation and inducible differentiation of expandable skeletal myogenic cells from human ES and patient‐specific iPS cells. Nat Protoc 2015. Jul;10:941–958. [DOI] [PubMed] [Google Scholar]
- 30. Dubowitz V, Caroline Sewry AO. Muscle biopsy a practial approach, 5th ed. Elsevier; 2020. [Google Scholar]
- 31. Bulfield G, Siller WG, Wight PA, Moore KJ. X chromosome‐linked muscular dystrophy (mdx) in the mouse. Proc Natl Acad Sci U S A 1984;81:1189–1192. [DOI] [PMC free article] [PubMed] [Google Scholar]
- 32. Kudoh H, Ikeda H, Kakitani M, Ueda A, Hayasaka M, Tomizuka K, et al. A new model mouse for Duchenne muscular dystrophy produced by 2.4 Mb deletion of dystrophin gene using Cre‐loxP recombination system. Biochem Biophys Res Commun 2005. Mar;328:507–516. [DOI] [PubMed] [Google Scholar]
- 33. Araki E, Nakamura K, Nakao K, Kameya S, Kobayashi O, Nonaka I, et al. Targeted disruption of exon 52 in the mouse dystrophin gene induced muscle degeneration similar to that observed in Duchenne muscular dystrophy. Biochem Biophys Res Commun 1997. Sep;238:492–497. [DOI] [PubMed] [Google Scholar]
- 34. De Luca, A Sezione di Farmacologia, Dipartimento Farmacobiologico, Facoltà di Farmacia, Università di Bari I and the T‐N working group . Use of grip strength meter to assess the limb strength of mdx mice. DMD_M.2.2.001 version 2.0 [Internet]. Treat NMD neuromuscular network. 2019. [2021 Apr 11]. https://treat‐nmd.org/wp‐content/uploads/2016/08/MDX‐DMD_M.2.2.001.pdf
- 35. Aartsma‐Rus A, van Putten M. Assessing functional performance in the mdx mouse model. J Vis Exp 2014;85:51303. [DOI] [PMC free article] [PubMed] [Google Scholar]
- 36. Mizuno Y, Yoshida M, Yamamoto H, Hirai S, Ozawa E. Distribution of dystrophin isoforms and dystrophin‐associated proteins 43DAG (A3a) and 50DAG (A2) in various monkey tissues. J Biochem 1993. Dec;114:936–941. [DOI] [PubMed] [Google Scholar]
- 37. Yokota T, Lu Q‐L, Morgan JE, Davies KE, Fisher R, Takeda S, et al. Expansion of revertant fibers in dystrophic mdx muscles reflects activity of muscle precursor cells and serves as an index of muscle regeneration. J Cell Sci 2006;119:2679–2687. [DOI] [PubMed] [Google Scholar]
- 38. Muntoni F, Manzur A, Mayhew A, Signorovitch J, Sajeev G, Yao Z, et al. P.299 minimal detectable change in the north star ambulatory assessment (NSAA) in Duchenne muscular dystrophy (DMD). Neuromuscul Disord 2018;28:S121. [Google Scholar]
- 39.Sarepta Therapeutics I. A Randomized, Double‐blind, Placebo‐controlled Study of SRP‐9001 for Duchenne Muscular Dystrophy (DMD) [Internet]. Clinicaltrials.gov [www.clinicaltrials.gov]. 2018 [cited 2021 Oct 5]. Available from: https://clinicaltrials.gov/ct2/show/NCT03769116?term=srp‐9001&draw=2&rank=2
Associated Data
This section collects any data citations, data availability statements, or supplementary materials included in this article.
Supplementary Materials
Table S1. Sample type, DMD mutation, location and isoform group for samples used in analysis for Figure 2.
Table S2. Relationships between dystrophin isoform group and cognition group and between cognition group and peak NSAA scores.
Table S3. Mean peak 4‐limb grip strength at 3 months of age, mean force decline rate and mean longest running time in rotarod running test for wild‐type (WT), mdx, mdx52 and DMD‐null mice.
Figure S1. Estimated mean NSAA score trajectory with age models in those with and without cognitive impairment.
Figure S2. Immunoperoxidase staining of muscle sections.
Supplementary references (references 40 to 67).