

Abstract
Background
Precision nutrition is highly topical. However, no studies have explored the interindividual variability in response to nutrition interventions for sarcopenia. The purpose of this study was to determine the magnitude of interindividual variability in response to two nutrition supplementation interventions for sarcopenia and metabolic health, after accounting for sources of variability not attributable to supplementation.
Methods
A 24 week, randomized, double‐blind, placebo‐controlled trial tested the impact of leucine‐enriched protein (LEU‐PRO), LEU‐PRO plus long‐chain n‐3 PUFA (LEU‐PRO+n‐3) or control (CON) supplementation in older adults (n = 83, 71 ± 6 years) at risk of sarcopenia. To estimate the true interindividual variability in response to supplementation (free of the variability due to measurement error and within‐subject variation), the standard deviation of individual responses (SDR) was computed and compared with the minimally clinically important difference (MCID) for appendicular lean mass (ALM), leg strength, timed up‐and‐go (TUG), and serum triacylglycerol (TG) concentration. Clinically meaningful interindividual variability in response to supplementation was deemed to be present when the SDR positively exceeded the MCID. The probability that individual responses were clinically meaningful, and the phenotypic, dietary, and behavioural determinants of response to supplementation were examined.
Results
The SDR was below the MCID for ALM (LEU‐PRO: −0.12 kg [90% CI: −0.38, 0.35], LEU‐PRO+n‐3: −0.32 kg [−0.45, 0.03], MCID: 0.21 kg), TUG (LEU‐PRO: 0.58 s [0.18, 0.80], LEU‐PRO+n‐3: 0.73 s [0.41, 0.95], MCID: 0.9 s) and TG (LEU‐PRO: −0.38 mmol/L [−0.80, 0.25], LEU‐PRO+n‐3: −0.44 mmol/L [−0.63, 0.06], MCID: 0.1 mmol/L), indicating no meaningful interindividual variability in response to either supplement. The SDR exceeded the MCID (19 Nm) for strength in response to LEU‐PRO (25 Nm [−29, 45]) and LEU‐PRO+n‐3 (23 Nm [−29, 43]) supplementation but the effect was uncertain, evidenced by wide confidence intervals. In the next stage of analysis, similar proportions of participant responses were identified as very likely, likely, possibly, unlikely, and very unlikely to represent clinically meaningful improvements across the LEU‐PRO, LEU‐PRO+n‐3, and CON groups (P > 0.05). Baseline LC n‐3 PUFA status, habitual protein intake, and numerous other phenotypic and behavioural factors were not determinants of response to LEU‐PRO or LEU‐PRO+n‐3 supplementation.
Conclusions
Applying a novel, robust methodological approach to precision nutrition, we show that there was minimal interindividual variability in changes in ALM, muscle function, and TG in response to LEU‐PRO and LEU‐PRO+n‐3 supplementation in older adults at risk of sarcopenia.
Keywords: Sarcopenia, Protein, Leucine, Fish oil, Interindividual variability, Personalized nutrition
Introduction
Precision nutrition is at the forefront of the NIHs Strategic Plan for Nutrition Research, designed to address the challenge wherein interindividual variability in responses to standardized nutrition and exercise interventions have been documented for decades. 1 , 3 A multitude of inherited and acquired characteristics, including an individual's baseline phenotype, genotype, habitual diet, and behaviours may modify the effect of an intervention, making it more or less beneficial, detrimental or ineffective in different people. 4 For this reason, conventional group‐based studies that focus on mean responses are limited. In an endeavour to develop personalized, more effective interventions, an increasing number of studies attempt to characterize the interindividual variability in responsiveness and/or the determinants of response to nutrition or exercise‐based interventions.
Recently, biostatisticians in the exercise science field have challenged the validity of previous approaches used to demonstrate the existence of interindividual variability in response to exercise training interventions. 4 , 5 These previous approaches assume that the interindividual variability in the observed responses in the intervention group is a consequence of interindividual variability resulting from the exercise training alone, erroneously ignoring differences in response due to measurement error and/or within‐subject variability. Within‐subject variability is the variability attributable to changes in the outcome due to chronic biological, behavioural, or environmental changes unrelated to the intervention including, but not limited to, sleep, dietary intake, physical activity patterns, and stress. 4 , 5 Importantly, in longer‐term interventions lasting several months or more, within‐subject random variation can be so large it may explain most or all of the apparent interindividual variability in response to the intervention. 5 Although these criticisms have, thus far, been directed at exercise intervention studies, it is probable that they are applicable to many nutrition interventions that propose to demonstrate interindividual variability in response to dietary interventions but neglect to account for the substantial influence of random within‐subject variation and, in some cases, also measurement error. 3 , 6 , 7 , 8 , 9 Exercise science biostatisticians have proposed a new analytical approach for parallel‐group randomized controlled trials whereby the standard deviation of individual responses (SDR) can be used to isolate and quantify the magnitude of the interindividual variability in responses due to the exercise intervention per se through comparisons of the response variability in the intervention group and the control group. 4 , 5 , 10
We recently investigated the impact of a nutritional intervention on indices of sarcopenia and metabolic health, involving supplementation with leucine‐enriched protein (LEU‐PRO) alone and in combination with long chain n‐3 polyunsaturated fatty acids (LEU‐PRO+n‐3), in older men and women at risk of sarcopenia. 11 Based on the precision nutrition paradigm, a follow‐up, exploratory objective was to investigate the interindividual variability in response. Notwithstanding the lack of beneficial effect of supplementation on appendicular lean mass (ALM), strength and physical performance at the group level, and the small reduction in serum triacylglycerol (TG) in the LEU‐PRO+n‐3 group, 11 it is possible that some individuals in the cohort may have responded to a greater degree than reflected by the group means, potentially due to their baseline protein intake, LC n‐3 PUFA status or other phenotypic or behavioural characteristics.
Thus, the objectives of this secondary analysis were (i) to apply the new statistical methods developed in the exercise science field to determine the existence and magnitude of true interindividual variability in the ALM, strength, physical performance, and serum TG responses to LEU‐PRO and LEU‐PRO+n‐3 supplementation in older adults at risk of sarcopenia, after accounting for differences in response due to measurement error and random within‐subject variation; (ii) to categorize the individual responses as very likely, likely, possibly, unlikely, or very unlikely to represent a clinically meaningful improvement or adverse change; (iii) to explore whether phenotypic, dietary, and other behavioural factors are determinants of the individual responses to LEU‐PRO or LEU‐PRO+n‐3 supplementation; and (iv) to characterize the metabolomic responses to the supplementation interventions.
Methods
Design and participants
Details of the ethical approval, design, and primary findings of the trial (NCT03429491) have been published elsewhere. 11 Briefly, we conducted a 24 week, randomized, double‐blind, 3‐arm parallel‐group, placebo‐controlled trial in community‐dwelling older adults. The principal objective of the original investigation was to test the hypotheses that appendicular lean mass (ALM), strength, physical performance, and myofibrillar protein synthesis would increase in older adults supplemented with LEU‐PRO and that the addition of LC n‐3 PUFA supplementation would further enhance the positive effects of LEU‐PRO supplementation on these outcomes. Participants were eligible if they were ≥65 years of age, were at risk of sarcopenia as defined by being pre‐sarcopenic, sarcopenic, or dynapenic (low handgrip strength) according to the European Working Group on Sarcopenia in Older People 2010 (EWGSOP1) criteria. 12 In line with the EWGSOP1 criteria, low handgrip strength was defined as <20 kg in women, <30 kg in men and low skeletal muscle mass was determined by bioelectrical impedance analysis (BIA) and defined using the Janssen cut‐offs 13 of ≤6.75 kg/m2 in women, and ≤10.75 kg/m2 in men. Participant inclusion criteria were based on the EWGSOP1 criteria rather than the updated 2019 EWGSOP2 criteria as the latter were published after recruitment and the majority of the data collection were complete.
Participants were randomized to receive either the control (CON) supplement or one of the two intervention supplements: LEU‐PRO or LEU‐PRO+n‐3. The primary outcome was appendicular lean mass (ALM) measured by dual‐energy X‐ray absorptiometry (DXA). Secondary outcomes relevant to the current analysis were lower extremity muscle strength, physical performance, BMI, fat mass, daily step count, dietary intake, erythrocyte phospholipid fatty acid composition, and biochemical markers of metabolic health and renal function [fasting concentrations of serum TG, total cholesterol, high‐density lipoprotein (HDL) cholesterol, creatinine, urea, cystatin c, glucose, high sensitivity C‐reactive protein (hsCRP), insulin, insulin‐like growth factor 1 (IGF‐1), plasma total and high molecular weight (HMW) adiponectin, and total 25(OH)D), and estimated glomerular filtration rate (eGFR)].
Of those individuals originally randomized (n = 107), participants were excluded from this secondary analysis if they did not complete the 24 week trial (n = 23) or violated the study protocol (n = 1). This resulted in a final sample of 83 participants in the current analysis (Supporting Information, Figure S1). Sample size for the trial was determined based on the primary analysis of group‐based differences. As reported previously, we calculated that a sample size of 104 would be required for the analysis of group‐based differences at alpha level of 0.05 and beta level of 0.80, with the assumption that there would be a ~20% dropout rate in all groups (G*Power v3.1). As the current analysis of interindividual variability is exploratory, no power calculations were performed.
Nutritional intervention
The supplements were taste‐matched and energy‐matched and were manufactured by Smartfish (Norway). Per serving, the LEU‐PRO and LEU‐PRO+n‐3 supplements contained 10.6 g whey protein and 3.1 g total leucine, whereas the LEU‐PRO+n‐3 supplement also contained 0.8 g EPA and 1.1 g DHA. Full compositional details of supplements (CON, LEU‐PRO, and LEU‐PRO+n‐3) are shown in Table S1. To supplement lower protein meals, participants were asked to consume two of their supplements per day: one directly before breakfast and the other directly before their second light meal of the day (lunch or evening meal depending on the individual's meal pattern).
Body composition, strength, physical performance, and metabolic markers
Appendicular lean mass and fat mass were evaluated via DXA (GE‐LUNAR iDXA, Aymes Medical). Skeletal muscle biopsies were performed in n = 33 participants on the non‐dominant vastus lateralis 72 h and ~1 h prior to DXA scanning. This resulted in variable degree of local muscle oedema which had the potential to impact ALM values. Therefore, ‘adjusted’ ALM was calculated in all participants (including those who underwent biopsies and those who did not) by summing lean soft tissue in the arms plus the dominant leg. Isometric knee extensor peak torque and isometric knee flexor peak torque at 90° of knee flexion, and isokinetic knee extensor peak torque at 60°/s and at 120°/s were measured on the dominant leg using a dynamometer (Cybex NORM, Humac, USA), as described previously. 11 Composite leg strength was calculated as the sum of the four peak torque measurements. TUG performance was assessed twice, with the average used in the analysis. Biochemical measurements were measured as described previously. 11
Diet, physical activity, and compliance
Participants wore a pedometer (Piezo SC‐StepX™, StepsCount, Canada) to measure their daily step count for 3 days immediately before their PRE‐intervention and POST‐intervention visits. Dietary intake was assessed via a 24 h recall performed by a research dietitian or nutritionist using the five‐step multiple‐pass method at PRE‐intervention and POST‐intervention visits. Compliance was assessed via supplement logs.
Metabolomics
To gain further insight into the metabolic effects of the nutritional supplements, metabolomics analyses of PRE‐intervention and POST‐intervention serum samples were performed using nuclear magnetic resonance (NMR) spectroscopy and gas chromatography–mass spectrometry (GC–MS). For GC–MS analysis, plasma amino acid concentrations were determined using the Phenomenex EZfaast™ (Phenomenex, Cheshire, United Kingdom) amino acid analysis kit, as per the manufacturer's instructions. Details of NMR analyses are provided in the Supporting Information.
Statistical analyses
Group responses among the participants included in this secondary analysis were summarized using a linear mixed model with group (CON, LEU‐PRO, and LEU‐PRO+n‐3) as a fixed factor, participants as a random factor, and PRE‐intervention value as a covariate. Contrasts were constructed to estimate the differences between CON and the two intervention groups POST‐intervention, with PRE‐intervention values as covariate. For all analyses, significance was accepted at P < 0.05. Analyses were performed using SPSS except for the NMR data (version 24.0, Chicago, IL, USA).
Analysis of variability in individual responses to LEU‐PRO and LEU‐PRO+n‐3 supplementation
To quantify interindividual variability in response to LEU‐PRO and LEU‐PRO+n‐3 supplementation, the variation due to random measurement error and within‐subject variability was separated from the variation derived from LEU‐PRO/LEU‐PRO+n‐3 supplementation per se by using the following equation described by Atkinson and Batterham 5 : SDR = √((SDΔI)2 − (SDΔC)2). In this equation, SDΔI and SDΔC represent the SD values of the change (from PRE‐intervention to POST‐intervention) in the intervention (LEU‐PRO or LEU‐PRO+n‐3) and CON groups, respectively. SDR (the standard deviation of individual responses) estimates the true interindividual variation in response to supplementation (LEU‐PRO or LEU‐PRO+n‐3) by removing the observed variability in the time‐matched CON arm (which provides an estimate of the variability due to measurement error and within‐subject variation) from the intervention arms. If the SDR is positive and greater than a pre‐specified minimally clinically important difference (MCID), this indicates that there is clinically meaningful interindividual variability in response to the intervention (LEU‐PRO/LEU‐PRO+n‐3 supplementation in this case). For TUG performance, we used the MCID estimated previously at 0.9 s. 14 For TG concentrations, we set the MCID at 0.1 mmol/L based on evidence that a 0.1 mmol/L reduction in TG concentrations is associated with a 5% decrease in coronary events. 15 In the absence of a universally accepted MCID for adjusted ALM and composite leg strength, we considered the MCID to be equivalent to the expected age‐related decline over a 2 year period (e.g. ~1.6% for adjusted ALM, 16 ~6% for composite strength 16 ). Based on the PRE‐intervention cohort means, this translated to an MCID 0.21 kg for adjusted ALM and 19 Nm for composite strength. Upper and lower 90% confidence intervals were calculated for each SDR according to the equation recommended by Hopkins. 4
Classification of individual responses
The probability that true individual responses were greater than the MCID after adjusting for the typical error of measurement were calculated for each individual and categorized as ‘very unlikely’ = <5% chance, ‘unlikely’ = 5–24% chance, ‘possibly’ = 25–74% chance, ‘likely’ = 75–94% chance, or ‘very likely’ = 95–100% chance using an open access excel spreadsheet developed by Hopkins. 17 Typical error of the measurement is due to technical error introduced by instrumentation and/or tester reliability and the random day‐to‐day variability in biological factors capable of altering the measured outcome variable (e.g. the individual's psychological and/or physical state at the time of testing). 18 Typical error of the measurement was calculated as TE = (SDΔC)/√2. 18 , 19 The proportion of participants with responses that were very likely, likely, possibly, unlikely, and very unlikely to represent clinically meaningful (i) improvement responses and (ii) adverse responses were compared across groups using a Kruskal–Wallis H‐test.
Analysis of determinants of individual variability in responses to LEU‐PRO and LEU‐PRO+n‐3 supplementation
To assess potential determinants of interindividual variability in the responses, we used the method recommended by Hopkins 4 and Atkinson and Batterham. 5 We performed a linear mixed model with group (CON, LEU‐PRO, and LEU‐PRO+n‐3) as a fixed factor and entered additional binary‐coded ‘dummy’ covariates as random factors (slope) to allow for extra variance in the change scores in each of the intervention groups compared with the CON group. Each potential moderator (age, sex, and PRE‐intervention values for the outcome, number of medical conditions, number of medications, BMI, fat mass, daily step count, dietary intake [total protein, total leucine, number of daily meals with ≥3 g leucine/meals, energy], relative erythrocyte fatty acid composition [% of EPA, DHA, n‐6 PUFA, and SFA], plasma vitamin D concentration, metabolic and renal function markers [hsCRP, HOMA‐IR, atherogenic index of plasma (AIP), cystatin c, total and HMW adiponectin, IGF‐1 concentrations, and eGFR], ALM and composite strength) and mediator (reported compliance, and change from PRE‐intervention to POST‐intervention in the aforementioned moderators except for age and sex) of response was added separately to the model as a covariate and interacted with group. Differences were considered significant with a false discovery rate of 0.1 after a Benjamini–Hochberg procedure was performed to adjust for the multiple comparisons.
Metabolomics
General linear models were constructed with POST‐intervention serum amino acid concentrations as a dependent factor, PRE‐intervention amino acid concentrations as the covariate factor, and supplement group and sex as fixed factors. Multivariate statistical analysis of NMR data was carried out using SIMCA 13 (SIMCA Version 13.0.3.0 Umetrics, AB). Data sets were scaled using Pareto scaling. Principal component analysis (PCA) was performed providing an overview of the data. The data set was divided into three groups, based on the three supplement codes and the time point of the sample. Partial least squares discriminant analysis (PLS‐DA) was used to examine differences between PRE‐intervention and POST‐intervention time points per group. PLS‐DA models were validated using permutation testing. The PLS‐DA model produced variable importance of projection (VIP) scores that indicate the most differential spectral regions between the time points for each group, with a cut‐off of ≥1.5. Orthogonal projections to latent structures discriminant analysis (OPLS‐DA) were performed to observe differences between PRE‐intervention and POST‐intervention samples for each group, from which S‐line plots were generated.
Results
No group‐level effects of LEU‐PRO or LEU‐PRO+n‐3 on ALM, strength, TUG, or serum TG
Characteristics of the participants included in this secondary analysis (n = 83) are summarized in Table 1. Of these participants, 61 (73.5%) were pre‐sarcopenic, 20 (24.1%) were sarcopenic, and 2 (2.4%) were dynapenic with normal muscle mass according to the EWGSOP1 criteria. There was no difference across the supplementation groups in the proportion of participants within each of these categories (P = 0.27, Table 1). In this cohort, the linear mixed model revealed no significant group‐level effects of 24 weeks of LEU‐PRO or LEU‐PRO+n‐3 supplementation on adjusted ALM (between‐group effect [95% CI] LEU‐PRO: 0.04 kg [−0.18 kg, 0.26 kg], P = 0.71, LEU‐PRO+n‐3: −0.05 kg [−0.27 kg, 0.17 kg], P = 0.65), composite leg strength (LEU‐PRO: 3 Nm [−23 Nm, 28 Nm], P = 0.83, LEU‐PRO+n‐3: −18 Nm [−43 Nm, 7 Nm], P = 0.16), TUG (LEU‐PRO: 0.3 s [−0.1 s, 0.7 s], P = 0.20, LEU‐PRO+n‐3: 0.4 s [0.0 s, 0.8 s], P = 0.05), or serum TG concentration (LEU‐PRO: 0.02 mmol/L [−0.26 mmol/L, 0.30 mmol/L], P = 0.90, LEU‐PRO+n‐3: −0.23 mmol/L [−0.50 mmol/L, 0.04 mmol/L], P = 0.10), relative to the CON group.
TABLE 1.
Baseline characteristics of participants
| CON, n = 25 | LEU‐PRO, n = 28 | LEU‐PRO+n‐3, n = 30 | |
|---|---|---|---|
| Sex | |||
| Female, n | 11 | 13 | 15 |
| Age, year | 72 ± 7 | 70 ± 4 | 72 ± 6 |
| BMI, kg/m2 | 25.3 ± 2.5 | 25.1 ± 3.5 | 27.1 ± 3.5 |
| Fat mass, kg | 22.9 ± 5.9 | 21.3 ± 7.5 | 25.4 ± 6.4 |
| Number of medical conditions, n | |||
| 0 | 8 | 12 | 11 |
| 1 | 7 | 4 | 8 |
| 2 | 4 | 9 | 6 |
| 3 or more | 6 | 3 | 5 |
| Number of medications | 2 ± 3 | 2 ± 2 | 2 ± 2 |
| Sarcopenia status, n | |||
| Sarcopenic | 6 | 5 | 9 |
| Presarcopenic | 19 | 23 | 19 |
| Dynapenic with normal muscle mass | 0 | 0 | 2 |
| SMMI, kg/m2 (BIA) | |||
| Female | 5.7 ± 0.5 | 5.7 ± 0.3 | 5.8 ± 0.7 |
| Male | 8.2 ± 0.7 | 8.7 ± 0.8 | 8.8 ± 0.9 |
| ALM, kg (DXA) | |||
| Female | 16.6 ± 1.3 | 16.1 ± 2.0 | 15.7 ± 1.5 |
| Male | 23.8 ± 2.9 | 25.2 ± 3.7 | 24.4 ± 2.6 |
| Handgrip strength, kg | |||
| Female | 22.6 ± 5.4 | 22.2 ± 5.3 | 19.3 ± 4.5 |
| Male | 39.6 ± .1 | 39.1 ± 6.6 | 37.0 ± 6.2 |
| TUG, s | 7.0 ± 1.4 | 6.8 ± 1.1 | 6.9 ± 1.2 |
| Composite leg strength, Nm | |||
| Female | 263 ± 55 | 241 ± 64 | 213 ± 59 |
| Male | 410 ± 108 | 422 ± 95 | 450 ± 94 |
| TG, mmol/L | 1.1 ± 0.4 | 1.0 ± 0.4 | 1.2 ± 0.6 |
| HDL, mmol/L | 1.6 ± 0.4 | 1.7 ± 0.4 | 1.7 ± 0.4 |
| LDL, mmol/L | 3.5 ± 0.8 | 3.6 ± 0.7 | 3.3 ± 0.8 |
| Glucose, mmol/L | 5.9 ± 0.7 | 5.5 ± 0.5 | 5.8 ± 0.5 |
| Insulin, mU/L | 4.4 ± 2.3 | 4.1 ± 3.0 | 6.3 ± 3.3 |
| HOMA‐IR | 1.2 ± .7 | 1.0 ± 0.8 | 1.7 ± 1.0 |
| hsCRP, mg/L | 1.6 ± 1.4 | 1.3 ± 1.0 | 1.9 ± 1.6 |
| Cystatin C, mg/L | 0.9 ± 0.2 | 0.8 ± 0.1 | 0.9 ± 0.2 |
| eGFR, mL/min/1.73 m2 | 84.6 ± 18.8 | 95.9 ± 10.5 | 81.8 ± 20.9 |
| Physical activity, steps/day | 8,303 ± 5,280 | 8,721 ± 4,415 | 8,505 ± 3,723 |
| 25(OH)D, nmol/L | 65 ± 36 | 66 ± 25 | 64 ± 24 |
| EPA + DHA (% of total measured erythrocyte phospholipids) | 7.7 ± 1.9 | 8.9 ± 2.1 | 7.7 ± 1.9 |
| Dietary protein intake (g/kg/day) | 1.1 ± 0.5 | 1.2 ± 0.4 | 1.0 ± 0.3 |
ALM, appendicular lean mass; BIA, bioelectrical impedance analysis; CON, control; DXA, dual‐energy X‐ray absorptiometry; hsCRP, high sensitivity C‐reactive protein; LEU‐PRO, leucine‐enriched protein; LEU‐PRO+n‐3, leucine‐enriched protein plus long chain n‐3 polyunsaturated fatty acids; SMMI; skeletal muscle mass index, TG; serum triacylglycerol, TUG; timed up‐and‐go.
Values are means ± SD unless otherwise specified.
Minimal interindividual variation in ALM, strength, TUG, and serum TG concentration in response to LEU‐PRO or LEU‐PRO+n‐3 supplementation
Figure 1 illustrates the changes in adjusted ALM, composite leg strength, TUG performance, and serum TG concentration in the individual participants, as well as the SDR values with 90% confidence intervals. The SDR value represents the interindividual variability in response to supplementation, after the effect of random measurement error and within‐subject variation has been removed. For composite strength, the SDR was above the MCID (19 Nm) for both LEU‐PRO (SDR: 25 Nm [90% CI: −29, 45]) and LEU‐PRO+n‐3 (SDR: 23 Nm [90% CI: −29, 43]) supplementation. As the SDR values exceeded the MCID, this signifies meaningfully more interindividual variation in the LEU‐PRO and LEU‐PRO+n‐3 groups relative to CON, and therefore the presence of true, clinically meaningful interindividual variability in response to LEU‐PRO and LEU‐PRO+n‐3 supplementation. However, the confidence intervals were very wide, indicating substantial uncertainty.
Figure 1.
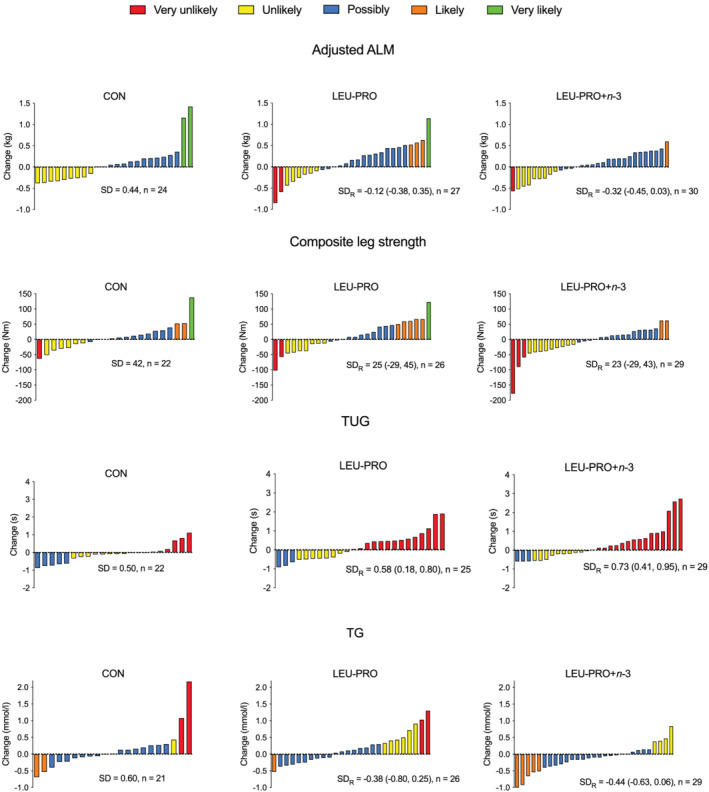
Change in adjusted ALM, composite leg strength, TUG performance and serum TG concentrations from PRE‐intervention to POST‐intervention for each individual participant per group. Bars represent change in the outcome variable for each participant. SDR, SD of the interindividual variation in response due to supplementation (LEU‐PRO/LEU‐PRO+n‐3) after accounting for measurement error and within‐subject variation. The colour of the bar indicates the likelihood that the participant's observed response represents a clinically meaningful improvement (increase in ALM and strength, decrease in TUG and TG). ALM, appendicular lean mass, LEU‐PRO, leucine‐enriched protein; LEU‐PRO+n‐3, leucine‐enriched protein plus long chain n‐3 polyunsaturated fatty acids; TG, serum triacylglycerol concentration; TUG, timed up‐and‐go.
For TUG, the SDR was positive for LEU‐PRO (SDR: 0.58 s [90% CI: 0.18, 0.80]) and LEU‐PRO+n‐3 (SDR: 0.73 s [90% CI: 0.41, 0.95]). Although the positive SDR values demonstrate more interindividual variability in the intervention groups relative to CON, the SDR values were below the MCID (0.9 s), indicating that the additional variability was not clinically meaningful. For adjusted ALM (LEU‐PRO: SDR −0.12 kg [90% CI: −0.38, 0.35], LEU‐PRO+n‐3: SDR −0.32 kg [90% CI: −0.45, 0.03]) and serum TG concentrations (LEU‐PRO: SDR −0.38 mmol/L [90% CI: −0.80, 0.25], LEU‐PRO+n‐3: SDR −0.44 mmol/L [90% CI −0.63, 0.06]), the SDR values were negative for both supplements. This demonstrates less interindividual variability in the intervention groups compared with the CON group and therefore an absence of true interindividual variability in response to LEU‐PRO and LEU‐PRO+n‐3 supplementation.
Figure 1 also displays the probability that the individual change values represent a clinically meaningful improvement in the outcomes, after adjusting for the typical error of the measurement. Table 2 shows the proportion of individuals in each supplementation group whose changes were categorized as very likely, likely, possibly, unlikely, and very unlikely to represent clinically meaningful improvements (an increase in ALM and composite leg strength, a decrease in time taken to perform the TUG test and serum TG concentration). Table 3 displays the proportion of individuals in each supplementation group whose changes were categorized as very likely, likely, possibly, unlikely, and very unlikely to represent clinically meaningful adverse responses in the outcomes. The proportion of individual responses categorized as very unlikely, unlikely, possibly, likely, or very likely to represent meaningfully improvements, or meaningful adverse changes, did not differ across the CON, LEU‐PRO and LEU‐PRO+n‐3 groups for any of the outcomes (P > 0.05, Tables 2 and 3).
TABLE 2.
Proportion (%) of individuals in each category of beneficial response likelihood
| CON (%) | LEU‐PRO (%) | LEU‐PRO+n‐3 (%) | |
|---|---|---|---|
| Δ Appendicular lean mass | |||
| Very unlikely | 0 | 7.4 | 3.3 |
| Unlikely | 37.5 | 22.2 | 26.7 |
| Possible | 54.2 | 55.6 | 66.7 |
| Likely | 0 | 11.1 | 3.3 |
| Very likely | 8.3 | 3.7 | 0 |
| Δ Composite leg strength | |||
| Very unlikely | 4.5 | 7.7 | 10.3 |
| Unlikely | 27.3 | 26.9 | 31.0 |
| Possible | 54.6 | 42.3 | 51.7 |
| Likely | 9.1 | 19.2 | 7.0 |
| Very likely | 4.5 | 3.9 | 0.0 |
| Δ TUG | |||
| Very unlikely | 40.9 | 56.0 | 55.2 |
| Unlikely | 36.4 | 32.0 | 34.5 |
| Possible | 22.7 | 12.0 | 10.3 |
| Likely | 0 | 0 | 0 |
| Very likely | 0 | 0 | 0 |
| Δ TG | |||
| Very unlikely | 9.5 | 7.7 | 0 |
| Unlikely | 4.8 | 23.1 | 13.8 |
| Possible | 76.2 | 65.4 | 69.0 |
| Likely | 9.5 | 3.8 | 17.2 |
| Very likely | 0 | 0 | 0 |
LEU‐PRO, leucine‐enriched protein; LEU‐PRO+n‐3, leucine‐enriched protein plus long chain n‐3 polyunsaturated fatty acids; TG, serum triacylglycerol concentration; TUG, timed up‐and‐go.
TABLE 3.
Proportion (%) of individuals in each category of adverse response likelihood
| CON (%) | LEU‐PRO (%) | LEU‐PRO+n‐3 (%) | |
|---|---|---|---|
| Δ Appendicular lean mass | |||
| Very unlikely | 8.4 | 11.2 | 3.3 |
| Unlikely | 33.3 | 40.7 | 40.0 |
| Possible | 58.3 | 40.7 | 50.0 |
| Likely | 0 | 7.4 | 6.7 |
| Very likely | 0 | 0 | 0 |
| Δ Composite leg strength | |||
| Very unlikely | 4.5 | 19.3 | 6.9 |
| Unlikely | 36.4 | 26.9 | 31.0 |
| Possible | 50.0 | 46.2 | 51.7 |
| Likely | 9.1 | 3.8 | 6.9 |
| Very likely | 0 | 3.8 | 3.5 |
| Δ TUG | |||
| Very unlikely | 77.3 | 48.0 | 48.3 |
| Unlikely | 9.1 | 28.0 | 24.2 |
| Possible | 13.6 | 16.0 | 17.2 |
| Likely | 0 | 0 | 0 |
| Very likely | 0 | 8.0 | 10.3 |
| Δ TG | |||
| Very unlikely | 0 | 0 | 3.4 |
| Unlikely | 14.3 | 15.4 | 24.2 |
| Possible | 76.1 | 69.2 | 69.0 |
| Likely | 4.8 | 11.6 | 3.4 |
| Very likely | 4.8 | 3.8 | 0 |
LEU‐PRO, leucine‐enriched protein; LEU‐PRO+n‐3, leucine‐enriched protein plus long chain n‐3 polyunsaturated fatty acids; TG, serum triacylglycerol concentration; TUG, timed up‐and‐go.
A key element of precision nutrition is to identify or better understand determinants (predictors) of dietary intervention outcomes. However, none of the phenotypic, dietary, or lifestyle determinants examined in the present study remained significant after Benjamini–Hochberg correction for multiple comparisons (further details of determinants that were significant prior to correction are provided in the Supporting Information).
Minor alterations in metabolomic profiles following LEUPRO+n‐3 supplementation
There was no major impact of either LEU‐PRO or LEU‐PRO+n‐3 supplementation on fasting serum amino acid concentration profiles, with only one amino acid changing across the groups (Table S2). PCA analysis (Figure S2) did not reveal any separation according to supplementation group in the post intervention samples. A supervised PLS‐DA model was obtained for the LEU‐PRO+n‐3 group (Q 2 value 0.608, R 2 value 0.516, Figure 2A), but not for the CON or LEU‐PRO groups. Permutation tests determined that the model was robust (intercepts R 2 = (0.0, 0.156), Q 2 = (0.0, −0.151). An S‐line was generated from the OPLS‐DA model which identified discriminant regions of the spectra in the LEU‐PRO+n‐3 group PRE‐intervention and POST‐intervention. The metabolomic profile of the LEU‐PRO+n‐3 group demonstrated that lactate and LDL/VLDL metabolites were higher PRE‐intervention, compared with POST‐intervention. Also, metabolites directly related to n‐3 PUFA metabolism increased POST‐supplementation, relative to PRE‐supplementation (Figure 2B). Therefore, the metabolomic profile alteration was probably due to LC n‐3 PUFA rather than amino acid supplementation.
Figure 2.
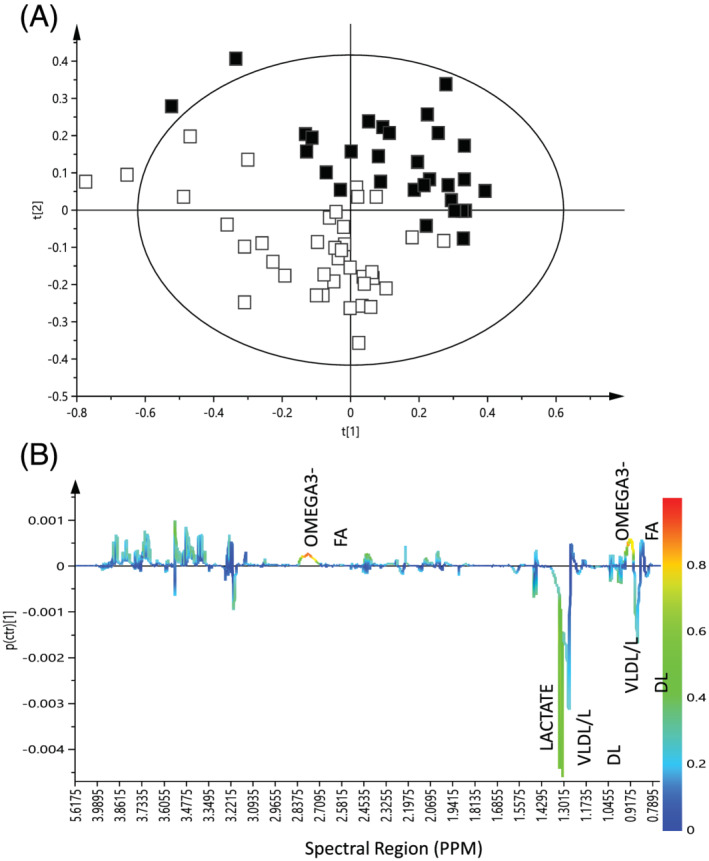
(A) PLS‐DA score plot of 1H‐NMR serum data of PRE‐ compared with POST‐intervention samples in the LEU‐PRO+n‐3 group (R 2 = 0.516; Q 2 = 0.608). t[1], PLS component 1; t[2], principal component. White squares represent PRE‐intervention samples and black squares represent POST‐intervention samples for participants supplemented with LEU‐PRO+n‐3. (B) S‐line plot from OPLS‐DA model of 1H‐NMR data from PRE‐intervention to POST‐intervention in the LEU‐PRO+n‐3 group. 1H‐NMR, proton nuclear magnetic resonance; OPLS‐DA, orthogonal projections to latent structures discriminant analysis; PLS‐DA, partial least squares discriminant analysis.
Discussion
Using a novel approach, we report that there is little evidence of clinically meaningful interindividual variability in ALM, leg strength, physical performance, and TG responses to 24 weeks of LEU‐PRO or LEU‐PRO+n‐3 supplementation in older adults at risk of sarcopenia, after accounting for measurement error and random within‐subject variation. Furthermore, using individual probabilities of true response, we extend the binary categorization of participants as ‘responders’ or ‘non‐responders’ used in some, 6 , 7 , 9 but not all, 20 , 21 studies and show that the proportion of individuals whose ALM, leg strength, physical performance, and TG changes were very likely, likely, possibly, unlikely, and very unlikely to represent clinically meaningful improvements or adverse changes were similar between the groups supplemented with LEU‐PRO, LEU‐PRO+n‐3 and CON. The analytical approaches presented here can be used in future nutrition intervention studies to advance precision nutrition research.
To our knowledge, this is the first study that examined the individual responses to a nutrition intervention for sarcopenia. Sarcopenia is a disease characterized by diminished skeletal muscle strength and mass that contributes substantially to physical disability, falls, dependency, and reduced quality of life among older people. 22 Intervention studies often yield inconsistent results with respect to the impact of various nutritional strategies, such as protein, 23 , 27 amino acid, 23 and LC n‐3 PUFA 28 , 30 supplementation, on muscle mass and function in older adults. One of the reasons for this could be that the use of mean outcomes masks or conflates higher responder and lower responder populations, thus underestimating benefit in a responsive population. 31 On this basis, despite previously observing no beneficial effects of 24 weeks of LEU‐PRO and LEU‐PRO+n‐3 supplementation on ALM, strength and TUG, and a small reduction in serum TG following LEU‐PRO+n‐3, at the group mean level, 11 we hypothesized that there would be considerable interindividual variation in response to the LEU‐PRO and LEU‐PRO+n‐3 supplementation. Counter to our hypothesis, the SDR (a measure of the amount by which the true effect of the intervention differs between individuals 4 ) and associated confidence intervals were not consistent with there being clinically meaningful interindividual variability in the ALM, strength, TUG and TG responses to LEU‐PRO or LEU‐PRO+n‐3 supplementation. Moreover, similar proportions of participant responses were categorized as very likely, likely, possibly, unlikely, and very unlikely to represent clinically meaningful improvements and adverse changes across the LEU‐PRO, LEU‐PRO+n‐3, and CON groups, after accounting for typical error of the measurement. This suggests that the previously reported group mean results 11 were not masking higher responder populations specifically in the LEU‐PRO and LEU‐PRO+n‐3 supplementation groups.
Variable baseline nutritional and/or metabolic status is a plausible and commonly cited explanation for the inconsistency between studies in the reported impact of protein and LC n‐3 PUFA supplementation in older adults. 23 , 32 Counter to this notion however, despite a wide between‐participant range in PRE‐intervention protein intake (0.4 to 2.2 g/kg/day, 37% of the cohort had a dietary protein intake <1 g/kg/day) and LC n‐3 PUFA status (erythrocyte EPA + DHA content 4.4% to 17.0% of total membrane fatty acids), we observed no association between these nutritional status measures, or numerous other dietary, phenotypic, or behavioural variables, and the responses to LEU‐PRO and LEU‐PRO+n‐3 supplementation. Thus, our analyses imply that the phenotype and nutritional status of our participants are unlikely to explain the lack of observed group‐level effect of the LEU‐PRO and LEU‐PRO+n‐3 supplementation interventions, and further research will be required to untangle the reasons for the inconsistency regarding the impact of LEU‐PRO and LC n‐3 PUFA reported in the literature. 11 , 24 , 26 , 28 , 30 Possible reasons for this inconsistency may include variations the supplement dose, the intervention duration, the population studied, the inclusion of a concomitant resistance exercise intervention and the sample size. Yet, when comparing studies that have reported favourable effects of supplementation with LEU‐PRO and/or LC n‐3 PUFA 25 , 28 , 33 , 34 in older adults to those observing no effect, 11 , 24 , 29 , 30 no clear pattern emerges with respect to the aforementioned factors. A further possibility is that the provision of additional nutrients in the supplement, such as vitamin D3, may serve to enhance the efficacy of the LEU‐PRO or LC n‐3 PUFA. For example, in several trials that reported improvements in muscle mass and/or physical performance following supplementation with LEU‐PRO in older adults, vitamin D3 was co‐ingested within the supplement. 25 , 27 , 34 Vitamin D3 treatment was previously shown to sensitize muscle cells to the stimulatory effects of leucine and insulin on muscle protein synthesis in culture 35 and vitamin D supplementation may improve strength in older adults. 36
Our metabolomic data revealed that, interestingly, at the group level, spectral regions related to LDL and VLDL were higher PRE‐supplementation in the LEU‐PRO+n‐3 group compared with POST‐supplementation, an observation that is consistent with human kinetics studies showing reduced VLDL production following LC n‐3 PUFA supplementation. 37 However, this did not translate into robust concomitant alterations in either plasma cholesterol or TG concentrations, highlighting the sensitivity of NMR‐based approaches relative to classical lipoprotein concentration measurements.
This study has several limitations. Firstly, as it is a secondary analysis of a randomized controlled trial, the sample size was derived from a power calculation for the expected mean changes in the primary outcome (ALM) rather than for the analysis of individual responses. Designing studies to interrogate individual response variability requires exceptionally large sample sizes (e.g. four times the sample size needed to observe a mean effect) 38 and therefore represents a significant challenge. Secondly, except for TUG, our data are based on a single assessment of each outcome PRE‐intervention and POST‐intervention, as is common practice in randomized controlled trials. Nonetheless, conducting several testing sessions at each time point and computing the average would have reduced the impact of measurement error and increased the accuracy of the estimate of each individual's true value. Thirdly, as there are no universally accepted MCIDs for changes in ALM and composite leg strength, we used a pragmatic value based on mean biannual losses derived from a longitudinal study of ageing. 16 A common alternative in the absence of established MCIDs is to use the PRE‐intervention between‐subject SD to calculate the effect size (Cohen's d) equivalent to a small effect. In our study, the latter yields larger MCIDs (0.64 kg for adjusted ALM, 25 Nm for composite strength) compared with the pragmatic estimates (0.21 kg, 19 Nm), however this would not have changed our conclusions. Rather, it would have strengthened our finding of a lack of meaningful interindividual variability in response to the LEU‐PRO and LEU‐PRO+n‐3 interventions for those outcomes. Finally, the fact that our intervention was ineffective at improving any of the outcomes may have prevented us from observing interindividual variability in response to the supplements.
Strengths of this study include that the individual data are based on a well‐conducted randomized, double‐blind, placebo‐controlled trial, which included objectively measured LC n‐3 PUFA status and physical activity. Furthermore, we used robust statistical methods to isolate the individual variation attributable to LEU‐PRO/LEU‐PRO+n‐3 supplementation per se from the variation from sources not attributable to the intervention, which has not been done before in nutrition intervention studies.
In conclusion, applying a novel approach we demonstrate that LEU‐PRO and LEU‐PRO+n‐3 supplementation are minimally responsible for the interindividual variability in observed ALM, strength, physical performance, and serum TG concentration changes over 24 weeks in older adults at risk of sarcopenia. The proportion of individual observed responses classified as very likely, likely, possibly, unlikely, and very unlikely to represent clinical improvements or adverse changes were similar between the groups supplemented with LEU‐PRO, LEU‐PRO+n‐3 and CON. We observed no associations between baseline protein intake, LC n‐3 PUFA status or any other measured phenotypic, dietary, or behavioural variable and responsiveness to the LEU‐PRO or LEU‐PRO+n‐3 supplementation. Our approach will inform future research in the field of precision nutrition, in terms of applying more robust statistical approaches to analysing and understanding potential efficacy of dietary interventions on individuals.
Author contributions
The authors' responsibilities were as follows: C. H. M., E. M. F., and E. d. M. C. collected the data that was used in this secondary analysis; C. C., K. A. J. M. and L. B. analysed samples; C. H. M. performed the statistical analysis and wrote the manuscript; C. C., E. M. F., K. A. J. M., E. d. M. C., B. E., L. B., and H. M. R. critically revised the manuscript for important intellectual content; H. M. R. had primary responsibility for the final content; and all authors read and approved the final manuscript.
Conflict of interest
Glanbia Plc and Smartfish® supplied the supplement ingredients, and Smartfish® produced the ready‐to‐drink control and intervention supplements for this study. However, neither Glanbia Plc nor Smartfish® played a role in data collection, data analysis, or in the writing of this manuscript. The authors report no conflict of interests.
Funding
This work was supported by the Department of Agriculture, Food and the Marine Food Institutional Research Measure Grants entitled NUTRIMAL ‘Novel Nutritional Solutions for the Prevention of Malnutrition’ (Grant number 14F822), the European Union's Horizon 2020 Research and Innovation Programme under the Marie Skłodowska‐Curie Grant Agreement No 666010, and a Research Fellowship awarded to C. H. M. by the European Society of Clinical Nutrition and Metabolism (ESPEN). H. M. R. was supported by funding from the Joint Programming Initiative Healthy Diet for a Healthy Life (JPI HDHL) EU Food Biomarkers Alliance ‘FOODBAll’ with Science Foundation Ireland (14/JPHDHL/B3076).
Ethical standards
This study was approved by the University College Dublin (UCD) Human Research Ethics Committee (permit: LS‐16‐41‐Murphy‐Roche) and was performed in accordance with the ethical standards laid down in the 1964 Declaration of Helsinki and its later amendments. All participants gave their informed consent prior to their inclusion in the study.
Supporting information
Table S1. TABLE 1 Nutritional composition of the supplements per single (200 mL) serving1
TABLE 2 Fasted, serum amino acid concentrations1
Figure 1. Recruitment, selection, randomization and follow‐up of participants in this secondary analysis. * TG measurements excluded due to the development of Type 2 Diabetes Mellitus during the course of the study, n = 1. † adjusted ALM data excluded in participants who had vastus lateralis biopsies in both legs as opposed to just the non‐dominant leg, n = 1 in CON, n = 1 in LEU‐PRO. # TUG data excluded in participants who experienced muscle swelling / pain following the biopsy at either the PRE‐ or POST‐intervention time point n = 1 in CON, n = 2 in LEU‐PRO, n = 1 in LEU‐PRO+n‐3. ALM, appendicular lean mass; CON, control; LEU‐PRO, leucine‐enriched protein; LEU‐PRO+n‐3, leucine‐enriched protein plus long chain n‐3 polyunsaturated fatty acids; TUG, timed up‐and‐go.
Figure 2. Principal Component Analysis (PCA) score plot of 1H‐NMR serum data of POST‐intervention samples for participants in the CON, LEU‐PRO and LEU‐PRO+n‐3 groups (n = 79). R2 = 0.92; Q2 = 0.812. t[1], PLS component 1; t[2], principal component 2.
Acknowledgements
We thank Brian Reilly, Stacey McDonnell, Aoife Courtney, and Alan Maloney for help with participant recruitment, scheduling, testing, and their technical assistance during the trial. We thank Marilena Cignarella, Danica Murphy, and David Kenny for their help with data entry. We would also like to thank Dr. William Hopkins, Dr. Andrea Brennan, and Dr. Robert Ross for their advice on the statistical analysis of individual responses. The authors of this manuscript certify that they comply with the ethical guidelines for authorship and publishing in the Journal of Cachexia, Sarcopenia and Muscle. 39
Murphy C. H., Connolly C., Flanagan E. M., Mitchelson K. A. J., de Marco Castro E., Egan B., Brennan L., and Roche H. M. (2022) Interindividual variability in response to protein and fish oil supplementation in older adults: a randomized controlled trial, Journal of Cachexia, Sarcopenia and Muscle, 13, 872–883, 10.1002/jcsm.12936
References
- 1. Hjorth MF, Ritz C, Blaak EE, Saris WH, Langin D, Poulsen SK, et al. Pretreatment fasting plasma glucose and insulin modify dietary weight loss success: results from 3 randomized clinical trials. Am J Clin Nutr 2017;106:499–505. [DOI] [PubMed] [Google Scholar]
- 2. Prud'homme D, Bouchard C, Leblanc C, Landry F, Fontaine E. Sensitivity of maximal aerobic power to training is genotype‐dependent. Med Sci Sports Exerc 1984;16:489–493. [DOI] [PubMed] [Google Scholar]
- 3. Valsesia A, Saris WH, Astrup A, Hager J, Masoodi M. Distinct lipid profiles predict improved glycemic control in obese, nondiabetic patients after a low‐caloric diet intervention: the diet, obesity and genes randomized trial. Am J Clin Nutr 2016;104:566–575. [DOI] [PubMed] [Google Scholar]
- 4. Hopkins WG. Individual responses made easy. J Appl Physiol 2015;118:1444–1446. [DOI] [PubMed] [Google Scholar]
- 5. Atkinson G, Batterham AM. True and false interindividual differences in the physiological response to an intervention. Exp Physiol 2015;100:577–588. [DOI] [PubMed] [Google Scholar]
- 6. McMorrow AM, Connaughton RM, Magalhães TR, McGillicuddy FC, Hughes MF, Cheishvili D, et al. Personalized cardio‐metabolic responses to an anti‐inflammatory nutrition intervention in obese adolescents: a randomized controlled crossover trial. Mol Nutr Food Res 2018;62:e1701008. [DOI] [PMC free article] [PubMed] [Google Scholar]
- 7. Armenise C, Lefebvre G, Carayol J, Bonnel S, Bolton J, Di Cara A, et al. Transcriptome profiling from adipose tissue during a low‐calorie diet reveals predictors of weight and glycemic outcomes in obese, nondiabetic subjects. Am J Clin Nutr 2017;106:736–746. [DOI] [PubMed] [Google Scholar]
- 8. Yubero‐Serrano EM, Delgado‐Lista J, Tierney AC, Perez‐Martinez P, Garcia‐Rios A, Alcala‐Diaz JF, et al. Insulin resistance determines a differential response to changes in dietary fat modification on metabolic syndrome risk factors: the LIPGENE study. Am J Clin Nutr 2015;102:1509–1517. [DOI] [PubMed] [Google Scholar]
- 9. Elnenaei MO, Chandra R, Mangion T, Moniz C. Genomic and metabolomic patterns segregate with responses to calcium and vitamin D supplementation. Br J Nutr 2011;105:71–79. [DOI] [PubMed] [Google Scholar]
- 10. Bonafiglia JT, Brennan AM, Ross R, Gurd BJ. An appraisal of the SD (IR) as an estimate of true individual differences in training responsiveness in parallel‐arm exercise randomized controlled trials. Physiol Rep 2019;7:e14163, 10.14814/phy2.14163 [DOI] [PMC free article] [PubMed] [Google Scholar]
- 11. Murphy CH, De Vito G, Susta D, Mitchelson KAJ, de Marco Castro E, Senden JMG, et al. Does supplementation with leucine‐enriched protein alone and in combination with fish oil–derived n–3 PUFA affect muscle mass, strength, physical performance and muscle protein synthesis in well‐nourished older adults? A randomized, double‐blind, placebo‐controlled trial. Am J Clin Nutr 2021;113:1411–1427. [DOI] [PMC free article] [PubMed] [Google Scholar]
- 12. Cruz‐Jentoft AJ, Baeyens JP, Bauer JM, Boirie Y, Cederholm T, Landi F, et al. Sarcopenia: European consensus on definition and diagnosis: Report of the European Working Group on Sarcopenia in Older People. Age Ageing 2010;39:412–423. [DOI] [PMC free article] [PubMed] [Google Scholar]
- 13. Janssen I, Baumgartner RN, Ross R, Rosenberg IH, Roubenoff R. Skeletal muscle cutpoints associated with elevated physical disability risk in older men and women. Am J Epidemiol 2004;159:413–421. [DOI] [PubMed] [Google Scholar]
- 14. Mesquita R, Wilke S, Smid DE, Janssen DJ, Franssen FM, Probst VS, et al. Measurement properties of the Timed Up & Go test in patients with COPD. Chron Respir Dis 2016;13:344–352. [DOI] [PMC free article] [PubMed] [Google Scholar]
- 15. Jun M, Foote C, Lv J, Neal B, Patel A, Nicholls SJ, et al. Effects of fibrates on cardiovascular outcomes: a systematic review and meta‐analysis. Lancet 2010;375:1875–1884. [DOI] [PubMed] [Google Scholar]
- 16. Koster A, Ding J, Stenholm S, Caserotti P, Houston DK, Nicklas BJ, et al. Does the amount of fat mass predict age‐related loss of lean mass, muscle strength, and muscle quality in older adults? J Gerontol A Biol Sci Med Sci 2011;66:888–895. [DOI] [PMC free article] [PubMed] [Google Scholar]
- 17. Hopkins W. Precision of the estimate of a subject's true value (Excel spreadsheet). 2000. (Available at: https://www.sportsci.org/resource/stats/xprecisionsubject.xls
- 18. Hopkins WG. Measures of reliability in sports medicine and science. Sports Med 2000;30:1–15. [DOI] [PubMed] [Google Scholar]
- 19. Swinton PA, Hemingway BS, Saunders B, Gualano B, Dolan E. A statistical framework to interpret individual response to intervention: paving the way for personalized nutrition and exercise prescription. Front Nutr 2018;5:41. [DOI] [PMC free article] [PubMed] [Google Scholar]
- 20. Zeevi D, Korem T, Zmora N, Israeli D, Rothschild D, Weinberger A, et al. Personalized nutrition by prediction of glycemic responses. Cell 2015;163:1079–1094. [DOI] [PubMed] [Google Scholar]
- 21. Berry SE, Valdes AM, Drew DA, Asnicar F, Mazidi M, Wolf J, et al. Human postprandial responses to food and potential for precision nutrition. Nat Med 2020;26:964–973. [DOI] [PMC free article] [PubMed] [Google Scholar]
- 22. Cruz‐Jentoft AJ, Bahat G, Bauer J, Boirie Y, Bruyere O, Cederholm T, et al. Sarcopenia: revised European consensus on definition and diagnosis. Age Ageing 2019;48:16–31. [DOI] [PMC free article] [PubMed] [Google Scholar]
- 23. Tieland M, Franssen R, Dullemeijer C, van Dronkelaar C, Kyung Kim H, Ispoglou T, et al. The impact of dietary protein or amino acid supplementation on muscle mass and strength in elderly people: individual participant data and meta‐analysis of RCT's. J Nutr Health Aging 2017;21:994–1001. [DOI] [PubMed] [Google Scholar]
- 24. Kirk B, Mooney K, Cousins R, Angell P, Jackson M, Pugh JN, et al. Effects of exercise and whey protein on muscle mass, fat mass, myoelectrical muscle fatigue and health‐related quality of life in older adults: a secondary analysis of the Liverpool Hope University‐Sarcopenia Ageing Trial (LHU‐SAT). Eur J Appl Physiol 2020;120:493–503. [DOI] [PubMed] [Google Scholar]
- 25. Bauer JM, Verlaan S, Bautmans I, Brandt K, Donini LM, Maggio M, et al. Effects of a vitamin D and leucine‐enriched whey protein nutritional supplement on measures of sarcopenia in older adults, the PROVIDE study: a randomized, double‐blind, placebo‐controlled trial. J Am Med Dir Assoc 2015;16:740–747. [DOI] [PubMed] [Google Scholar]
- 26. Chanet A, Verlaan S, Salles J, Giraudet C, Patrac V, Pidou V, et al. Supplementing breakfast with a vitamin D and leucine‐enriched whey protein medical nutrition drink enhances postprandial muscle protein synthesis and muscle mass in healthy older men. J Nutr 2017;147:2262–2271. [DOI] [PubMed] [Google Scholar]
- 27. Rondanelli M, Klersy C, Terracol G, Talluri J, Maugeri R, Guido D, et al. Whey protein, amino acids, and vitamin D supplementation with physical activity increases fat‐free mass and strength, functionality, and quality of life and decreases inflammation in sarcopenic elderly. Am J Clin Nutr 2016;103:830–840. [DOI] [PubMed] [Google Scholar]
- 28. Smith GI, Julliand S, Reeds DN, Sinacore DR, Klein S, Mittendorfer B. Fish oil‐derived n‐3 PUFA therapy increases muscle mass and function in healthy older adults. Am J Clin Nutr 2015;102:115–122. [DOI] [PMC free article] [PubMed] [Google Scholar]
- 29. Bischoff‐Ferrari HA, Vellas B, Rizzoli R, Kressig RW, da Silva JAP, Blauth M, et al. Effect of vitamin D supplementation, omega‐3 fatty acid supplementation, or a strength‐training exercise program on clinical outcomes in older adults: the DO‐HEALTH randomized clinical trial. JAMA 2020;324:1855–1868. [DOI] [PMC free article] [PubMed] [Google Scholar]
- 30. Pahor M, Anton SD, Beavers DP, Cauley JA, Fielding RA, Kritchevsky SB, et al. Effect of losartan and fish oil on plasma IL‐6 and mobility in older persons. The ENRGISE pilot randomized clinical trial. J Gerontol A Biol Sci Med Sci 2019;74:1612–1619. [DOI] [PMC free article] [PubMed] [Google Scholar]
- 31. Murphy CH, Roche HM. Nutrition and physical activity countermeasures to sarcopenia: time to get personal? Nutr Bull 2018;43:374–387. [Google Scholar]
- 32. von Schacky C. Omega‐3 index in 2018/19. Proc Nutr Soc 2020;79:1–7. [DOI] [PubMed] [Google Scholar]
- 33. Da Boit M, Sibson R, Sivasubramaniam S, Meakin JR, Greig CA, Aspden RM, et al. Sex differences in the effect of fish‐oil supplementation on the adaptive response to resistance exercise training in older people: a randomized controlled trial. Am J Clin Nutr 2017;105:151–158. [DOI] [PMC free article] [PubMed] [Google Scholar]
- 34. Scotto di Palumbo A, McSwiney FT, Hone M, McMorrow AM, Lynch G, De Vito G, et al. Effects of a long chain n‐3 polyunsaturated fatty acid‐rich multi‐ingredient nutrition supplement on body composition and physical function in older adults with low skeletal muscle mass. J Diet Suppl 2021;1–16, 10.1080/19390211.2021.1897057 [DOI] [PubMed] [Google Scholar]
- 35. Salles J, Chanet A, Giraudet C, Patrac V, Pierre P, Jourdan M, et al. 1,25(OH)2‐vitamin D3 enhances the stimulating effect of leucine and insulin on protein synthesis rate through Akt/PKB and mTOR mediated pathways in murine C2C12 skeletal myotubes. Mol Nutr Food Res 2013;57:2137–2146. [DOI] [PubMed] [Google Scholar]
- 36. Beaudart C, Buckinx F, Rabenda V, Gillain S, Cavalier E, Slomian J, et al. The effects of vitamin D on skeletal muscle strength, muscle mass, and muscle power: a systematic review and meta‐analysis of randomized controlled trials. J Clin Endocrinol Metab 2014;99:4336–4345. [DOI] [PubMed] [Google Scholar]
- 37. Oscarsson J, Hurt‐Camejo E. Omega‐3 fatty acids eicosapentaenoic acid and docosahexaenoic acid and their mechanisms of action on apolipoprotein B‐containing lipoproteins in humans: a review. Lipids Health Dis 2017;16:149. [DOI] [PMC free article] [PubMed] [Google Scholar]
- 38. Hopkins WG. Design and analysis for studies of individual responses. Sportscience 2018;22:39–51. [Google Scholar]
- 39. von Haehling S, Morley JE, Coats AJS, Anker SD. Ethical guidelines for publishing in the Journal of Cachexia, Sarcopenia and Muscle: update 2021. J Cachexia Sarcopenia Muscle 2021;12:2259–2261. [DOI] [PMC free article] [PubMed] [Google Scholar]
Associated Data
This section collects any data citations, data availability statements, or supplementary materials included in this article.
Supplementary Materials
Table S1. TABLE 1 Nutritional composition of the supplements per single (200 mL) serving1
TABLE 2 Fasted, serum amino acid concentrations1
Figure 1. Recruitment, selection, randomization and follow‐up of participants in this secondary analysis. * TG measurements excluded due to the development of Type 2 Diabetes Mellitus during the course of the study, n = 1. † adjusted ALM data excluded in participants who had vastus lateralis biopsies in both legs as opposed to just the non‐dominant leg, n = 1 in CON, n = 1 in LEU‐PRO. # TUG data excluded in participants who experienced muscle swelling / pain following the biopsy at either the PRE‐ or POST‐intervention time point n = 1 in CON, n = 2 in LEU‐PRO, n = 1 in LEU‐PRO+n‐3. ALM, appendicular lean mass; CON, control; LEU‐PRO, leucine‐enriched protein; LEU‐PRO+n‐3, leucine‐enriched protein plus long chain n‐3 polyunsaturated fatty acids; TUG, timed up‐and‐go.
Figure 2. Principal Component Analysis (PCA) score plot of 1H‐NMR serum data of POST‐intervention samples for participants in the CON, LEU‐PRO and LEU‐PRO+n‐3 groups (n = 79). R2 = 0.92; Q2 = 0.812. t[1], PLS component 1; t[2], principal component 2.