

Abstract
Background
Studies on the prospective association of body composition with mortality in US general populations are limited. We aimed to examine this association by utilizing data from the National Health and Nutrition Examination Survey (NHANES), a representative sample of US adults, linked with data from the National Death Index.
Methods
We analysed data of NHANES 1988–1994 and 1999–2014, with 55 818 participants [50.6% female, baseline mean age: 45.0 years (SE, 0.2)]. Predicted fat mass and lean mass were calculated using the validated sex‐specific anthropometric prediction equations developed by the NHANES based on individual age, race, height, weight, and waist circumference. Body composition and other covariates were measured at only one time point. Multivariable Cox regression was used to investigate the associations of predicted fat mass and lean mass with overall and cause‐specific mortality, adjusting for potential confounders. Interactions between age and body composition on mortality were examined with likelihood ratio testing.
Results
Mean predicted fat mass was 24.1 kg [95% confidence interval (CI): 23.9–24.3) for male participants and 29.9 kg (95% CI: 29.6–30.1) for female participants, while mean predicted lean mass was 59.3 kg (95% CI: 59.1–59.5) for male participants and 41.7 kg (95% CI: 41.5–41.8) for female participants. During a median period of 9.7 years from the survey, 10 408 deaths occurred. When predicted fat and lean mass were both included in the model, predicted fat mass showed a U‐shaped association with all‐cause mortality, with significantly higher risk at two ends: Quintile 1 (HR, 1.17; 95% CI: 1.05–1.31), Quintile 2 (HR, 1.14; 95% CI: 1.04–1.26) and Quintile 5 (HR, 1.37; 95% CI: 1.12–1.68) compared with Quintile 3. In contrast, predicted lean mass showed a L‐shaped association with all‐cause mortality, with higher mortality in those with lower lean mass: Quintile 1 (HR, 1.64; 95% CI: 1.46–1.83) and Quintile 2 (HR, 1.29; 95% CI: 1.18–1.42) compared with Quintile 3. Similar results were found for cardiovascular, cancer, and respiratory cause‐specific mortality. Age was a significant modifier: There was a monotonic positive association of predicted fat mass with mortality in younger participants (<60 years), but an approximate J‐shaped association in older participants (≥60 years) (P interaction <0.001); there was a stronger inverse association between predicted lean mass and mortality in older participants (≥60) compared with those <60 years (P interaction <0.001).
Conclusions
In this US general population, predicted fat mass and lean mass were independent predictors for overall and cause‐specific mortality. Age was a significant modifier on the associations.
Keywords: Predicted fat mass, Predicted lean mass, Mortality, Age, Abdominal obesity
Introduction
Obesity is a major global public health problem, where the prevalence among adults has increased significantly in the past decade. 1 , 2 In the USA, the age‐standardized prevalence of obesity among adults increased from 33.7% in 2007–2008 to 39.6% in 2015–2016. 1 Although previous studies have provided evidence that obesity, assessed by body mass index (BMI), is a significant risk factor for increased risk of mortality, 3 BMI is an imperfect measure of adiposity because it cannot discriminate between fat mass and lean mass, 4 which are highly variable among individuals, even among those with the same BMI, 5 , 6 and confer opposite health effects. High adiposity 7 , 8 or low lean mass 5 has been associated with inflammation, metabolic impairments, endothelial dysfunction, and cardiovascular disease risk factors, including high blood pressure and abnormal lipid profile, all of which may lead to a greater risk of cardiovascular disease, cancer, and premature death. 5 , 7 , 8 As such, evaluating the role of lean mass and fat mass on mortality may yield new insights for clinical and public health.
To date, some studies have examined all‐cause mortality in the general population in relation to body composition as measured directly, by use of devises such as dual‐energy X‐ray absorptiometry or computed tomography, and the study designs, analyses, results, and interpretations of these studies have been heterogenous. 9 , 10 , 11 , 12 , 13 , 14 , 15 , 16 , 17 , 18 , 19 Of note, direct body composition measurement methods are impractical in large epidemiological studies for they are costly, time consuming, and a potential radiation hazard. 20 The majority of studies that have used direct body composition measures tended to be of relatively small sample size, with a short follow‐up period, and within a selected population (e.g. older population). Alternatively, indirect measures [e.g. bioelectrical impedance analysis (BIA)] 21 , 22 have been used to examine the association with mortality in relatively larger populations. However, the validity of BIA can be influenced by age, sex, race, body structure, disease state, and hydration status. 20 , 23 , 24 Indeed, predicted fat mass and lean mass can be calculated using the validated sex‐specific anthropometric prediction equations developed by the NHANES based on individual age, race, height, weight, and waist circumference (WC). 25 Recently, Lee et al. 6 demonstrated the utility of this approach to investigate the association of predicted lean body mass, fat mass, and BMI with all cause and cause specific mortality, but this study was limited to only male health professionals and has limited generalizability. Moreover, only a few studies 6 have been conducted to examine the association between body composition and a comprehensive range of cause‐specific mortality outcomes (cardiovascular disease‐related death, cancer‐related death, respiratory disease‐related death, and other death).
In addition, advancing age is associated with a decline in skeletal muscle mass and function, 5 while excessive adiposity occurs rapidly from young to midlife. 26 Although two previous studies, one on American male professionals aged 45–75 years, 6 and the other on Danish men and women aged 50 to 64 years, 21 did not observe any significant modifying effects of age on the association between fat mass and mortality, other studies have suggested that fat mass appears to be protective against mortality in older adults, 9 , 14 , 16 while increasing the mortality risk in younger adults. 17 , 19 Therefore, the potential for an age effect modification on the association between body composition and mortality warrants further investigation in the general population.
This study aimed to address the important gaps in knowledge noted earlier. Specifically, we examined the association of estimated fat mass and lean mass with all‐cause and cause‐specific mortality, using data from the National Health and Nutrition Examination Survey (NHANES, a representative sample of the US population) 1988–1994 and 1999–2014, coupled with mortality data from the National Death Index. We further investigated the a priori hypothesis that age may modify the association between fat mass, lean mass and mortality.
Methods
The NHANES is a series of cross‐sectional surveys conducted periodically before 1994; beginning in 1999, it became a continuous programme, with every 2 years representing one cycle. To select participants representative of the civilian, non‐institutionalized US population, NHANES excluded all persons in supervised care or custody in institutional settings, all active‐duty military personnel, active‐duty family members living overseas, and any other US citizens residing outside the 50 states and the District of Columbia. Non‐institutional group quarters (such as college and university residence halls) were included in the survey. NHANES used a complex, multistage, four‐stage sampling design: first, selection of the primary sampling units (i.e. mostly individual counties); second, selection of segments within the counties; third, selection of dwelling units or households within segments; and fourth, selection of individuals within a household. Oversampling of certain population subgroups was also performed to increase the reliability and precision of health status indicator estimates for these particular subgroups, and therefore, sampling weights and the complex survey design must be taken into account in the data analysis. A household interview and a physical examination at a mobile examination centre were completed once per individual. Detailed survey operation manuals, consent documents, and brochures of each period are available on the NHANES website. 27 NHANES was approved by the National Center for Health Statistics Institutional Review Board and all participants signed an informed consent.
In this study, we analysed data from the NHANES III (1988–1994) and continuous NHANES (1999–2014) datasets. We restricted our analysis to persons who were ≥18 years and not pregnant (n = 65 113). Those with missing information on death status (n = 96) or missing any information (age, race, height, weight, and WC) that is needed to predict fat mass and lean mass (n = 7965), or those with BMI below 18.5 or above 60 kg/m2 (n = 1234) were further excluded. Therefore, a total of 55 818 participants were enrolled in our present analysis (Supporting information, Figure S1).
Exposure variables
Predicted fat mass and lean mass were calculated using prediction equations developed by the NHANES survey, which included 7531 men and 6534 women who underwent dual‐energy X‐ray absorptiometry (DXA) examination. 25 Briefly, fat mass and lean mass, measured by DXA, were defined as the dependent variables and linear regression was conducted using age, race, height, weight, and WC as independent variables to derive predicted fat mass and lean mass. The prediction equations showed high predictive ability for both fat mass (R 2 = 0.90) and lean mass (R 2 = 0.91). Sex‐specific equations were further validated by comparing the predicted scores and the DXA‐measured values in an independent validation group consisting of 2292 men and 2015 women for cross‐validation, and by calculating the correlation of actual and predicted fat mass with obesity‐related biomarkers [triglycerides, total cholesterol (TC), high‐density lipoprotein cholesterol (HDL‐C), low‐density lipoprotein cholesterol (LDL‐C), glucose, insulin, and C‐reactive protein]. Actual and predicted fat mass and lean mass showed robustly high agreement with no evidence of bias, and the developed equations performed well in different subgroups, stratified by disease status, age, BMI, smoking status, and race/ethnicity. Moreover, predicted fat mass and DXA‐measured fat mass showed similar correlations with obesity‐related biomarkers. The sex‐specific anthropometric prediction equations are presented as follows.
For women:
For men:
For race, the reference group is White.
Covariates
Interviews were conducted using standardized questionnaires to collect detailed information on covariates including age, sex, race/ethnicity, education level, marital status, leisure physical activity level, smoking status, and self‐reported history of diabetes, hypertension, cardiovascular disease, and cancer. Body measurements and blood pressure measurements were collected during a mobile physical examination. BMI was calculated as weight (kg) divided by the square of height (m2). WC was measured to the nearest 0.1 cm at the high point of the iliac crest at minimal respiration, using a steel measuring tape.
Serum and urine samples were collected during the physical examination. Serum creatinine was measured using the kinetic rate Jaffe method, and all serum creatinine measurements were recalibrated to the standardized creatinine measurements obtained at the Cleveland Clinic Research Laboratory (Cleveland, Ohio) to appropriately estimate glomerular filtration rate (GFR). 28 The estimated GFR (eGFR) was calculated using the Chronic Kidney Disease Epidemiology Collaboration (CKD‐EPI) equation. 29 Urine albumin and creatinine concentrations were measured in a random single‐voided urine sample using a solid‐phase fluorescent immunoassay and a Jaffe rate reaction, respectively. Serum TC was measured enzymatically, and HDL‐C was measured by direct immunoassay. Haemoglobin A1c (HbA1c) was measured using high‐pressure liquid chromatography.
General obesity was defined as BMI ≥ 30 kg/m2, and abdominal obesity was defined as WC ≥ 88 cm for female participants and ≥102 cm for male participants. 30 Active leisure physical activity level was defined as being active at least one time per week. History of hypertension was defined as mean systolic blood pressure ≥140 mmHg and/or mean diastolic blood pressure ≥90 mmHg, or having a self‐reported history of hypertension, or undergoing antihypertensive treatment. History of diabetes was defined as having a self‐reported history of diabetes, undergoing glucose‐lowering therapy, or HbA1c ≥ 6.5%. History of chronic kidney disease (CKD) was defined as eGFR <60 mL/min/1.73 m2 or urinary albumin‐to‐creatinine ratio ≥30 mg/g.
Ascertainment of death
Mortality status of the NHANES participants was ascertained by probabilistic matching with the National Death Index through 31 December 2015. 31 All participants with sufficient identifying data were eligible for mortality status, and any survey participant record that did not meet the minimum data requirements was ineligible for record linkage. Data on the leading cause of death were used for case definition according to the codes of the International Classification of Diseases 10th Revision (ICD‐10). The primary outcomes for this study were mortality from all causes, cardiovascular diseases [codes I00–I09 (Acute rheumatic fever and chronic rheumatic heart diseases), I11 (Hypertensive heart disease), I13 (Hypertensive heart and renal disease), I20–I25 (Ischaemic heart disease), I26–I51 (Other heart diseases), and I60–I69 (Cerebrovascular diseases)], cancer (codes C00–C97), respiratory disease [codes J40–J47 (Chronic lower respiratory diseases) and J09–J18 (Influenza and pneumonia)], and other causes [codes V01–X59, Y85–Y86 (Transport and nontransport accidents); G30 (Alzheimer's disease); E10–E14 (Diabetes mellitus); N00–N07, N17–N19, N25–N27 (Nephritis, nephrotic syndrome and nephrosis); and all other causes].
Statistical analysis
All statistical analyses accounted for complex survey design factors for NHANES, including sample weights, stratification, and clustering, following the NHANES analytic and reporting guidelines. 27 Considering the non‐linear relation of predicted fat mass and lean mass with mortality found in previous studies, 6 and the unknown cut points for predicted fat mass and lean mass, we divided predicted fat mass and lean mass into sex‐specific quintiles throughout the study. Comparison of characteristics according to quintiles of predicted fat mass and lean mass was performed by χ 2 tests for categorical variables and one‐way analysis of variance (ANOVA) for continuous variables.
Person‐years were counted from enrolment to the date of death or censoring (31 December 2015), whichever came first. Kaplan–Meier curves were used to show cumulative survival and multivariable Cox regression was used to investigate the associations of predicted fat mass and lean mass with mortality. In multivariable models, potential confounders that were known to be traditional or suspected risk factors for mortality were adjusted for, including age, sex, height, race/ethnicity, education level, marital status, smoking status, history of hypertension and diabetes, leisure physical activity level, HDL‐C, and TC. To examine the independent association of predicted fat mass and lean mass with mortality, predicted fat mass, and lean mass were further mutually adjusted for in an additional model. The covariates used in different models are listed in Table S1. Multicollinearity among the covariates, as well as between the covariates and predicted fat mass and lean mass, was assessed with variance inflation factors (VIFs). Multicollinearity was considered high when VIF was >10, and no significant multicollinearity was detected in our current study.
To evaluate whether age modified the associations of predicted fat mass and lean mass with all‐cause mortality, participants were divided into two groups: young to middle‐aged (18–59 years) and elderly (≥60 years), and stratified analyses by age group were performed. As additional exploratory analyses, possible modifications were assessed for variables including general obesity (no or yes), abdominal obesity (no or yes), smoking status (never or ever), history of hypertension (no or yes), history of diabetes (no or yes), and history of CKD (no or yes). Interactions between subgroups and body composition were examined by including interaction terms into the models with the use of likelihood ratio testing.
In order to test the robustness of the results, we conducted separate analyses by sex and an additional analysis that excluded any early deaths occurring within the first 2 years after enrolment. Because the prevalence of cardiovascular disease (7.0%) and cancer (8.3%) was relatively low, we did not adjust for history of cardiovascular disease and cancer in the main analysis; however, a sensitivity analysis was conducted to consider their confounding effect on the results by further adjusting for history of cardiovascular disease and cancer as well as excluding those with cardiovascular disease or cancer. In addition, we also examined the relationship of fat mass and lean mass with 5, 10, 15, and 20 year all‐cause mortality to address survivorship bias due to the long length of time between body composition assessment and mortality ascertainment.
A two‐tailed P < 0.05 was considered to be statistically significant in all analyses. Analyses were performed using R 3.6.3 software (http://www.R‐project.org/).
Results
Characteristics of the participants
Among the 55 818 participants in the current study, 50.6% were female. The ranges of predicted fat mass (kg) across quintiles were <21.0, 21.0–<26.2, 26.2–<31.7, 31.7–<39.6, ≥39.6 for female participants; and <16.2, 16.2–<20.9, 20.9–<25.3, 25. 3–<31.0, ≥31.0 for male participants; the ranges of predicted lean mass (kg) across quintiles were: <35.7, 35.7–<39.0, 39.0–<42.4, 42.4–<47.2, and≥47.2 for female participants; and <50.3, 50.3–<54.8, 54.8–<59.2, 59.2–<65.4, and ≥65.4 for male participants.
Characteristics of the study participants with unweighted sample sizes and weighted estimates according to sex‐specific quintiles of predicted fat mass and lean mass are presented in Table 1. Participants with higher levels of predicted fat mass tended to be taller, have higher BMI, lower leisure physical activity levels, and a higher prevalence of diabetes and hypertension, and more likely to be older and ever smokers. Those with higher levels of predicted lean mass tended to be taller, have higher BMI and better education levels, and were less likely to be Mexican American. Characteristics of female participants and male participants are shown in Tables S2 and S3.
Table 1.
Characteristics of study participants according to sex‐specific quintiles of predicted fat and lean mass a
| Quintiles of predicted fat mass b | P value | Quintiles of predicted lean mass b | P value | |||||
|---|---|---|---|---|---|---|---|---|
| Q1 | Q3 | Q5 | Q1 | Q3 | Q5 | |||
| N | 11 164 | 11 163 | 11 165 | 11 164 | 11 163 | 11 165 | ||
| Mean (95% CI) age, year | 37.4 (36.8–38.0) | 48.1 (47.5–48.7) | 47.3 (46.7–47.8) | <0.001 | 50.1 (49.5–50.8) | 44.1 (43.4–44.7) | 42.5 (42.0–43.0) | <0.001 |
| Male, No. (%) | 5559 (44.4) | 5558 (51.2) | 5559 (51.4) | <0.001 | 5559 (44.6) | 5558 (49.2) | 5559 (53.5) | <0.001 |
| Mean (95% CI) height, cm | 166.4 (166.1–166.7) | 169.0 (168.7–169.3) | 171.1 (170.9–171.4) | <0.001 | 160.7 (160.4–161) | 169.5 (169.3–169.8) | 174.3 (174.0–174.5) | <0.001 |
| Mean (95% CI) body mass index, kg/m2 | 21.3 (21.3–21.4) | 26.9 (26.9–27.0) | 36.9 (36.8–37.0) | <0.001 | 22.6 (22.5–22.7) | 26.1 (26.0–26.3) | 35.4 (35.2–35.6) | <0.001 |
| Ethnicity, No. (%) | <0.001 | <0.001 | ||||||
| Mexican American | 2241 (6.0) | 2677 (7.5) | 1914 (6.1) | 3514 (10.2) | 2342 (6.4) | 1283 (4.3) | ||
| Non‐Hispanic White | 4316 (69.3) | 4980 (73.4) | 5191 (73.3) | 4317 (64.7) | 5231 (75.8) | 4865 (72.0) | ||
| Non‐Hispanic Black | 2980 (12.0) | 2213 (9.8) | 3156 (13.8) | 1127 (5.1) | 2448 (9.7) | 4255 (18.2) | ||
| Other | 1627 (12.7) | 1293 (9.4) | 904 (6.8) | 2206 (20.0) | 1142 (8.0) | 762 (5.5) | ||
| Education, No. (%) | <0.001 | <0.001 | ||||||
| Less than high school | 3326 (21.6) | 3729 (22.1) | 3197 (20.6) | 4924 (31.6) | 3328 (19.9) | 2496 (16.4) | ||
| High school or equivalent | 2801 (29.6) | 2687 (28.3) | 2976 (30.9) | 2474 (28.0) | 2856 (28.8) | 3043 (30.2) | ||
| College or above | 4280 (48.8) | 4511 (49.6) | 4771 (48.5) | 3439 (40.4) | 4627 (51.4) | 5297 (53.4) | ||
| Marital status, No. (%) | <0.001 | <0.001 | ||||||
| Married | 4905 (53.7) | 6886 (68.8) | 6614 (66.2) | 6021 (58.5) | 6482 (64.5) | 6265 (64.8) | ||
| Separated | 1846 (15.5) | 2450 (18.4) | 2397 (18.6) | 2879 (23.2) | 2143 (17.1) | 2073 (15.9) | ||
| Never married | 3845 (30.9) | 1578 (12.9) | 1933 (15.1) | 1988 (18.4) | 2202 (18.4) | 2532 (19.3) | ||
| Leisure physical activity level, No. (%) | <0.001 | <0.001 | ||||||
| Inactive | 3881 (26.2) | 4617 (31.8) | 5491 (43.6) | 5373 (37.8) | 4269 (29.2) | 4800 (37.4) | ||
| Active | 6778 (73.8) | 6026 (68.2) | 5075 (56.4) | 5349 (62.2) | 6374 (70.8) | 5748 (62.6) | ||
| Never smoking, No. (%) | 5364 (51.2) | 5620 (49.3) | 5504 (48.4) | 0.067 | 5704 (51.1) | 5429 (48.5) | 5671 (50.4) | 0.063 |
| History of diabetes, No. (%) | 366 (2.2) | 1149 (6.4) | 2366 (18.1) | <0.001 | 1115 (6.5) | 1088 (6.4) | 1766 (13.1) | <0.001 |
| History of hypertension, No. (%) | 2223 (15.9) | 4474 (35.1) | 6184 (53.6) | <0.001 | 4361 (33.2) | 3803 (28.2) | 5252 (44.5) | <0.001 |
| Mean (95% CI) high‐density lipoprotein cholesterol, mmol/L | 1.5 (1.5–1.5) | 1.3 (1.3–1.3) | 1.2 (1.2–1.2) | <0.001 | 1.4 (1.4–1.5) | 1.4 (1.3–1.4) | 1.2 (1.2–1.2) | <0.001 |
| Mean (95% CI) total cholesterol, mmol/L | 4.8 (4.8–4.8) | 5.3 (5.3–5.4) | 5.2 (5.2–5.3) | <0.001 | 5.2 (5.1–5.2) | 5.2 (5.1–5.2) | 5.2 (5.1–5.2) | <0.001 |
All estimates accounted for sample weights and complex survey designs, and means and percentages were adjusted for survey weights of NHANES.
Sex‐ specific quintiles of predicted fat mass (kg): female participants: Q1: <21.0; Q2: 21.0–<26.2; Q3: 26.2–<31.7; Q4: 31.7–<39.6; Q5: ≥39.6; male participants: Q1: <16.2; Q2: 16.2–<20.9; Q3: 20.9–<25.3; Q4: 25.3–<31.0; Q5: ≥31.0; sex‐ specific quintiles of predicted lean mass (kg): female participants: Q1: <35.7; Q2: 35.7–<39.0; Q3: 39.0–<42.4; Q4: 42.4–<47.2; Q5: ≥47.2; male participants: Q1: <50.3; Q2: 50.3–<54.8; Q3: 54.8–<59.2; Q4: 59.2–<65.4; Q5: ≥65.4.
Relationship of predicted fat mass and lean mass with the risk of all‐cause mortality
During a median period of 9.7 years [interquartile range (IQR): 5.3–15.6 years], a total of 10 408 deaths occurred [median (IQR) time to death: 8.3 (4.3–13.6) years), including 2708 deaths from cardiovascular diseases, 2285 from cancer, and 641 from respiratory diseases, with a median time to death of 8.1 (4.1–13.1) years, 7.7 (3.7–13.0) years, and 9.4 (5.3–14.2) years, respectively.
Kaplan–Meier curves showed that participants in Quintile 1 of predicted fat mass had higher cumulative survival probability while those in Quintile 1 of predicted lean mass had lower cumulative survival probability ( Figure S2). However, when adjusted for age, participants in Quintile 3 of predicted fat mass or predicted lean mass had the lowest risk of all‐cause mortality (Table 2), and therefore, we defined the group with the lowest mortality risk in the age‐adjusted model (Quintile 3) as the reference group.
Table 2.
Hazard ratios (95% CI) of all‐cause mortality according to predicted fat mass and lean mass
| No. of deaths/total | Mortality rate a | Model 1 b | Model 2 b | Model 3 b | ||||
|---|---|---|---|---|---|---|---|---|
| HR (95%CI) | P value | HR (95%CI) | P value | HR (95%CI) | P value | |||
| Predicted fat mass | ||||||||
| Sex‐specific quintiles c | ||||||||
| Q1 | 1714/11164 | 8.0 | 1.15 (1.04, 1.28) | 0.008 | 1.25 (1.13, 1.38) | <0.001 | 1.17 (1.05, 1.31) | 0.006 |
| Q2 | 2189/11163 | 11.7 | 1.08 (0.98, 1.19) | 0.131 | 1.18 (1.07, 1.29) | 0.001 | 1.14 (1.04, 1.26) | 0.005 |
| Q3 | 2388/11163 | 13.7 | Ref | Ref | Ref | |||
| Q4 | 2215/11163 | 14.9 | 1.10 (0.99, 1.22) | 0.087 | 0.99 (0.89, 1.11) | 0.885 | 1.03 (0.91, 1.18) | 0.623 |
| Q5 | 1902/11165 | 15.4 | 1.47 (1.30, 1.66) | <0.001 | 1.21 (1.08, 1.37) | 0.001 | 1.37 (1.12, 1.68) | 0.002 |
| Predicted lean mass | ||||||||
| Sex‐specific quintiles c | ||||||||
| Q1 | 3420/11164 | 20.6 | 1.26 (1.16, 1.36) | <0.001 | 1.36 (1.25, 1.48) | <0.001 | 1.64 (1.46, 1.83) | <0.001 |
| Q2 | 2283/11163 | 12.5 | 1.13 (1.04, 1.22) | 0.004 | 1.20 (1.11, 1.31) | <0.001 | 1.29 (1.18, 1.42) | <0.001 |
| Q3 | 1795/11163 | 10.1 | Ref | Ref | Ref | |||
| Q4 | 1597/11163 | 10.2 | 1.12 (1.03, 1.21) | 0.005 | 1.04 (0.95, 1.15) | 0.385 | 0.95 (0.87, 1.04) | 0.281 |
| Q5 | 1313/11165 | 9.7 | 1.38 (1.21, 1.57) | <0.001 | 1.17 (1.03, 1.32) | 0.014 | 0.88 (0.75, 1.03) | 0.112 |
Mortality rates are presented as per 1000 person‐years.
Model 1: adjusted for age; Model 2: adjusted for age, sex, height, race/ethnicity, education level, marital status, smoking status, history of hypertension and diabetes, leisure physical activity level, high‐density lipoprotein cholesterol, and total cholesterol; Model 3: adjusted for the covariates in Model 2 and mutually adjusted for predicted fat mass or predicted lean mass.
Sex‐specific quintiles of predicted fat mass (kg): female participants: Q1: <21.0; Q2: 21.0–<26.2; Q3: 26.2–<31.7; Q4: 31.7–<39.6; Q5: ≥39.6; male participants: Q1: <16.2; Q2: 16.2–<20.9; Q3: 20.9–<25.3; Q4: 25.3–<31.0; Q5: ≥31.0; sex‐ specific quintiles of predicted lean mass (kg): female participants: Q1: <35.7; Q2: 35.7–<39.0; Q3: 39.0–<42.4; Q4: 42.4–<47.2; Q5: ≥47.2; male participants: Q1: <50.3; Q2: 50.3–<54.8; Q3: 54.8–<59.2; Q4: 59.2–<65.4; Q5: ≥65.4.
With adjustments for predicted lean mass and other important confounders, predicted fat mass showed a U‐shaped association with the risk of all‐cause mortality (Table 2). Compared with participants in sex‐specific Quintile 3, significantly higher risks of all‐cause mortality were found in Quintile 1 (HR, 1.17; 95% CI: 1.05–1.31), Quintile 2 (HR, 1.14; 95% CI: 1.04–1.26), and Quintile 5 (HR, 1.37; 95% CI: 1.12–1.68). Nevertheless, predicted lean mass showed a L‐shaped association with the risk of all‐cause mortality (Table 2) with higher risks of all‐cause mortality in sex‐specific Quintile 1 (HR, 1.64; 95% CI: 1.46–1.83) and Quintile 2 (HR, 1.29; 95% CI: 1.18–1.42) compared with Quintile 3.
Relationship of predicted fat mass and lean mass with the risk of cause‐specific mortality
We further examined the association of predicted fat mass and lean mass with cause‐specific mortality (Table 3). Mutually adjusted models showed that compared with Quintile 3, Quintile 5 of predicted fat mass was associated with a higher risk of mortality from cardiovascular diseases (HR, 1.24; 95% CI: 0.92–1.65), cancer (HR, 1.55; 95% CI: 1.12–2.12) and respiratory diseases (HR, 3.03; 95% CI: 1.72–5.34), while Quintile 1 of predicted fat mass was associated with a higher risk of mortality from cardiovascular diseases (HR, 1.22; 95% CI: 1.01–1.47). Moreover, compared with Quintile 3, Quintile 1 of predicted lean mass was associated with a higher risk of mortality from cardiovascular diseases (HR, 1.55; 95% CI: 1.18–2.03), cancer (HR, 1.31; 95% CI: 1.03–1.67) and respiratory diseases (HR, 2.15; 95% CI: 1.47–3.16) in the mutually adjusted models.
Table 3.
Hazard ratios (95% CI) of cause specific mortality according to predicted fat mass and lean mass a
| Sex‐specific quintiles | Cardiovascular disease death | Cancer death | Respiratory disease death | Other death | ||||
|---|---|---|---|---|---|---|---|---|
| HR (95%CI) | P value | HR (95%CI) | P value | HR (95%CI) | P value | HR (95%CI) | P value | |
| No. of deaths | 2708 | 2285 | 641 | 4713 | ||||
| Mortality rate per 1000 person‐years | 3.2 | 2.9 | 0.9 | 5.3 | ||||
| Predicted fat mass b | ||||||||
| Q1 | 1.22 (1.01, 1.47) | 0.043 | 1.01 (0.78, 1.31) | 0.926 | 1.32 (0.88, 1.98) | 0.177 | 1.16 (0.98, 1.38) | 0.089 |
| Q2 | 1.21 (1.01, 1.45) | 0.040 | 1.06 (0.84, 1.33) | 0.645 | 1.09 (0.77, 1.54) | 0.627 | 1.15 (1.01, 1.31) | 0.037 |
| Q3 | Ref | Ref | Ref | Ref | ||||
| Q4 | 0.99 (0.80, 1.22) | 0.922 | 1.17 (0.97, 1.41) | 0.092 | 1.52 (1.04, 2.20) | 0.029 | 0.94 (0.76, 1.15) | 0.525 |
| Q5 | 1.24 (0.92, 1.65) | 0.154 | 1.55 (1.12, 2.12) | 0.007 | 3.03 (1.72, 5.34) | <0.001 | 1.24 (0.94, 1.63) | 0.130 |
| Predicted lean mass b | ||||||||
| Q1 | 1.55 (1.18, 2.03) | 0.002 | 1.31 (1.03, 1.67) | 0.026 | 2.15 (1.47, 3.16) | <0.001 | 1.81 (1.53, 2.14) | <0.001 |
| Q2 | 1.14 (0.93, 1.40) | 0.216 | 1.21 (1.01, 1.45) | 0.036 | 1.48 (1.05, 2.08) | 0.026 | 1.43 (1.22, 1.68) | <0.001 |
| Q3 | Ref | Ref | Ref | Ref | ||||
| Q4 | 1.03 (0.79, 1.34) | 0.822 | 0.95 (0.76, 1.18) | 0.653 | 1.20 (0.81, 1.77) | 0.372 | 0.88 (0.75, 1.04) | 0.134 |
| Q5 | 0.97 (0.71, 1.34) | 0.865 | 0.73 (0.54, 1.00) | 0.051 | 0.96 (0.50, 1.86) | 0.914 | 0.90 (0.69, 1.18) | 0.456 |
All models were adjusted for age, sex, height, race/ethnicity, education level, marital status, smoking status, history of hypertension and diabetes, leisure physical activity level, high‐density lipoprotein cholesterol, and total cholesterol, and predicted fat mass or lean mass were mutually adjusted for in the models.
Sex‐ specific quintiles of predicted fat mass (kg): female participants: Q1: <21.0; Q2: 21.0–<26.2; Q3: 26.2–<31.7; Q4: 31.7–<39.6; Q5: ≥39.6; male participants: Q1: <16.2; Q2: 16.2–<20.9; Q3: 20.9–<25.3; Q4: 25.3–<31.0; Q5: ≥31.0; sex‐ specific quintiles of predicted lean mass (kg): female participants: Q1: <35.7; Q2: 35.7–<39.0; Q3: 39.0–<42.4; Q4: 42.4–<47.2; Q5: ≥47.2; male participants: Q1: <50.3; Q2: 50.3–<54.8; Q3: 54.8–<59.2; Q4: 59.2–<65.4; Q5: ≥65.4.
Assessment of age as an effect modifier
Among older participants (≥60 years), during a median period of 7.7 years (IQR: 4.2–12.3 years), a total of 7557 deaths occurred [median (IQR) time to death: 7.6 (4.0–12.3) years]; among younger participants (<60 years), during a median period of 10.9 years (IQR: 5.8–19.7 years), a total of 2851 deaths occurred [median (IQR) time to death: 10.8 (5.0–17.6) years].
Age significantly modified the associations of predicted lean mass and fat mass with all‐cause mortality: a stronger association between higher levels of predicted fat mass (Quintile 5 vs. 3) and mortality was found in younger participants compared with older participants (<60 vs. ≥60 years; P interaction <0.001; Figure 1), while a stronger protective association between predicted lean mass and mortality was found in older participants (≥60 vs. <60 years; P interaction <0.001; Figure 2). In addition, lower levels of predicted fat mass (Quintile 1 vs. 3) were associated with a lower risk of mortality in younger participants (HR, 0.57; 95% CI: 0.46–0.69) but not in older participants (HR, 1.01; 95% CI: 0.86–1.18) (Figure 1).
Figure 1.
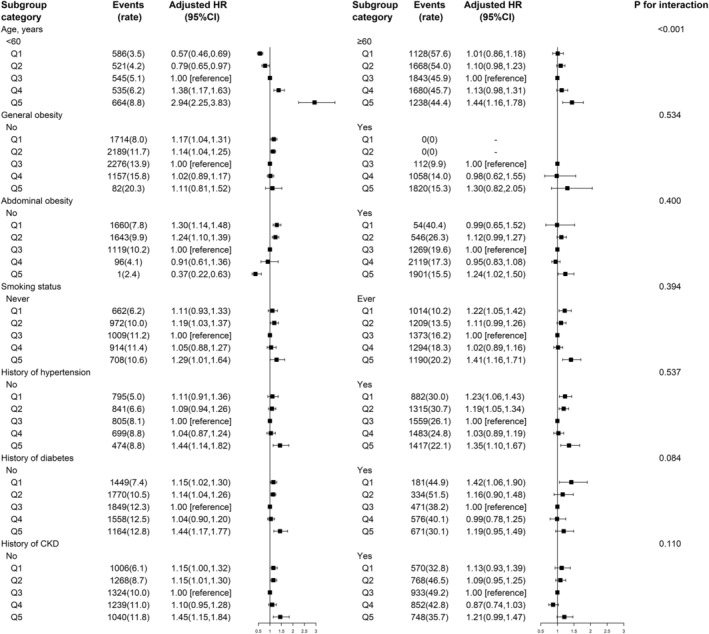
The association between predicted fat mass and risk of all‐cause mortality in various subgroups *Adjusted for age, sex, height, race/ethnicity, education level, marital status, smoking status, history of hypertension and diabetes, leisure physical activity level, high‐density lipoprotein cholesterol, total cholesterol, and predicted lean mass, if not already stratified; mortality rate is presented as per 1000 person‐years; sex‐specific quintiles of predicted fat mass (kg): female participants: Q1: <21.0; Q2: 21.0–<26.2; Q3: 26.2–<31.7; Q4: 31.7–<39.6; Q5: ≥39.6; Q5: ≥39.8; male participants: Q1: <16.2; Q2: 16.2–<20.9; Q3: 20.9–<25.3; Q4: 25.3–<31.0.
Figure 2.
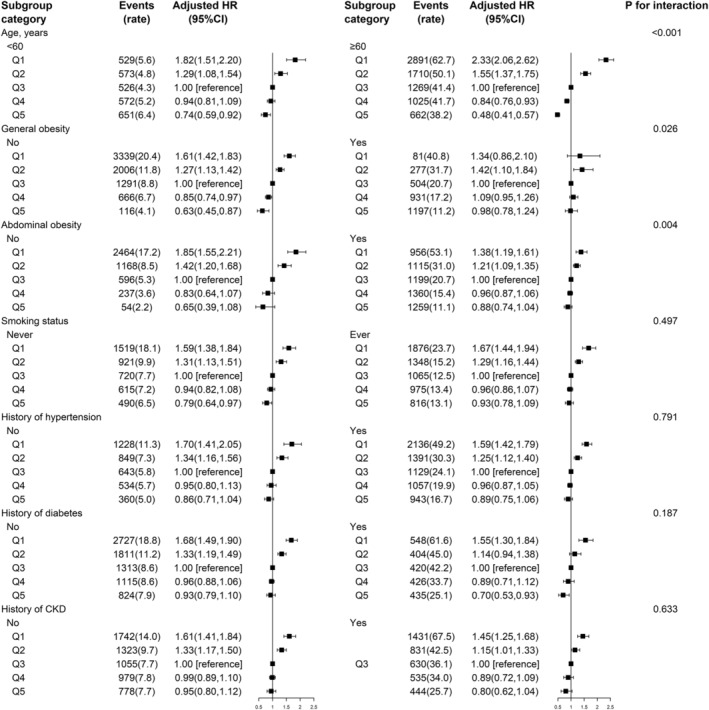
The association between predicted lean mass and risk of all‐cause mortality in various subgroups *Adjusted for age, sex, height, race/ethnicity, education level, marital status, smoking status, history of hypertension and diabetes, leisure physical activity level, high‐density lipoprotein cholesterol, total cholesterol, and predicted fat mass, if not already stratified; mortality rate is presented as per 1000 person‐years; sex‐ specific quintiles of predicted lean mass (kg): Female participants: Q1: <35.7; Q2: 35.7–<39.0; Q3: 39.0–<42.4; Q4: 42.4–<47.2; Q5: ≥47.2; male participants: Q1: Q1: <50.3; Q2: 50.3–<54.8; Q3: 54.8–<59.2; Q4: 59.2–<65.4; Q5: ≥65.4.
Assessment of other potential effect modifiers
Additional analyses showed a stronger association between predicted lean mass and mortality in those without general obesity (vs. with general obesity; P interaction = 0.026) or abdominal obesity (vs. with abdominal obesity; P interaction = 0.004) (Figure 2).
None of the other variables, including smoking status, history of hypertension, diabetes, and CKD, showed any effect modification on the association of predicted fat mass and lean mass with mortality in the total population (Figures 1 and 2).
Sensitivity analyses for the primary outcome
Our main findings remained robust in several sensitivity analyses. First, similar results were observed after conducting separate analyses by sex ( Tables S4 and S5). Second, the results did not change substantially with the exclusion of early deaths occurring within the first 2 years after enrolment, or with the exclusion of those with cardiovascular diseases or cancer, or after further adjustments for history of cardiovascular disease and cancer ( Table S6 ). Third, the relationships of fat mass and lean mass with 5, 10, 15, and 20 year all‐cause mortality were consistent with the main results with the exception that higher predicted fat mass showed no significant association with 5 and 10 year all‐cause mortality ( Table S7).
Discussion
In this large, prospective study of nationally representative US adults, we found a strong inverse association between predicted lean mass and mortality from all causes, cardiovascular disease, cancer and respiratory disease. In contrast, both higher and lower predicted fat mass were associated with higher risks of mortality from all causes and cardiovascular disease, while higher predicted fat mass was associated with higher risks of mortality from cancer and respiratory disease. Moreover, age significantly modified the relation of predicted fat mass and lean mass with all‐cause mortality.
To date, some studies have examined all‐cause mortality in relation to body composition measured directly or indirectly, but the reported findings have been inconsistent. 6 , 11 , 12 , 13 , 14 , 15 , 16 , 17 , 18 , 19 , 20 , 21 , 22 Of those, although not entirely consistent, eight studies 9 , 10 , 11 , 12 , 13 , 14 , 15 , 16 with relatively small sample size, tended to show that both lower levels of fat mass and lean mass were either associated with higher risk of mortality or were not associated with mortality. Several relatively large‐scale studies 6 , 17 , 18 , 19 , 21 , 22 have also been conducted. Two studies, a Canadian study of 54 420 participants aged over 40 years 17 and a US study of 9471 participants aged over 20 years 19 found that high DXA‐measured total fat per cent was significantly associated with increased risk of total mortality. Inconsistently, BIA‐assessed fat mass showed a J‐shaped or U‐shaped association with all‐cause mortality in a Danish follow‐up study with men and women (50 to 64 years of age) 21 and in the Melbourne Collaborative Cohort Study (27 to 75 years of age), 22 respectively. On the other hand, DXA‐measured muscle mass was inversely associated with mortality, 18 while BIA‐assessed fat‐free mass index showed a reversed J‐shaped association with mortality. 21 Recently, the Health Professionals Follow‐up Study introduced a new approach to estimate the body composition–mortality relationship, using validated anthropometric prediction equations, and found a monotonic positive association of predicted fat mass with mortality, and a U‐shaped association of predicted lean mass with mortality in men aged 40–75 years. 6 Overall, although the relations between fat mass and lean mass with mortality are still inconclusive, these large‐scale studies suggest that fat mass that is relatively too high and lean mass that is too low are both associated with increased risk of all‐cause mortality. Based on a large, nationally representative cohort of US adults, our current study further supports the above‐mentioned findings. Furthermore, we found that both higher levels of fat mass and lower levels of lean mass were associated with higher risks of mortality from cardiovascular disease, cancer, and respiratory disease, which is consistent with a previous study in American men. 6
In addition, our study expands the results of previously published studies by demonstrating that age may modify the association between predicted fat mass with all‐cause mortality. The age‐stratified analyses in our current study showed that there was a monotonic positive association of predicted fat mass with all‐cause mortality in younger participants, but an approximate J‐shaped trend in older participants. It has been suggested that the enhanced risk of mortality in older participants with lower fat mass may be attributed to reverse causation and potential confounding by smoking, recent weight loss, and pre‐existing disease. 20 Nonetheless, after considering these confounders, the association remained, perhaps indicating the importance of nutritional reserves on mortality in older age. In addition, our study showed that the inverse association between fat mass and mortality was stronger in those without abdominal obesity (vs. participants with abdominal obesity), suggesting that the increased mortality risk associated with low fat mass may partly be explained by loss of beneficial fat, such as gluteofemoral fat mass 32 and brown adipose tissue, 33 which are independently associated with a protective lipid and glucose profile and a decrease in cardiovascular and metabolic risk. Further work is needed to establish where region‐specific fat distribution is actually beneficial for older participants.
Moreover, possible modifiers for the association between lean mass and mortality have not been fully examined in previous studies. Interestingly, although we found a monotonic inverse association between predicted lean mass and mortality in the total population, stratified analyses showed that the inverse association was obviously attenuated in those with abdominal obesity, and a higher level of lean mass was obviously associated with lower mortality risk in those without general obesity or abdominal obesity. Because higher predicted lean mass was accompanied by higher BMI and WC levels, we speculated that the detrimental effect of obesity may partly obscure the benefit of higher lean mass on mortality. Furthermore, it has been reported that decreased quantity, quality, and function of muscle mass is a major contributor to outcomes in the elderly. Accordingly, our current study found a stronger inverse association between lean mass and mortality in older participants, providing further evidence for maintaining higher levels of lean muscle mass in older adults.
This study has several strengths, including its large and nationally representative population sample, the high number of deaths over a long‐term period, and the comprehensive adjustments for potential confounders. However, our study also has several limitations. First, our study was based on predicted body composition, a proxy of measured body composition by a gold standard method like DEXA, which did not include any information regarding novel parameters from each participant, but were predicted from common anthropometric variables, such as WC, which is strongly related to visceral fat deposits and has been considered a risk factor for mortality. 7 , 34 , 35 However, the hazard of lower lean mass in those without abdominal obesity and the hazard of higher fat mass in those with abdominal obesity in our study supported the independent role of predicted fat and lean mass on mortality. Considering that WC has a low capability to measure total body fat and does not necessarily reflect lean mass, our study suggests that the prediction equations could be used as supplementary approaches, in parallel with WC, to determine mortality risk. Second, predicted fat and lean mass were based on a one‐time assessment without repeated measures. As much can change for an individual over the study time frame, it is difficult to fully understand the relevance of these very early measures in predicting subsequent mortality. In order to address survivorship bias due to the long time period between body composition assessment and mortality ascertainment, we examined the relationships of fat mass and lean mass with 5, 10, 15, and 20 year all‐cause mortality, and the results were similar with the main results with the exception that there was no significant association of higher predicted fat mass with 5 and 10 year mortality, which may be partly explained by competing risks, because participants with a short time to death tended to be older and had a higher prevalence of medical conditions (e.g. hypertension, diabetes, cardiovascular disease, and cancer) and the stratified analyses did show that the association of higher predicted fat mass with mortality was weaker in older participants and participants with concomitant disease (hypertension, diabetes, or CKD), compared with younger participants and participants without concomitant disease respectively, although some P values for interaction were not significant. Third, although most confounders were taken into consideration, we cannot exclude other potential unmeasured or unknown residual confounding. Fourth, although the study population was diverse, we did not consider race‐specific thresholds for BMI and WC when defining obesity due to the absence of guidelines for WC cut points for different race/ethnicities (African American and Black). 30 Overall, a more comprehensive picture provided by further studies is required.
Conclusions
In conclusion, using data from a large, nationally representative cohort of US adults, we found that predicted lean mass was inversely associated with mortality, while predicted fat mass showed a monotonic, positive association with mortality in younger participants and a J‐shaped trend with mortality in older participants. As the inverse association of lean mass with mortality was stronger in the elderly, our results emphasize the importance of maintaining relatively higher levels of lean muscle mass in older adults and relatively lower levels of adiposity in younger individuals. If further confirmed, our findings may help bring understanding to the complex relationship between body composition and mortality.
Conflict of interest
No disclosures were reported.
Funding
The study was supported by the National Natural Science Foundation of China (81973133, 81730019).
Ethics statement
The authors of this manuscript certify that they comply with the ethical guidelines for authorship and publishing in the Journal of Cachexia, Sarcopenia and Muscle. 36
Supporting information
Figure S1.Flow chart of the participants in the current analysis.
Figure S2. Kaplan–Meier Curves of cumulative survival according to quintiles of predicted fat mass and lean mass.
Table S1. Adjusted covariates used in three different models for all participants.
Table S2. Baseline characteristics of female study participants according to quintiles of predicted fat and lean mass.
Table S3. Baseline characteristics of male study participants according to quintiles of predicted fat and lean mass.
Table S4. Hazard ratios (95% CI) of all‐cause mortality according to predicted fat mass and lean mass among females.
Table S5. Hazard ratios (95% CI) of all‐cause mortality according to predicted fat mass and lean mass among males.
Table S6. Sensitivity analyses of predicted fat mass and lean mass in relation to all‐cause mortality.
Table S7. Relationships of predicted fat mass and lean mass with all‐cause mortality at 5‐year mortality intervals.
Acknowledgements
The authors thank the investigators and participants of the National Health and Nutrition Examination Survey, the parent study, who made this report possible.
Liu M., Zhang Z., Zhou C., Ye Z., He P., Zhang Y., Li H., Liu C., and Qin X. (2022) Predicted fat mass and lean mass in relation to all‐cause and cause‐specific mortality, Journal of Cachexia, Sarcopenia and Muscle, 13, 1064–1075, 10.1002/jcsm.12921
References
- 1. Hales CM, Fryar CD, Carroll MD, Freedman DS, Ogden CL. Trends in obesity and severe obesity prevalence in US youth and adults by sex and age, 2007–2008 to 2015–2016. JAMA 2018;319:1723–1725. [DOI] [PMC free article] [PubMed] [Google Scholar]
- 2. Dai H, Alsalhe TA, Chalghaf N, Riccò M, Bragazzi NL, Wu J. The global burden of disease attributable to high body mass index in 195 countries and territories, 1990–2017: an analysis of the Global Burden of Disease Study. PLoS Med 2020;17:e1003198. [DOI] [PMC free article] [PubMed] [Google Scholar]
- 3. Bhaskaran K, Dos‐Santos‐Silva I, Leon DA, Douglas IJ, Smeeth L. Association of BMI with overall and cause‐specific mortality: a population‐based cohort study of 3.6 million adults in the UK. Lancet Diabetes Endocrinol 2018;6:944–953. [DOI] [PMC free article] [PubMed] [Google Scholar]
- 4. Rothman KJ. BMI‐related errors in the measurement of obesity. Int J Obes (Lond) 2008;32:S56–S59. [DOI] [PubMed] [Google Scholar]
- 5. Wannamethee SG, Atkins JL. Muscle loss and obesity: the health implications of sarcopenia and sarcopenic obesity. Proc Nutr Soc 2015;74:405–412. [DOI] [PubMed] [Google Scholar]
- 6. Lee DH, Keum N, Hu FB, Orav EJ, Rimm EB, Willett WC, et al. Predicted lean body mass, fat mass, and all cause and cause specific mortality in men: prospective US cohort study. BMJ 2018;362:k2575. [DOI] [PMC free article] [PubMed] [Google Scholar]
- 7. Jayedi A, Soltani S, Zargar MS, Khan TA, Shab‐Bidar S. Central fatness and risk of all‐cause mortality: systematic review and dose‐response meta‐analysis of 72 prospective cohort studies. BMJ 2020;370:m3324. [DOI] [PMC free article] [PubMed] [Google Scholar]
- 8. Fontana L, Hu FB. Optimal body weight for health and longevity: bridging basic, clinical, and population research. Aging Cell 2014;13:391–400. [DOI] [PMC free article] [PubMed] [Google Scholar]
- 9. de Santana FM, Domiciano DS, Gonçalves MA, Machado LG, Figueiredo CP, Lopes JB, et al. Association of appendicular lean mass, and subcutaneous and visceral adipose tissue with mortality in older Brazilians: the Sao Paulo Ageing & Health Study. J Bone Miner Res 2019;34:1264–1274. [DOI] [PubMed] [Google Scholar]
- 10. Auyeung TW, Lee JSW, Leung J, Kwok T, Leung PC, Woo J. Survival in older men may benefit from being slightly overweight and centrally obese—a 5‐year follow‐up study in 4,000 older adults using DXA. J Gerontol A Biol Sci Med Sci 2009;65:99–104. [DOI] [PMC free article] [PubMed] [Google Scholar]
- 11. Cesari M, Pahor M, Lauretani F, Zamboni V, Bandinelli S, Bernabei R, et al. Skeletal muscle and mortality results from the InCHIANTI study. J Gerontol A Biol Sci Med Sci 2009;64:377–384. [DOI] [PMC free article] [PubMed] [Google Scholar]
- 12. Newman AB, Kupelian V, Visser M, Simonsick EM, Goodpaster BH, Kritchevsky SB, et al. Strength, but not muscle mass, is associated with mortality in the health, aging and body composition study cohort. J Gerontol A Biol Sci Med Sci 2006;61:72–77. [DOI] [PubMed] [Google Scholar]
- 13. Toss F, Wiklund P, Nordstrom P, Nordstrom A. Body composition and mortality risk in later life. Age Ageing 2012;41(5):677–681. 10.1093/ageing/afs087 [DOI] [PubMed] [Google Scholar]
- 14. Rolland Y, Gallini A, Cristini C, Schott AM, Blain H, Beauchet O, et al. Body‐composition predictors of mortality in women aged ≥75 y: data from a large population‐based cohort study with a 17‐y follow‐up. Am J Clin Nutr 2014;100:1352–1360. [DOI] [PubMed] [Google Scholar]
- 15. Wijnhoven HAH, Snijder MB, van Bokhorst‐de Van Der Schueren MAE, Deeg DJH, Visser M. Region‐specific fat mass and muscle mass and mortality in community‐dwelling older men and women. Gerontology 2012;58:32–40. [DOI] [PubMed] [Google Scholar]
- 16. Spahillari A, Mukamal KJ, DeFilippi C, Kizer JR, Gottdiener JS, Djoussé L, et al. The association of lean and fat mass with all‐cause mortality in older adults: the Cardiovascular Health Study. Nutr Metab Cardiovasc Dis 2016;26:1039–1047. [DOI] [PMC free article] [PubMed] [Google Scholar]
- 17. Padwal R, Leslie WD, Lix LM, Majumdar SR. Relationship among body fat percentage, body mass index, and all‐cause mortality: a cohort study. Ann Intern Med 2016;164:532–541. [DOI] [PubMed] [Google Scholar]
- 18. Abramowitz MK, Hall CB, Amodu A, Sharma D, Androga L, Hawkins M. Muscle mass, BMI, and mortality among adults in the United States: a population‐based cohort study. PLoS ONE 2018;13:e194697. [DOI] [PMC free article] [PubMed] [Google Scholar]
- 19. Zong G, Zhang Z, Yang Q, Wu H, Hu FB, Sun Q. Total and regional adiposity measured by dual‐energy X‐ray absorptiometry and mortality in NHANES 1999–2006. Obesity 2016;24:2414–2421. [DOI] [PMC free article] [PubMed] [Google Scholar]
- 20. Lee DH, Giovannucci EL. Body composition and mortality in the general population: a review of epidemiologic studies. Exp Biol Med (Maywood) 2018;243:1275–1285. [DOI] [PMC free article] [PubMed] [Google Scholar]
- 21. Bigaard J, Frederiksen K, Tjønneland A, Thomsen BL, Overvad K, Heitmann BL, et al. Body fat and fat‐free mass and all‐cause mortality. Obes Res 2004;12:1042–1049. [DOI] [PubMed] [Google Scholar]
- 22. Simpson JA, MacInnis RJ, Peeters A, Hopper JL, Giles GG, English DR. A comparison of adiposity measures as predictors of all‐cause mortality: the Melbourne Collaborative Cohort Study. Obesity (Silver Spring) 2007;15:994–1003. [DOI] [PubMed] [Google Scholar]
- 23. Rush EC, Chandu V, Plank LD. Prediction of fat‐free mass by bioimpedance analysis in migrant Asian Indian men and women: a cross validation study. Int J Obes (Lond) 2006;30:1125–1131. [DOI] [PubMed] [Google Scholar]
- 24. Bi X, Loo YT, Henry CJ. Body Fat Measurements in Singaporean Adults Using Four Methods. Nutrients 2018;10:303. [DOI] [PMC free article] [PubMed] [Google Scholar]
- 25. Lee DH, Keum N, Hu FB, Orav EJ, Rimm EB, Sun Q, et al. Development and validation of anthropometric prediction equations for lean body mass, fat mass and percent fat in adults using the National Health and Nutrition Examination Survey (NHANES) 1999–2006. Br J Nutr 2017;118:858–866. [DOI] [PubMed] [Google Scholar]
- 26. Sheehan TJ, DuBrava S, DeChello LM, Fang Z. Rates of weight change for black and white Americans over a twenty‐year period. Int J Obes Relat Metab Disord 2003;27:498–504. [DOI] [PubMed] [Google Scholar]
- 27. Centers for Disease Control and Prevention . About the National Health and Nutrition Examination Survey. https://www.cdc.gov/nchs/nhanes/about_nhanes.htm
- 28. Murphy D, McCulloch CE, Lin F, Banerjee T, Bragg‐Gresham JL, Eberhardt MS, et al. Trends in prevalence of chronic kidney disease in the United States. Ann Intern Med 2016;165:473–481. [DOI] [PMC free article] [PubMed] [Google Scholar]
- 29. Levey AS, Stevens LA, Schmid CH, Zhang YL, Castro AF 3rd, Feldman HI, et al. A new equation to estimate glomerular filtration rate. Ann Intern Med 2009;150:604–612. [DOI] [PMC free article] [PubMed] [Google Scholar]
- 30. Jensen MD, Ryan DH, Apovian CM, Ard JD, Comuzzie AG, Donato KA, et al. 2013 AHA/ACC/TOS guideline for the management of overweight and obesity in adults: a report of the American College of Cardiology/American Heart Association Task Force on Practice Guidelines and The Obesity Society. Circulation 2014;129:S102–S138. [DOI] [PMC free article] [PubMed] [Google Scholar]
- 31. National Center for Health Statistics . 2015 public‐use linked mortality files 2019. https://www.cdc.gov/nchs/data‐linkage/mortality‐public.htm
- 32. Manolopoulos KN, Karpe F, Frayn KN. Gluteofemoral body fat as a determinant of metabolic health. Int J Obes (Lond) 2010;34:949–959. [DOI] [PubMed] [Google Scholar]
- 33. Becher T, Palanisamy S, Kramer DJ, Eljalby M, Marx SJ, Wibmer AG, et al. Brown adipose tissue is associated with cardiometabolic health. Nat Med 2021;27:58–65. [DOI] [PMC free article] [PubMed] [Google Scholar]
- 34. Jacobs EJ, Newton CC, Wang Y, Patel AV, McCullough ML, Campbell PT, et al. Waist circumference and all‐cause mortality in a large US cohort. Arch Intern Med 2010;170:1293–1301. [DOI] [PubMed] [Google Scholar]
- 35. Koster A, Leitzmann MF, Schatzkin A, Mouw T, Adams KF, van Eijk JT, et al. Waist circumference and mortality. Am J Epidemiol 2008;167:1465–1475. [DOI] [PubMed] [Google Scholar]
- 36. von Haehling S, Morley JE, Coats AJS, Anker SD. Ethical guidelines for publishing in the Journal of Cachexia, Sarcopenia and Muscle: update 2019. J Cachexia Sarcopenia Muscle 2019;10:1143–1145. [DOI] [PMC free article] [PubMed] [Google Scholar]
Associated Data
This section collects any data citations, data availability statements, or supplementary materials included in this article.
Supplementary Materials
Figure S1.Flow chart of the participants in the current analysis.
Figure S2. Kaplan–Meier Curves of cumulative survival according to quintiles of predicted fat mass and lean mass.
Table S1. Adjusted covariates used in three different models for all participants.
Table S2. Baseline characteristics of female study participants according to quintiles of predicted fat and lean mass.
Table S3. Baseline characteristics of male study participants according to quintiles of predicted fat and lean mass.
Table S4. Hazard ratios (95% CI) of all‐cause mortality according to predicted fat mass and lean mass among females.
Table S5. Hazard ratios (95% CI) of all‐cause mortality according to predicted fat mass and lean mass among males.
Table S6. Sensitivity analyses of predicted fat mass and lean mass in relation to all‐cause mortality.
Table S7. Relationships of predicted fat mass and lean mass with all‐cause mortality at 5‐year mortality intervals.