

Abstract
The effect of a human vascular endothelial growth factor antibody on the vasculature of human tumor grown in rat brain was studied. Using dynamic contrast-enhanced magnetic resonance imaging, the effects of intravenous bevacizumab (Avastin; 10 mg/kg) were examined before and at postadministration times of 1, 2, 4, 8, 12 and 24 h (N = 26; 4–5 per time point) in a rat model of orthotopic, U251 glioblastoma (GBM). The commonly estimated vascular parameters for an MR contrast agent were: (i) plasma distribution volume (vp), (ii) forward volumetric transfer constant (Ktrans) and (iii) reverse transfer constant (kep). In addition, extracellular distribution volume (VD) was estimated in the tumor (VD-tumor), tumor edge (VD-edge) and the mostly normal tumor periphery (VD-peri), along with tumor blood flow (TBF), peri-tumoral hydraulic conductivity (K) and interstitial flow (Flux) and tumor interstitial fluid pressure (TIFP). Studied as % changes from baseline, the 2-h post-treatment time point began showing significant decreases in vp, VD-tumor, VD-edge and VD-peri, as well as K, with these changes persisting at 4 and 8 h in vp, K, VD-tumor, -edge and -peri (t-tests; p < 0.05–0.01). Decreases in Ktrans were observed at the 2- and 4-h time points (p < 0.05), while interstitial volume fraction (ve; = Ktrans/kep) showed a significant decrease only at the 2-h time point (p < 0.05). Sustained decreases in Flux were observed from 2 to 24 h (p < 0.01) while TBF and TIFP showed delayed responses, increases in the former at 12 and 24 h and a decrease in the latter only at 12 h. These imaging biomarkers of tumor vascular kinetics describe the short-term temporal changes in physical spaces and fluid flows in a model of GBM after Avastin administration.
Keywords: Avastin, DCE-MRI, distribution volume, GBM, Ktrans, Magnevist, peri-tumoral fluid flow, rat, tumor interstitial fluid pressure
1 |. INTRODUCTION
We studied rat cerebral tumor xenografts of a human glioblastoma (GBM) cell line before, and in the hours after, administration of the human vascular endothelial growth factor (VEGF) antibody, Avastin (Genentech Inc., South San Francisco, CA, USA). Significant changes in the state of the vasculature and tumor microenvironment (TME) were observed in the short term (hours) after administration. Avastin does not affect the rat cerebrovascular system,1 and thus the result demonstrated an early response in the isolated tumor vascular system. A broad spectrum of parameters was estimated: tumor blood flow (TBF), the forward volumetric transfer constant (Ktrans), the extravascular extracellular space (ve), plasma volume (vp), the extracellular space (also known as the distribution volume [VD]), Flux, tumor interstitial fluid pressure (TIFP), and VD in the mostly normal tissue outside the rim of the tumor. These generated a description of the physical spaces and fluid flows in the tumor and its immediate surround, in the tumor at rest, and after a significant perturbation.
Avastin, a nonselective, recombinant humanized monoclonal antibody effectively blocks the actions of VEGF,2–4 and is often used to supplement chemotherapy and radiotherapy in cancer clinical treatments. Avastin received accelerated approval by the US Food and Drug Administration (FDA) for the treatment of recurrent GBM in 2009 vis-à-vis the BRAIN trial (A Study to Evaluate Bevacizumab Alone or in Combination with Irinotecan for Treatment of Glioblastoma Multiforme).5 Experimental data and clinical trials supported its use in controlling glioma size and/or brain edema.6,7 Avastin was expected to improve survival and quality of life in patients with GBM, compared with current protocols. However, two major studies, AVAglio8 and the Radiation Therapy Oncology Group (RTOG)9 clinical trials, failed to demonstrate additional benefits of Avastin in newly diagnosed GBM. Another recently concluded trial (EORTC26101) that tested Avastin in combination with Lomustine also reported similar results.10 Despite limitations, hope that Avastin improves patient outcomes continues, as does its use in cancer therapy, including for GBM.11,12
Pharmacologically, Avastin binds the human VEGF-A isoform and inhibits its downstream effects on vascular permeability and neovascularization via VEGF receptor (VEGFR)-1, -2 and -3–mediated actions.13 In the long term, Avastin induces vascular pruning, decreases tumor growth and may eventually lead to tumor shrinkage.14 In the short term, VEGF inhibition increases tumor perfusion and decreases vascular permeability, thus inducing a hydrostatic pressure gradient across the vascular wall (decreasing TIFP) that facilitates drug penetration.9,15–18 These effects are collectively referred to as “vascular normalization”,19 and are suggested to make concurrent radiotherapy and chemotherapy more efficient by increasing tumor oxygenation and drug delivery, respectively.20–22 In planning this study, we reasoned that vascular normalization, since it affects TIFP, should be accompanied by a spectrum of fluid-mechanical changes in the TME. Accordingly, physical estimates of spaces, flows and fluxes were planned via DCE-MRI experiments.
As noted, Avastin does not bind to the murine equivalent of VEGF-A.1 This might be seen as a limitation in studying vascular physiology in tumor models, but in murine xenografts with implanted human tumors, it offers a unique opportunity to isolate the effect of Avastin on the tumor vasculature itself.
Both retrospective6,7,23–25 and prospective26–28 approaches have examined tumor status and vascular function in GBM after VEGF inhibition by Avastin. These studies reported effects of Avastin following multiple injections over several days or weeks and showed an attenuation of vascular permeability, and an accompanying decrease in brain edema and tumor volume in patients. However, the literature is lacking in reports of Avastin’s effects on tumor vasculature shortly after administration. We report herein the effects of Avastin on a model of human brain tumor vascular physiology in the first few hours after intravenous (iv) administration. An athymic, immune-compromised rat model of orthotopic U251 glioblastoma xenograft was used in conjunction with repeated DCE-MRI measures to assess the tumor vasculature and TME before and after Avastin treatment. The effect of Avastin reported herein on vascular parameters, physical spaces and fluid flows is presumed to be a result of a direct effect on the VEGF produced by the human tumor, rather than an indirect effect on the rat vasculature.
2 |. MATERIALS AND METHODS
Avastin (bevacizumab) was a kind gift from Genentech Inc. All the other materials used were of pharmaceutical or analytical grade.
2.1 |. U251 rat model of orthotopic glioma
All experimental procedures were approved by the Institutional Animal Care and Use Committee (protocol IACUC #1388). Adult female, immune-compromised, RNU/RNU rats (n = 29) were intracerebrally implanted as follows: animals were anesthetized with isoflurane (4% for induction, 1.5% to 2.0% for maintenance, balance N2O:O2 = 2:1). The scalp was swabbed with Betadine and alcohol, the eyes coated with Lacri-lube and the head immobilized in a small animal stereotactic device (Kopf, Cayunga, CA, USA). After draping, a 1 cm incision was made 2 mm right of the midline and the skull exposed. A burr hole was drilled 3.5 mm to the right of bregma, without penetrating the dura. A #2701 10-μL Hamilton syringe with a 26-gauge needle containing freshly harvested U251 tumor cells from log phase growth (5 × 10⁵ cells in 10 μL of PBS) was lowered to a depth of 3.0 mm and then raised back up to a depth of 2.5 mm. Cells were injected at a rate of 0.5 μL/10 s until the entire volume was used. The needle was left in place for 5 min longer then gently withdrawn, the burr hole sealed with sterile bone wax and the scalp sutured.29–33 Rats were randomly distributed among the different time-treatment cohorts.
2.2 |. MRI studies
Next, 21–24 days after tumor induction, each animal was anesthetized with isoflurane (4% for induction, 0.75% to 1.5% for maintenance, balance N2O:O2 = 2:1) and allowed to spontaneously respire. A tail vein was cannulated for MRCA administration. Body temperature was maintained at 37°C with warm air and monitored via an intrarectal probe.
All studies were performed using a Varian (Agilent, Santa Clara, CA, USA), 7-T, 20-cm bore magnet and a Bruker console running Paravision 6.0 software. Gradient maximum strength and rise time were 250 mT/m and 120 μs, respectively. Transmit and receive coils included a Bruker Quadrature Birdcage (transmit) and four-channel phased-array surface coil receiver (Rapid MR International, Columbus, OH, USA). All MRI image sets were acquired with a 32 mm × 32 mm FOV. Two MRI studies were conducted with an interval of 24 h between the two. Avastin was administered at 1, 2, 4, 8, 12 or 24 h before the second MRI, thus yielding a study of the postadministration time dependence of tumor physiology.
To coregister images with postmortem histopathology, high-resolution T1-weighted images were acquired pre- and post-MRCA with the following parameters: matrix = 256 × 192, 27 slices, 0.5 mm thickness, no gap, number of echoes (NE) = 1, number of averages (NA) = 4, and TE/TR = 16/800 ms in a spin-echo sequence. TBF was measured by arterial spin labeling (ASL). ASL data were acquired to estimate tumor and cerebral blood flow in a single central slice.34 Sets of MRI parameters were obtained with alternating gradients and frequency offsets in combinations of four as follows: matrix = 128 × 64, one 2.0-mm slice, NA = 2, TE/TR = 24/1500 ms, arterial labeling = 1 s, and total time = 13 min.
Two Look-Locker (LL) sequences were run to produce voxel-by-voxel maps of tissue T1 prior to, and immediately after, a dual gradient echo (2GE) DCE-MRI study. LL sequence parameters were as follows: matrix = 128 × 64, five 2.0-mm slices, no gap, NE = 24 inversion-recovery echoes, and TR = 2000 ms. The DCE-MRI 2GE sequence that was run between the paired LL acquisitions had the following parameters: 150 acquisitions at 4.0-s intervals, matrix = 128 × 64, three 2.0-mm slices, no gap, flip angle = 27°, NE = 2, NA = 1, TE = 2.0, 4.0 ms, TR = 60 ms, and SW = 150 kHz. The slice positioning was matched for the DCE-MRI and LL sequences. The bolus MRCA (Magnevist, Bayer Healthcare Pharmaceuticals, Wayne, NJ, USA) injection was performed by hand push at image 15. The total MR run time was 10 min.
2.3 |. Drug administration
Avastin was injected as a single 30-min iv infusion at a dose of 10 mg/kg in a volume of 1.0 mL. Following drug administration, depending on the group assignment for each rat, the second imaging session was conducted at 1, 2, 4, 8, 12 or 24 h post-treatment (please see the flowchart in the supporting information). Since the 24-h test–retest behavior of vascular estimates in our DCE-MRI studies has been studied,29 this had the effect of providing a temporal record of changes in vascular parameters at 1 to 24 h after the administration of Avastin. This protocol has been conducted in multiple studies published by our group.29–33,35–38
2.4 |. Data analysis
DCE-MRI brain tumor studies contain varying amounts of information, depending (among other things) on whether or not the blood–brain barrier has been breached in a particular voxel. In the central mass of many brain tumors, the microvasculature is abnormal and quite permeable to the MRCA, while in normal brain, the microvasculature is impermeable to those agents. Thus, to produce stable estimates of model parameters, the data should be queried voxel-by-voxel as to which model best describes the temporal behavior of the data. We have employed a data-driven analytical approach that, among the pharmacokinetic models employed, identifies the model that best balances bias and variance.39–41 This approach generally produces stable estimates of those vascular parameters available to the model chosen. While seldom employed in DCE-MRI studies, such an approach is part of the standard toolkit of physical scientists and applied mathematicians.42,43
The long history of pharmacokinetic studies using radioactive tracers has provided a number of widely used models that predate even the earliest MRI study designed to estimate vascular parameters.44 These earlier approaches, particularly the Patlak,45 revised Patlak46 (mathematically identical to the extended Tofts model)47 and the Logan48 models, are suitable for the analysis of DCE-MRI. Notably, two of them (the Patlak and Logan models) rely on the linearization of temporally varying data for model confirmation, and the third (the revised Patlak model) can be linearized.39–41 This allows the inspection of plotted data to confirm the appropriateness of the model for the available data. For examples of linearization of DCE-MRI data, see Figure S1 for a Patlak plot and an extended Patlak plot, and Figure S2 for a Logan plot.
As noted, there are a variety of conditions in the tissue under study. In normal tissue, the vasculature is not permeable to contrast agents of any size. In that case, only the plasma volume of the vasculature, vp, can be estimated. In other tissue, for instance in ischemic tissue, a slow leakage of the contrast agent from the vasculature to the interstitial space can be measured, allowing both vp and the forward volumetric transfer constant, Ktrans, to be estimated from a record of contrast versus time.34 Finally, in typical tumors studied with light contrast agents, an approach to equilibration between the plasma concentration and the extravascular concentration can be observed, allowing vp, Ktrans, and the reverse transfer constant, kep, to be estimated. In this latter case, the extracellular, extravascular volume fraction, ve, can be calculated as the ratio . The three nested models that accomplish these estimates are here called Model 1, Model 2 and Model 3. Model 2 and Model 3 employ the Patlak and Standard models (see the supporting information). In the process of constructing the three models, they are compared with one another, and the model that best balances variance and bias is chosen. In typical data, a map of model selection serves to delineate not only which model is best, but, because of the vascular physiology of cerebral tumors, where the tumor mass is in the DCE-MRI images.39–41 In this paper, for each animal, the means of the parameters Ktrans, ve and vp in the Model 3 region corresponding to the tumor are reported as summary measures of tumor vascular parameters.
We followed published conventions that describe peri-tumoral MRCA/exudate flow estimation techniques in embedded brain tumors to demarcate the tumor_edge and _periphery.33 Tumor rim was the last set of pixels that circumscribed the tumor inner border as determined by comparing the DCE-MRI maps with its own postcontrast T1-weighted image and the H&E histology. The tumor periphery is the immediate set of pixels surrounding the tumor border that constitutes the peri-tumoral normal brain region where the contrast agent is presumed to flow outward without vascular resorption.
In regions with a measurable kep, an equilibration between the extravascular and intravascular contrast agent concentrations will eventually take place. Usually, in our experience, this equilibration is approached during the latter half of the 10-min DCE-MRI study. For almost all MRI contrast agents, there is little or no affinity between the agent and intravascular or extravascular elements; the binding potentials are close to zero. (But note that gadofosveset does bind to serum albumin, and possibly also to extravascular sites49,50). In the absence of binding, a Logan plot of DCE-MRI data will eventually linearize (Figure S2). Assuming no uptake by living cells, the linear part of the Logan plot will have a slope that estimates the entire extracellular volume fraction; this parameter is called the distribution volume, VD. Note that, formally, VD = ve+vp, and in our studies, these two estimates do not disagree,29 but because it is one of only two parameters to be estimated, rather than the three of Model 3, VD is usually a more stable point estimate than the sum of ve and vp. In this paper, for each animal, the mean of the parameter VD in the Model 3 region is reported as a summary measure, VD-tumor. In addition, the mean of the distribution volume in an ROI consisting of the outer rim of voxels in the Model 3 region is reported as VD-edge. We consider the latter an important parameter because it gives a measure of the volume occupied by the cellular fraction in the rapidly growing rim of the tumor,29 allows the estimation of TIFP,35 and is an important aspect of mechanical modeling of tumor stresses and fluxes. Because vp is typically quite small, distribution volumes approximate porosities and, as noted, are generally more stable than estimates of ve; these measures can be used to estimate the fluid conductivity, K, of the tumor,35 and via Darcy’s law, the tumor interstitial fluid pressure.
Finally, in the analysis of DCE-MRI studies, a novel extension of both Patlak and Logan approaches to DCE-MRI modeling allows the estimation of VD-peri, the distribution volume in the mostly normal tissue surrounding the Model 3 tumor region, and the tumor exudate/intersitial flow (Flux) across the boundary between the tumor and its normal surround.33 VD-peri and Flux are highly correlated, are important aspects of mechanical modeling of tumor stresses and fluxes, and are themselves signals of changes in the physiology of the tumor (because of changes in tumor mechanical stresses and fluid pressures) when the tumor is confronted with therapeutic challenges.
To complete the array of measures of tumor physiology, a single-slice arterial spin-labeling experiment was conducted. The mean estimate of TBF in the Model 3 region was employed as a measure of changes in tumor physiology after the administration of Avastin.
In summary, for the tumor in the Model 3 region, we have estimates of Ktrans, vp, ve, VD-tumor, VD-edge, VD-peri, Flux, K, TIFP and TBF, before and after the administration of Avastin (please refer to the supporting information for details).
2.5 |. Histology
After the second MRI study, the animals were continued on isoflurane anesthesia and transcardially perfused with normal saline followed by buffered 4% paraformaldehyde. The brains were carefully removed and stored in fixative overnight at 4°C. Two-millimeter thick coronal slices through the tumor were obtained using a rat-brain matrix (Activational Systems, Inc., Warren, MI, USA). The brain tissue was processed using a VIP Tissue Tek Processing center and embedded in paraffin. Seven-micrometer thick sections were cut from the paraffin block corresponding to the selected MR imaging slices and placed on Superfrost Plus (Fisher Scientific, Waltham, MA, USA) slides. These sections contained the largest tumor area and were stained with H&E after dehydration and rehydration in an ethanol series for evaluation of tumor ROIs.30 The slides were scanned at 20X magnification in a Leica Aperio CS2 bright field illumination scanner (Leica Biosystems Inc., Buffalo Grove, IL, USA). Images were collected using Aperio ImageScope software. Brain sections from another batch of U251 tumor-bearing rats untreated with Avastin were used to immunostain for VEGF expression.
2.6 |. Statistical analysis
There were 29 animals across six time points. Three animals were not included in the final analyses due to technical problems during imaging. In the final analysis, there were four animals in each of the 1-, 4-, 12- and 24-h groups and five each in the 2- and 8-h time points. For each animal, MRI parameters were estimated before (pre) and after (post) drug administration for a given ROI, with the timing of the second measurement depending upon the group assignment for each animal. The outcome of interest for each parameter was the % change between the pre- and post-Avastin parameters. Percentage changes were calculated for each animal as , rather than the usual , where Pre is the value of the parameter in the first study, and Post is its value in the second study, postadministration. Because this preserves the null hypothesis that the Pre and Post samples are drawn from the same distribution, this has the effect of removing a source of bias in the presentation of results. Mean and standard deviations of the parameter % changes for the animals in each time point were computed, along with the % change for each parameter in this manner.
SAS version 9.4 was used to perform all data analyses. t-tests were performed to test whether the % change was equal to zero for each time point (1, 2, 4, 8, 12 and 24 h after drug administration). The testing level was set at 0.05 for these comparisons. Analysis of covariance (ANCOVA), testing the % changes among the time points while adjusting for predrug administration measurements, was used to assess the differences in the % changes for the parameters among the time points. If the overall difference was significant, additional pairwise comparisons of the time points were performed. The testing level for the overall difference was set at 0.05. For the pairwise comparisons, the testing level was set at 0.01 to account for multiple comparisons.
3 |. RESULTS
At the time of imaging, average tumor diameter on a coronal image was about 4 mm at its largest extent. Data from the pretreatment imaging sessions presented a typical space-occupying tumor with mass effects, as seen in human GBMs, but, unlike human GBMs, with limited infiltration. Central tumor enhancement was observed, and in all cases was associated with peri-tumoral edema flow. In several cases, mass effect, with midline shift and occasional compression of ventricles, was observed. The extent of tumor borders observed on imaging during post-treatment MRI was matched by their corresponding H&E-stained sections. A set of T1 images along with its corresponding TBF map, model selection map and H&E-stained brain section from one rat are shown in Figure 1. Figure 2 shows an example of pre- and post-treatment parameter maps from a study conducted 1 h after the administration of Avastin, where no significant effects of the treatment on measured vascular parameters were observed. Parameter values from the two imaging sessions along with their respective % changes and images from VEGF-immunostained brain sections are provided in the supporting information.
FIGURE 1.

An example of spatial agreement between MRI parameters and histology in tumor location and distribution. A, T1 postcontrast; B, tumor blood flow; C, model selection; and D, hematoxylin and eosin (H&E) staining. The color scale bar for blood flow depicts values of 0–104 mL.min−1 (black to white). Tumor pixels showing model selection: white, Model 3; orange, Model 2
FIGURE 2.
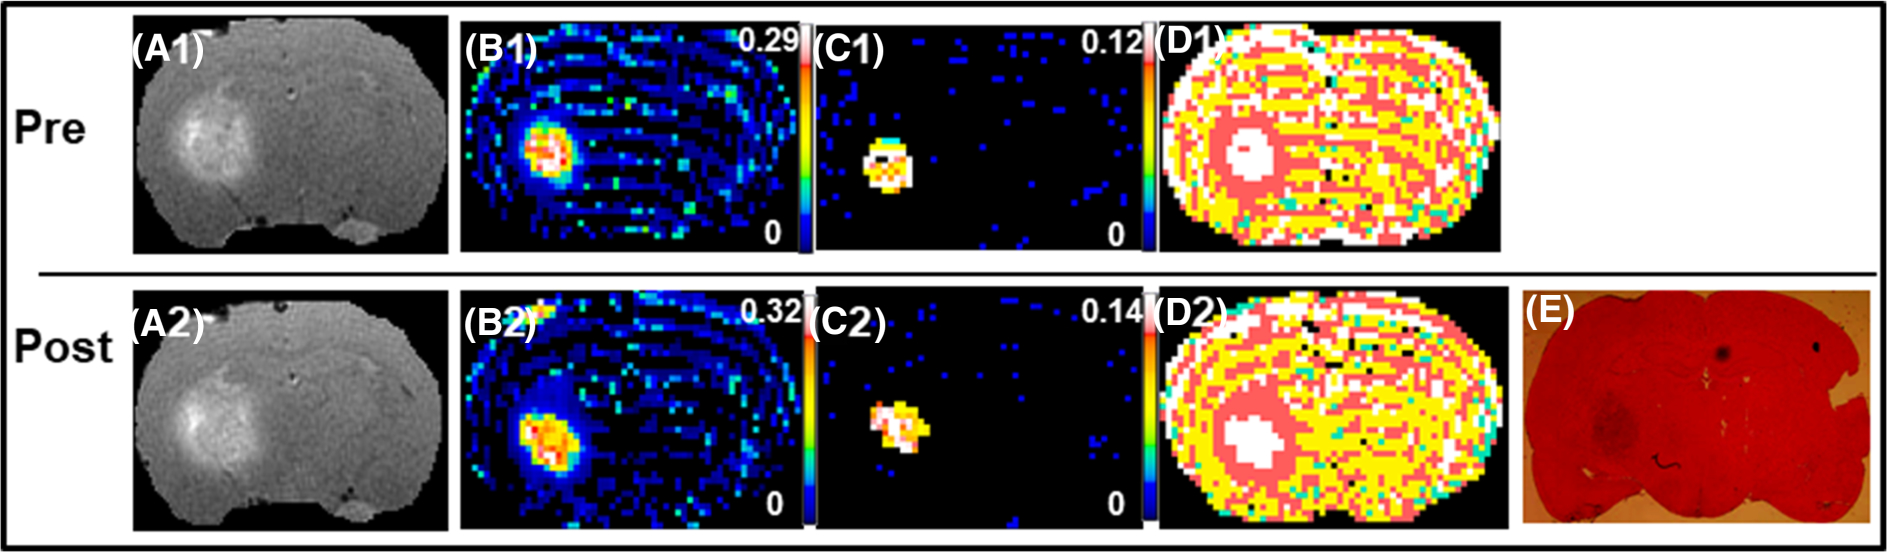
An example from a 1-h post-Avastin treatment study that showed no significant effects of therapy. The top panel is pretreatment (A1-D1) and the bottom panel, post-treatment (A2-E). The parameters maps shown from left to right are: postcontrast T1, Ktrans, ve, model selection and the corresponding hematoxylin and eosin (H&E) stained brain section. Note the relative stable distribution of all parameters between the two sessions, suggesting that Avastin did not exert significant effects on tumor vasculature and tumor microenvironment at 1 h after administration. The color scale bars represent the lowest to highest (black to white) values for the different parameters as shown on their respective maps. For the model map pixels, white is Model 3 acceptance, pink is Model 2 acceptance and yellow is Model 1 acceptance (green is not a number)
Figure 3 illustrates an experiment from the 4-h time point, wherein several DCE-MRI measured parameters were affected. Temporal changes in TBF, Ktrans, Flux and the parameter that summarizes their collective effect (i.e. TIFP), are presented in Figure 4. A trend towards increased TBF between 4 and 8 h after treatment was followed by a statistically significant increase at 12 and 24 h after Avastin administration. At 2 and 4 h postadministration, changes in Ktrans were significantly lower than zero. As to Flux, all but the 1-h time point had changes significantly lower than zero, whereas TIFP measures were significantly decreased only at the 12-h time point.
FIGURE 3.

An example from a 4-h post-Avastin treatment study that showed significant effects of therapy. The top panel is pre-treatment (A1-D1) and the bottom panel, post-treatment (A2-E). The parameter maps shown from left to right are: postcontrast T1, Ktrans, ve, model selection and the corresponding hematoxylin and eosin (H&E) stained brain section. Note the decrease in the distribution of Model 3 voxels in tumor tissue (right hemisphere) from pretreatment to post-treatment maps indicative of effects of Avastin on tumor microenvironment at this time point. The color scale bars represent the lowest to highest (black to white) values for the different parameters as shown on their respective maps. For the model map pixels, white is Model 3 acceptance, orange is Model 2 acceptance and yellow is Model 1 acceptance (green is not a number)
FIGURE 4.

Tumor fluid flows and fluxes. A graph of changes in cerebral blood flow (CBF), blood-to-brain forward volumetric transfer constant (Ktrans), tumor interstitial fluid pressure (TIFP) and peri-tumoral interstitial fluid flow (Flux) at times after Avastin (10 mg/kg; iv) treatment. The values are plotted as mean ± standard error of the mean % differences between the pre- and post-treatment values. Asterisks represent significant difference, p < 0.05
Changes with time in contrast agent distribution spaces in the tumor are shown in Figure 5. These are vp, VD-tumor and ve. Estimates of vp were significantly lower 2 to 12 h after Avastin administration. VD-tumor, on the other hand, exhibited significant decreases only at the 2- and 8-h time points. For ve, the % change was significantly lower than zero only at the 2-h time point. Responses of VD-edge and VD-peri, the extracellular distribution volume of the boundary of the tumor itself, and of the normal tissue transition zone immediately adjacent to the tumor boundary, are shown in Figure 6. They showed significant decreases at 2-, 4-, 8- and 24-h time points for VD-edge and VD-peri (Figure 6), indicative of possible post-treatment tissue compression in the periphery of the tumor. Somewhat following this trend, K was also significantly low at 2, 4 and 8 h.
FIGURE 5.

Tumor distribution spaces. A graph of changes in plasma distribution volume (vp), MRCA extracellular distribution volume (VD) and interstitial volume fraction (ve) at times after Avastin (10 mg/kg; iv) treatment. The values are plotted as mean ± standard error of the mean % differences between the pre- and post-treatment values. Asterisks represent significant difference, p < 0.05
FIGURE 6.

Tumor peripheral spaces. A graph of changes in extracellular distribution volume in the tumor edge (VD-edge), in the immediately surrounding normal tissue, VD-peri and in K (hydraulic conductivity in the tumor periphery) as a function of time after Avastin (10 mg/kg; iv) treatment. These parameters reflect interactions at the boundary of the tumor and normal brain. The values are plotted as mean ± standard error of the mean from the % differences between the pre- and post-treatment values. Asterisks represent significant difference, p < 0.05
An ANCOVA to test the differences between the different time points for a given parameter showed no consistently significant differences for most parameters. For Flux, however, the overall difference in the % changes among the time points was significant (p = 0.01), with the 1-h time point for the average % change being significantly higher than the other five time points (p < 0.01 for all).
4 |. DISCUSSION
This paper describes the timeline of glioblastoma vascular normalization during the first 24 h after a single iv injection of Avastin in a rat GBM model. Apart from more commonly measured parameters such as TBF, blood volume fraction and vascular permeability, acute changes in such novel indices of the TME as tumoral and transtumoral distribution spaces, hydraulic conductivity, exudate Flux and TIFP are also reported. Together, they contribute to a comprehensive picture of the tumor vascular status, and tumor fluid mechanical properties, and its downstream effects on the TME in an embedded brain tumor. Several of these indices also showed acute responses to Avastin treatment, suggesting their use as predictive biomarkers.51
After an iv injection at 10 mg/kg, Avastin began to exert effects beginning as early as 2 h after administration in a parameter-dependent manner. Avastin led to decreased Ktrans values at 2 and 4 h, along with concomitant decreases in vp. This decrease in vp persisted with a slight elevation from 4 to 8 h postadministration. The changes in vp were not significantly accompanied by Ktrans lowering at this time point. In agreement with known and presumed effects of vascular normalization by Avastin,52 decreased permeability was accompanied by a trend of increasing TBF values throughout the study (Figure 4). TBF changes were statistically significant at 12 and 24 h following Avastin delivery (Figure 4). Opposing directions of changes in TBF and Ktrans have also been reported after radiotherapy in this tumor model.31 The slightly longer lasting effects on vp are consistent with previous reports of relative blood volume being an imaging biomarker of Avastin treatment efficacy.53
We note that in previous work, tumor VEGF-A expression has been reported to modulate the effects of Avastin.54 In that work, two mouse xenograft models of melanoma were employed, A-07 and R-18 with high and low VEGF-A expression, respectively. Two 5-mg/kg doses of Avastin were used in a 7-day period and the mice were imaged before and after the second drug dose. The A-07 tumor had higher pretreatment Ktrans values compared with the R-18 tumor and showed lower Ktrans values after Avastin treatment. The R-18 tumor with low VEGF-A did not respond to Avastin treatment. The extent of Ktrans reduction in A-07 was progressive from post-treatment Day 3 to Day 7. Comparable with the present data, no significant changes were reported in ve at any post-treatment time point.54
The 2-, 4- and 8-h time points after Avastin administration also showed decreased peri-tumoral exudate Flux and tumor hydraulic conductivity, K. Flux was very sensitive to treatment, with all but the 1-h time point showing statistically significant decreases after treatment. Several of these time points also coincided with decreases in VD-edge and -peri, which have been shown previously as predictive of Flux, and imply a coupling between solid and fluid mechanical effects in the periphery of the tumor.33 A concurrent decrease in TIFP was observed only at 12 h after Avastin treatment, and continued to be low, but not statistically significant, at 24 h. The distribution volume in the tumor (i.e. tissue compression) is a strong predictor of TIFP35 as well as tumor perfusion, pointing to a solid and fluid mechanical coupling.
Note that the effects of Avastin treatment in this study may underestimate clinical effects, because it is a humanized antibody active against VEGF produced by the human U251 cells and not rat stromal VEGF. Supporting this view are data that show orthotopically implanted U251 cells stain positively for VEGF (supporting information) and previous reports that show the biological effects of bevacizumab in U251 glioma-bearing animals.55–57 Note also that the extent of reduction in vp at 48 h was about 36% following treatment with a VEGF antibody active against both human and murine VEGF in a subcutaneous colorectal cancer model.58 By contrast, in the current study, although vp decreased significantly until 8 h after treatment, it subsequently recovered (Figure 5), probably because only tumor-derived human VEGF and not murine VEGF was affected by the drug.
This investigation, and in particular this set of parametric estimates, was motivated by an interest in the solid and fluid mechanical properties of cerebral tumors. As in all tumors, the local physical properties of the tissue influence the behavior of the cells59,60; a stiffer environment tends to select for an infiltrative phenotype.61–63 In vivo, this picture is complicated by the magnetic resonance elastography finding that embedded cerebral tumor models (e.g. U87) are uniformly less stiff than the surrounding normal brain.64 Our preliminary modeling65 points to the interaction between the fluid and solid phases in these soft media as a critical determinant of the mechanical stress state in the cerebral tumors that are being studied.
Mechanical models have previously demonstrated a coupling of interstitial fluid and solid tissue behavior in tumors, including glioma.66–69 One missing element in many previous investigations of the physical properties of cerebral tumors is a relatively complete picture of the fluid spaces and fluxes in and around the tumor. The dataset herein is unique in its array of noninvasive measures of those properties under both resting and changing conditions. Vascular parameters—blood flow and vascular permeability—plus tissue spaces (interstitial volume fraction, plasma volume fraction) can be coupled to local stresses through mechanical models. Using poroelastic theory and best estimates of tissue mechanical properties (stiffness, Poisson ratio, fluid conductivity), measures of spaces and fluxes can be used to estimate mechanical stresses. As noted, these stresses are important in tumor cellular signaling for replication rate and infiltrative capacity.
By reducing vascular permeability, other aspects of the TME are also altered, including TIFP, interstitial space in and around the tumor, and exudate flux from the tumor into the surrounding tissue. Avastin administration appears to have an indirect effect on such mechanically linked properties as solid stress and stiffness in the tumor and its surround. Changes in such parameters as Ktrans, interstitial spaces, plasma volume, tumor rim exudate flux and hydraulic conductivity following Avastin administration provide insight into physical changes within the tumor that are important for understanding the microenvironment and its potential for inducing tumor progression. The perturbation in the physical properties introduced by Avastin will serve as a check on mechanical modeling of in situ tumors and provides assurance that any model produced will be robust in its description of a cerebral tumor undergoing physical changes. Thus, while an investigation of the short-term effects of Avastin on the microvasculature of a xenograft tumor might be considered somewhat esoteric in its focus, the larger significance of this investigation is that it provides a unique description of the physical properties of tumor vasculature, both resting and reacting, in an embedded cerebral tumor.
5 |. CONCLUSIONS
The parameters described in this study expand the repertoire of DCE-MRI investigations to encompass several aspects of glioma pathophysiology that can be measured concurrently, repeatedly and minimally invasively to understand responses to treatments, and to extend the analysis of those responses to an evaluation of the mechanical state of the tumor and its microenvironment.
Supplementary Material
ACKNOWLEDGEMENTS
All the authors thank Jun Xu for excellent technical assistance. Research reported in this publication was also supported by the National Cancer Institute of the National Institutes of Health under award numbers R01CA135329-01 and R01CA218596. The content is solely the responsibility of the authors and does not necessarily represent the official views of the National Institutes of Health. TNN and RE contributed equally to this work.
Funding information
National Institutes of Health; National Institutes of Health; National Cancer Institute
Abbreviations used:
- 2GE
dual-echo gradient-echo
- ANCOVA
analysis of covariance
- ASL
arterial spin labeling
- DCE-MRI
dynamic contrast-enhanced MRI
- FDA
US Food and Drug Administration
- Flux
peri-tumoral interstitial flow
- GBM
glioblastoma
- H&E
hematoxylin and eosin
- K
hydraulic conductivity
- kep
reverse transfer constant
- Ktrans
forward volumetric transfer constant
- LL
Look-Locker
- MRCA
magnetic resonance contrast agent
- NA
number of averages
- NE
number of echoes
- OS
overall survival
- PFS
progression-free survival
- ROI
region of interest
- RTOG
Radiation Therapy Oncology Group
- TBF
tumor blood flow
- TIFP
tumor interstitial fluid pressure
- TME
tumor microenvironment
- VD
extracellular distribution volume
- ve
interstitial volume fraction
- VEGF
vascular endothelial growth factor
- VEGFR
VEGF receptor
- vp
plasma distribution volume
Footnotes
SUPPORTING INFORMATION
Additional supporting information may be found online in the Supporting Information section at the end of this article.
REFERENCES
- 1.Yu L, Wu X, Cheng Z, et al. Interaction between bevacizumab and murine VEGF-A: a reassessment. Invest Ophthalmol Vis Sci. 2008;49(2):522–527. [DOI] [PubMed] [Google Scholar]
- 2.Field KM, Jordan JT, Wen PY, Rosenthal MA, Reardon DA. Bevacizumab and glioblastoma: scientific review, newly reported updates, and ongoing controversies. Cancer. 2015;121(7):997–1007. [DOI] [PubMed] [Google Scholar]
- 3.Brandes AA, Mason W, Pichler J, et al. Can bevacizumab prolong survival for glioblastoma patients through multiple lines of therapy? Future Oncol. 2014;10(7):1137–1145. [DOI] [PubMed] [Google Scholar]
- 4.Hacibekiroglu I, Kodaz H, Erdogan B, et al. Single-agent bevacizumab is an effective treatment in recurrent glioblastoma. Med Oncol (Northwood, London, England). 2015;32(2):460. 10.1007/s12032-014-0460-3 [DOI] [PubMed] [Google Scholar]
- 5.Friedman HS, Prados MD, Wen PY, et al. Bevacizumab alone and in combination with irinotecan in recurrent glioblastoma. J Clin Oncol. 2009;27(28): 4733–4740. [DOI] [PubMed] [Google Scholar]
- 6.Ananthnarayan S, Bahng J, Roring J, et al. Time course of imaging changes of GBM during extended bevacizumab treatment. J Neurooncol. 2008;88(3): 339–347. [DOI] [PubMed] [Google Scholar]
- 7.Norden AD, Young GS, Setayesh K, et al. Bevacizumab for recurrent malignant gliomas: efficacy, toxicity, and patterns of recurrence. Neurology. 2008; 70(10):779–787. [DOI] [PubMed] [Google Scholar]
- 8.Chinot OL, Wick W, Mason W, et al. Bevacizumab plus radiotherapy-temozolomide for newly diagnosed glioblastoma. N Engl J Med. 2014;370(8): 709–722. [DOI] [PubMed] [Google Scholar]
- 9.Gilbert MR, Dignam JJ, Armstrong TS, et al. A randomized trial of bevacizumab for newly diagnosed glioblastoma. N Engl J Med. 2014;370(8):699–708. [DOI] [PMC free article] [PubMed] [Google Scholar]
- 10.Wick W, Gorlia T, Bendszus M, et al. Lomustine and Bevacizumab in Progressive Glioblastoma. N Engl J Med. 2017;377(20):1954–1963. [DOI] [PubMed] [Google Scholar]
- 11.Dhillon S Bevacizumab combination therapy: a review of its use in patients with epithelial ovarian, fallopian tube, or primary peritoneal cancer. BioDrugs. 2013;27(4):375–392. [DOI] [PubMed] [Google Scholar]
- 12.Tewari KS, Sill MW, Penson RT, et al. Bevacizumab for advanced cervical cancer: final overall survival and adverse event analysis of a randomised, controlled, open-label, phase 3 trial (Gynecologic Oncology Group 240). Lancet. 2017;390(10103):1654–1663. [DOI] [PMC free article] [PubMed] [Google Scholar]
- 13.Roskoski R Jr. Vascular endothelial growth factor (VEGF) signaling in tumor progression. Crit Rev Oncol Hematol. 2007;62(3):179–213. [DOI] [PubMed] [Google Scholar]
- 14.Mukherji SK. Bevacizumab (Avastin). Am J Neuroradiol. 2010;31(2):235–236. [DOI] [PMC free article] [PubMed] [Google Scholar]
- 15.Tong RT, Boucher Y, Kozin SV, Winkler F, Hicklin DJ, Jain RK. Vascular normalization by vascular endothelial growth factor receptor 2 blockade induces a pressure gradient across the vasculature and improves drug penetration in tumors. Cancer Res. 2004;64(11):3731–3736. [DOI] [PubMed] [Google Scholar]
- 16.Yang AD, Bauer TW, Camp ER, et al. Improving delivery of antineoplastic agents with anti-vascular endothelial growth factor therapy. Cancer. 2005; 103(8):1561–1570. [DOI] [PubMed] [Google Scholar]
- 17.Fukumura D, Jain RK. Tumor microvasculature and microenvironment: targets for anti-angiogenesis and normalization. Microvasc Res. 2007;74(2–3): 72–84. [DOI] [PMC free article] [PubMed] [Google Scholar]
- 18.Goel S, Duda DG, Xu L, et al. Normalization of the vasculature for treatment of cancer and other diseases. Physiol Rev. 2011;91(3):1071–1121. [DOI] [PMC free article] [PubMed] [Google Scholar]
- 19.Le Serve AW, Hellmann K. Metastases and the normalization of tumour blood vessels by ICRF 159: a new type of drug action. Br Med J. 1972; 1(5800):597–601. [DOI] [PMC free article] [PubMed] [Google Scholar]
- 20.Goel S, Wong AH, Jain RK. Vascular normalization as a therapeutic strategy for malignant and nonmalignant disease. Cold Spring Harb Perspect Med. 2012;2(3):a006486. 10.1101/cshperspect.a006486 [DOI] [PMC free article] [PubMed] [Google Scholar]
- 21.Jain RK. Normalization of tumor vasculature: an emerging concept in antiangiogenic therapy. Science. 2005;307(5706):58–62. [DOI] [PubMed] [Google Scholar]
- 22.Reardon DA, Turner S, Peters KB, et al. A review of VEGF/VEGFR-targeted therapeutics for recurrent glioblastoma. J Natl Compr Canc Netw. 2011; 9(4):414–427. [DOI] [PMC free article] [PubMed] [Google Scholar]
- 23.Pichler J, Pachinger C, Pelz M, Kleiser R. MRI assessment of relapsed glioblastoma during treatment with bevacizumab: volumetric measurement of enhanced and FLAIR lesions for evaluation of response and progression-a pilot study. Eur J Radiol. 2013;82(5):e240–e245. [DOI] [PubMed] [Google Scholar]
- 24.Thompson EM, Dosa E, Kraemer DF, Neuwelt EA. Correlation of MRI sequences to assess progressive glioblastoma multiforme treated with bevacizumab. J Neurooncol. 2011;103(2):353–360. [DOI] [PubMed] [Google Scholar]
- 25.Hilario A, Sepulveda JM, Hernandez-Lain A, et al. Leakage decrease detected by dynamic susceptibility-weighted contrast-enhanced perfusion MRI predicts survival in recurrent glioblastoma treated with bevacizumab. Clin Transl Oncol. 2017;19(1):51–57. [DOI] [PubMed] [Google Scholar]
- 26.Najafi M, Soltanian-Zadeh H, Jafari-Khouzani K, Scarpace L, Mikkelsen T. Prediction of glioblastoma multiform response to bevacizumab treatment using multi-parametric MRI. PLoS One. 2012;7(1):e29945. 10.1371/journal.pone.0029945 [DOI] [PMC free article] [PubMed] [Google Scholar]
- 27.Paldino MJ, Desjardins A, Friedman HS, Vredenburgh JJ, Barboriak DP. A change in the apparent diffusion coefficient after treatment with bevacizumab is associated with decreased survival in patients with recurrent glioblastoma multiforme. Br J Radiol. 2012;85(1012):382–389. [DOI] [PMC free article] [PubMed] [Google Scholar]
- 28.Pope WB, Lai A, Mehta R, et al. Apparent diffusion coefficient histogram analysis stratifies progression-free survival in newly diagnosed bevacizumab-treated glioblastoma. Am J Neuroradiol. 2011;32(5):882–889. [DOI] [PMC free article] [PubMed] [Google Scholar]
- 29.Aryal MP, Nagaraja TN, Brown SL, et al. Intratumor distribution and test-retest comparisons of physiological parameters quantified by dynamic contrast-enhanced MRI in rat U251 glioma. NMR Biomed. 2014;27(10):1230–1238. [DOI] [PMC free article] [PubMed] [Google Scholar]
- 30.Aryal MP, Nagaraja TN, Keenan KA, et al. Dynamic contrast enhanced MRI parameters and tumor cellularity in a rat model of cerebral glioma at 7 T. Magn Reson Med. 2014;71(6):2206–2214. [DOI] [PMC free article] [PubMed] [Google Scholar]
- 31.Brown SL, Nagaraja TN, Aryal MP, et al. MRI-tracked tumor vascular changes in the hours after single-fraction irradiation. Radiat Res. 2015;183(6): 713–721. [DOI] [PubMed] [Google Scholar]
- 32.Elmghirbi R, Nagaraja TN, Brown SL, et al. Acute temporal changes of MRI-tracked tumor vascular parameters after combined anti-angiogenic and radiation treatments in a rat glioma model: identifying signatures of synergism. Radiat Res. 2017;187(1):79–88. [DOI] [PMC free article] [PubMed] [Google Scholar]
- 33.Ewing JR, Nagaraja TN, Aryal MP, et al. Peritumoral tissue compression is predictive of exudate flux in a rat model of cerebral tumor: an MRI study in an embedded tumor. NMR Biomed. 2015;28(11):1557–1569. [DOI] [PMC free article] [PubMed] [Google Scholar]
- 34.Ewing JR, Knight RA, Nagaraja TN, et al. Patlak plots of Gd-DTPA MRI data yield blood-brain transfer constants concordant with those of 14C-sucrose in areas of blood-brain opening. Magn Reson Med. 2003;50(2):283–292. [DOI] [PubMed] [Google Scholar]
- 35.Elmghirbi R, Nagaraja TN, Brown SL, et al. Toward a noninvasive estimate of interstitial fluid Ppressure by dynamic contrast-enhanced magnetic resonance imaging in a rat model of cerebral tumor. Magn Reson Med. 2018;80:2042–2052. [DOI] [PMC free article] [PubMed] [Google Scholar]
- 36.Ewing JR, Brown SL, Nagaraja TN, et al. MRI measurement of change in vascular parameters in the 9L rat cerebral tumor after dexamethasone administration. J Magn Reson Imaging. 2008;27(6):1430–1438. [DOI] [PMC free article] [PubMed] [Google Scholar]
- 37.Nagaraja TN, Aryal MP, Brown SL, et al. Cilengitide-induced temporal variations in transvascular transfer parameters of tumor vasculature in a rat glioma model: identifying potential MRI biomarkers of acute effects. PLoS One. 2013;8(12):e84493. 10.1371/journal.pone.0084493 [DOI] [PMC free article] [PubMed] [Google Scholar]
- 38.Nagaraja TN, Elmghirbi R, Brown SL, et al. Reproducibility and relative stability in magnetic resonance imaging indices of tumor vascular physiology over a period of 24h in a rat 9L gliosarcoma model. Magn Reson Imaging. 2017;44:131–139. [DOI] [PMC free article] [PubMed] [Google Scholar]
- 39.Bagher-Ebadian H, Jain R, Nejad-Davarani SP, et al. Model selection for DCE-T1 studies in glioblastoma. Magn Reson Med. 2012;68(1):241–251. [DOI] [PMC free article] [PubMed] [Google Scholar]
- 40.Ewing JR, Bagher-Ebadian H. Model selection in measures of vascular parameters using dynamic contrast-enhanced MRI: experimental and clinical applications. NMR Biomed. 2013;26(8):1028–1041. [DOI] [PMC free article] [PubMed] [Google Scholar]
- 41.Ewing JR, Brown SL, Lu M, et al. Model selection in magnetic resonance imaging measurements of vascular permeability: Gadomer in a 9L model of rat cerebral tumor. J Cereb Blood Flow Metab. 2006;26(3):310–320. [DOI] [PubMed] [Google Scholar]
- 42.Burnham KP, Anderson DR. Model Selection and Multimodal Inference. A Practical Information - Theoritical Approach, 2nd edition. New York, NY: Springer; 2002. [Google Scholar]
- 43.Lehmann EL, Casella G. Theory of Point Estimation, 2nd edition. New York, NY: Springer-Verlag; 1998. [Google Scholar]
- 44.Tofts P, Kermode A. Measurement of the blood-brain barrier permeability and leakage space using dynamic MR imaging. 1. Fundamental concepts. Magn Reson Med. 1991;17(2):357–367. [DOI] [PubMed] [Google Scholar]
- 45.Patlak CS, Blasberg RG, Fenstermacher JD. Graphical evaluation of blood-to-brain transfer constants from multiple-time uptake data. J Cereb Blood Flow Metab. 1983;3(1):1–7. [DOI] [PubMed] [Google Scholar]
- 46.Patlak CS, Blasberg RG, Fenstermacher JD. An evaluation of errors in the determination of blood flow by the indicator fractionation and tissue equilibration (Kety) methods. J Cereb Blood Flow Metab. 1984;4(1):47–60. [DOI] [PubMed] [Google Scholar]
- 47.Tofts PS, Brix G, Buckley DL, et al. Estimating kinetic parameters from dynamic contrast-enhanced T(1)-weighted MRI of a diffusable tracer: standardized quantities and symbols. J Magn Reson Imaging. 1999;10(3):223–232. [DOI] [PubMed] [Google Scholar]
- 48.Logan J, Fowler JS, Volkow ND, et al. Graphical analysis of reversible radioligand binding from time-activity measurements applied to [N-11C-methyl]-(−)-cocaine PET studies in human subjects. J Cereb Blood Flow Metab. 1990;10(5):740–747. [DOI] [PubMed] [Google Scholar]
- 49.Chwang WB, Jain R, Bagher-Ebadian H, et al. Measurement of rat brain tumor kinetics using an intravascular MR contrast agent and DCE-MRI nested model selection. J Magn Reson Imaging. 2014;40(5):1223–1229. [DOI] [PMC free article] [PubMed] [Google Scholar]
- 50.Essig M, Rohrer M, Giesel F, et al. Human brain tumor imaging with a protein-binding MR contrast agent: initial experience. Eur Radiol. 2010;20(1): 218–226. [DOI] [PubMed] [Google Scholar]
- 51.Farrar CT, Kamoun WS, Ley CD, et al. Sensitivity of MRI tumor biomarkers to VEGFR inhibitor therapy in an orthotopic mouse glioma model. PLoS One. 2011;6(3):e17228. 10.1371/journal.pone.0017228 [DOI] [PMC free article] [PubMed] [Google Scholar]
- 52.De Fazio S, Russo E, Ammendola M, Donato Di Paola E, De Sarro G. Efficacy and safety of bevacizumab in glioblastomas. Curr Med Chem. 2012;19(7): 972–981. [DOI] [PubMed] [Google Scholar]
- 53.Kickingereder P, Wiestler B, Burth S, et al. Relative cerebral blood volume is a potential predictive imaging biomarker of bevacizumab efficacy in recurrent glioblastoma. Neuro Oncol. 2015;17(8):1139–1147. [DOI] [PMC free article] [PubMed] [Google Scholar]
- 54.Gaustad JV, Simonsen TG, Smistad R, Wegner CS, Andersen LM, Rofstad EK. Early effects of low dose bevacizumab treatment assessed by magnetic resonance imaging. BMC Cancer. 2015;15(1):900. 10.1186/s12885-015-1918-1 [DOI] [PMC free article] [PubMed] [Google Scholar]
- 55.Grossman R, Brastianos H, Blakeley JO, et al. Combination of anti-VEGF therapy and temozolomide in two experimental human glioma models. J Neurooncol. 2014;116(1):59–65. [DOI] [PMC free article] [PubMed] [Google Scholar]
- 56.Wang W, Sivakumar W, Torres S, et al. Effects of convection-enhanced delivery of bevacizumab on survival of glioma-bearing animals. Neurosurg Focus. 2015;38(3):E8. 10.3171/2015.1.FOCUS14743 [DOI] [PubMed] [Google Scholar]
- 57.Ke LD, Shi YX, Yung WK. VEGF(121), VEGF(165) overexpression enhances tumorigenicity in U251 MG but not in NG-1 glioma cells. Cancer Res. 2002;62(6):1854–1861. [PubMed] [Google Scholar]
- 58.Ungersma SE, Pacheco G, Ho C, et al. Vessel imaging with viable tumor analysis for quantification of tumor angiogenesis. Magn Reson Med. 2010; 63(6):1637–1647. [DOI] [PubMed] [Google Scholar]
- 59.Kim SN, Jeibmann A, Halama K, et al. ECM stiffness regulates glial migration in Drosophila and mammalian glioma models. Development. 2014; 141(16):3233–3242. [DOI] [PubMed] [Google Scholar]
- 60.Pogoda K, Chin LK, Georges PC, et al. Compression stiffening of brain and its effect on mechanosensing by glioma cells. New J Phys. 2014;16:15. 10.1088/1367-2630/16/7/075002 [DOI] [PMC free article] [PubMed] [Google Scholar]
- 61.Ananthanarayanan B, Kim Y, Kumar S. Elucidating the mechanobiology of malignant brain tumors using a brain matrix-mimetic hyaluronic acid hydrogel platform. Biomaterials. 2011;32(31):7913–7923. [DOI] [PMC free article] [PubMed] [Google Scholar]
- 62.Grundy TJ, De Leon E, Griffin KR, et al. Differential response of patient-derived primary glioblastoma cells to environmental stiffness. Sci Rep. 2016; 6(1):23353. 10.1038/srep23353 [DOI] [PMC free article] [PubMed] [Google Scholar]
- 63.Ulrich TA, de Juan Pardo EM, Kumar S. The mechanical rigidity of the extracellular matrix regulates the structure, motility, and proliferation of glioma cells. Cancer Res. 2009;69(10):4167–4174. [DOI] [PMC free article] [PubMed] [Google Scholar]
- 64.Jamin Y, Boult JKR, Li J, et al. Exploring the biomechanical properties of brain malignancies and their pathologic determinants in vivo with magnetic resonance elastography. Cancer Res. 2015;75(7):1216–1224. [DOI] [PMC free article] [PubMed] [Google Scholar]
- 65.Rey J, Sarntinoranont M, Ewing JR. Effects of leaky tumor vasculature on tissue stress and porosity in a biphasic model of brain glioma. Summer Biomechanics, Bioengineering and Biotransport Conference. Seven Springs, PA; 25–28 June 2019. [Google Scholar]
- 66.Angeli S, Emblem KE, Due-Tonnessen P, Stylianopoulos T. Towards patient-specific modeling of brain tumor growth and formation of secondary nodes guided by DTI-MRI. NeuroImage Clin. 2018;20:664–673. [DOI] [PMC free article] [PubMed] [Google Scholar]
- 67.Angeli S, Stylianopoulos T. Biphasic modeling of brain tumor biomechanics and response to radiation treatment. J Biomech. 2016;49(9):1524–1531. [DOI] [PMC free article] [PubMed] [Google Scholar]
- 68.Sarntinoranont M, Rooney F, Ferrari M. Interstitial stress and fluid pressure within a growing tumor. Ann Biomed Eng. 2003;31(3):327–335. [DOI] [PubMed] [Google Scholar]
- 69.Stylianopoulos T, Martin JD, Snuderl M, Mpekris F, Jain SR, Jain RK. Coevolution of solid stress and interstitial fluid pressure in tumors during progression: implications for vascular collapse. Cancer Res. 2013;73(13):3833–3841. [DOI] [PMC free article] [PubMed] [Google Scholar]
Associated Data
This section collects any data citations, data availability statements, or supplementary materials included in this article.